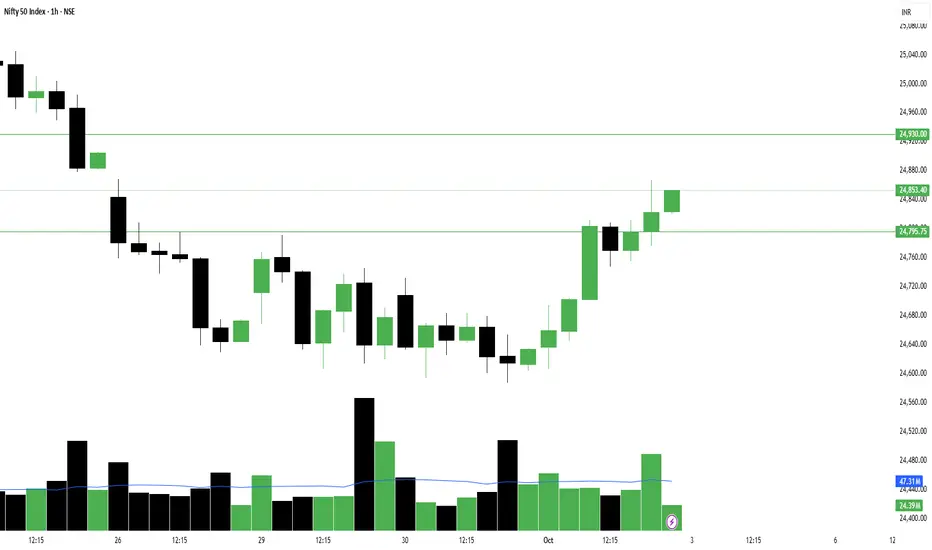
V-Shape recovery in progress for Nifty. Today we will try to study Nifty chart on an hourly scale. Hourly scale means the candles that we see in the chart represent nifty movement for 1 hour each. Each candle represents 1 hour movement of Nifty. Now let us watch closely what happened here.
1) We can see that after reaching a high of 25448 on September 25th. Nifty declined sharply. Then it consolidate in the range of 24587 and 24748. After this it moved upwards and hit the mother line at 24867.
2) As we know when the stock or index is below the Mother line the line acts as a resistance. Next 7 candles could not give closing above this line as it was a strong resistnace.
3) During the last two hours of trade we got a closing above the mother line thus it has now become a support. right now the Mother line is at 24846. So this level will be our immediate support. Below this level other supports will be at 24748 and 24587.
4) The Father line resistnace is at 24922 this level will be our immediate resistance. If we get a closing above this level the next resistances will be at 25032, 25139, 25255, 25358 and 25451. If and when we get a closing above 25451 it will be a strong Bullish breakout.
Supports and resistances other than Mother and Father line are derived by historical peaks and valleys. Mother and Father line/Support and resistance are nothing but exponential Moving averages. Mother line is 50 EMA and Father line 200 EMA.
As this is an hourly chart, Mother line is 50 Hours exponential moving average and Father line is 200 hours exponential moving average. In case of daily, weekly or monthly charts. The EMA will be 50 days, weeks or Months respectively.
To know mover about patterns such as V pattern seen here or Mother Father and Small Child theory (To understand the role of Mother line and Father line) or to be able to draw resistances and supports based on historic peaks and valleys you can read my book THE HAPPY CANDLES WAY TO WEALTH CREATION. The book is available in Amazon in paperback or Kindle version and is rated 4.8/5. This book teaches you Techno-Funda investing. (Techno Funda investing means Knowing which are Fundamentally strong companies and investing / booking profits / staying invested in them based on Technical analysis). The book has some more unique features like rating a stock with the help of Happy Candles Number wherein you can give a stock marks out of 100 based on Techincal and Fundamental analysis you have learned by reading it. Thus you can know if the stock is currently investible or not based on the marks it scores out of 100. The book also covers various aspect of behavioural finance. Lot of people who have read the book consider it as a hand book to equity investing. Buy the book you will not be dissapointed as the book is reasonably priced. Search by the key words The Happy Candles Way to wealth creation and you will get it.
Disclaimer: The above information is provided for educational purpose, analysis and paper trading only. Please don't treat this as a buy or sell recommendation for the stock or index. The Techno-Funda analysis is based on data that is more than 3 months old. Supports and Resistances are determined by historic past peaks and Valley in the chart. Many other indicators and patterns like EMA, RSI, MACD, Volumes, Fibonacci, parallel channel etc. use historic data which is 3 months or older cyclical points. There is no guarantee they will work in future as markets are highly volatile and swings in prices are also due to macro and micro factors based on actions taken by the company as well as region and global events. Equity investment is subject to risks. I or my clients or family members might have positions in the stocks that we mention in our educational posts. We will not be responsible for any Profit or loss that may occur due to any financial decision taken based on any data provided in this message. Do consult your investment advisor before taking any financial decisions. Stop losses should be an important part of any investment in equity.
Trade ideas

Nifty levels - Oct 06, 2025Nifty support and resistance levels are valuable tools for making informed trading decisions, specifically when combined with the analysis of 5-minute timeframe candlesticks and VWAP. By closely monitoring these levels and observing the price movements within this timeframe, traders can enhance the accuracy of their entry and exit points. It is important to bear in mind that support and resistance levels are not fixed, and they can change over time as market conditions evolve.
The dashed lines on the chart indicate the reaction levels, serving as additional points of significance to consider. Furthermore, take note of the response at the levels of the High, Low, and Close values from the day prior.
We hope you find this information beneficial in your trading endeavors.
* If you found the idea appealing, kindly tap the Boost icon located below the chart. We encourage you to share your thoughts and comments regarding it.
Wishing you success in your trading activities!
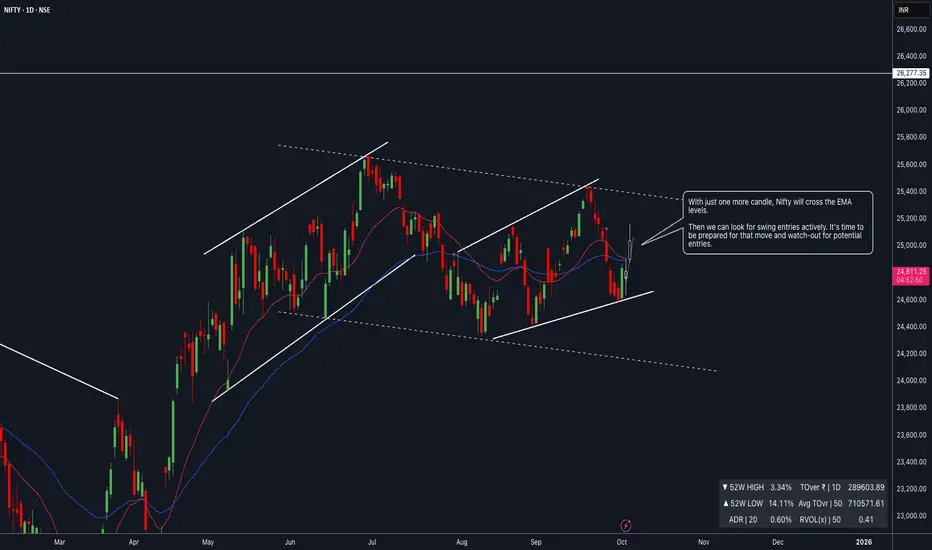
NIFTY : Nifty at a Turning Point : EMA Breakout in Sight📈 Nifty Technical & Fundamental Outlook
With just one more candle, Nifty looks set to cross above the key EMA levels. This shift is crucial as it signals potential strength building up in the market. Once that confirmation comes through, we can start actively looking for swing entries. The next few sessions will be important to track, so it’s time to stay prepared and alert for possible opportunities.
From a broader perspective, the market seems to be aligning with the best-case scenario I was expecting. The sentiment is turning bullish, and unless we witness sharp bouts of selling pressure in the coming days, the probability of a sustained recovery appears strong.
On the fundamental side, a couple of factors are supportive:
The GST cut is expected to boost consumption and corporate earnings.
With upcoming quarterly results, the overall market P/E ratio could find stronger justification if earnings come in robust.
Institutional delivery data is not reflecting any aggressive selling interest, which adds confidence to the current setup.
✅ All these tailwinds together create a strong case for a bullish bias in the near term.
As traders, the plan now is simple: track the EMA breakout, monitor earnings triggers, and stay ready for high-probability swing setups.
📢📢📢
If my perspective changes or if I gather additional fundamental data that influences my views, I will provide updates accordingly.
Thank you for following along with this journey, and I remain committed to sharing insights and updates as my trading strategy evolves. As always, please feel free to reach out with any questions or comments.
Other posts related to this particular position and scrip, if any, will be attached underneath. Do check those out too.
Disclaimer : The analysis shared here is for informational purposes only and should not be considered as financial advice. Trading in all markets carries inherent risks, and past performance is not indicative of future results. It’s essential to conduct your own research and assess your risk tolerance before making any investment decisions. The views expressed in this analysis are solely mine. It’s important to note that I am not a SEBI registered analyst, so the analysis provided does not constitute formal investment advice under SEBI regulations.
Nifty. 50 : Recovered quite nicely from the Support Nifty 50: Recovered quite nicely from the support of 24600 as previously mentioned in my post.
Lot of selling has happened in the last few sessions. Hoping for recovery to continue.
( Not a Buy / Sell Recommendation
Do your own due diligence ,Market is subject to risks, This is my own view and for learning only .)

Volume turnaround seen in Nifty on daily chart but...So as we’ve been studying for the past 3 days – NSE:NIFTY ’s candle kept closing red but the volume was with buyers. Yesterday, that clearly reflected with the index jumping +225 points in a sharp, clean move.
Cheers to those who trusted the commentary and took early entries! I did too.
The idea now is simple – hold on to that position until we see sellers’ volume with a green candle.
Now, let’s check the data for tomorrow:
– Pivot has moved up to 24770
– PP is wide, which signals a sideways to trending day with bullish tone intact
– Support for tomorrow is 24800
– Resistance for the day is 24930. Only if this level is breached and sustained for at least 1 hour can we expect a sharp move.
Any dip from here remains a buy opportunity as long as the index stays above the pivot at 24770, because the current candle is backed by buyers’ volume.
But keep this in mind – the net volume of the market is still in red. That means it’s not yet the time to open long-term portfolio positions. Wait for net volume to give a turnaround before building long-term stock holdings. Remember, we are still under the correction zone that began in September 2024.
On the sector front, rotation is being seen in Defence and Media, while Finance and NBFC continue in high momentum for the short term.
FnO stocks with buyers’ volume up are:
NSE:BHARATFORG and NSE:BSE
You can look for intraday opportunities here. But for options trading, be mindful of pivotal entries and IVP. Sometimes these stocks take more than a day to move, so don’t be disheartened if they don’t react immediately. Keep them on watch and plan your entry to manage risk.
That’s all for the day. Take care and have a profitable tomorrow.
I truly hope you learn and earn a lot with me!
---
📊 Levels at a glance:
Pivot: 24770
Support: 24800
Resistance: 24930 (sustain 1 hour = sharp move)
Pivot Percentile: Wide (sideways to trending)
Bias: Bullish as long as index holds above pivot, buy dips backed by volume
Sectors to watch: NSE:NIFTY_IND_DEFENCE , NSE:CNXMEDIA , NSE:CNXFINANCE , NBFC
FnO Focus: #BHARATFORGE, #BSE
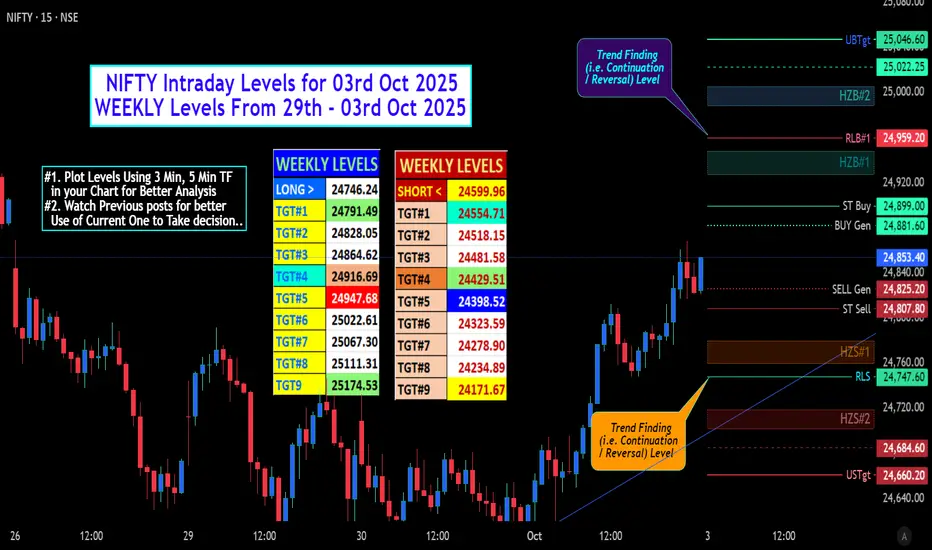
NIFTY Intraday Levels for 03rd Oct 2025 NIFTY Intraday Levels for 03rd Oct 2025
For Market view will be Updated Later. Follow Update / Note Section (Below This Page)
# "WEEKLY Levels" mentioned in BOX format.
^^^^^^^ Plot Levels Using 3 Min, 5 Min Time frame in your Chart for Better Analysis ^^^^^^^
L#1: If the candle crossed & stays above the “Buy Gen”, it is treated / considered as Bullish bias.
L#2: Possibility / Probability of REVERSAL near RLB#1 & UBTgt
L#3: If the candle stays above “Sell Gen” but below “Buy Gen”, it is treated / considered as Sidewise. Aggressive Traders can take Long position near “Sell Gen” either retesting or crossed from Below & vice-versa i.e. can take Short position near “Buy Gen” either retesting or crossed downward from Above.
L#4: If the candle crossed & stays below the “Sell Gen”, it is treated / considered a Bearish bias.
L#5: Possibility / Probability of REVERSAL near RLS#1 & USTgt
HZB (Buy side) & HZS (Sell side) => Hurdle Zone,
*** Specialty of “HZB#1, HZB#2 HZS#1 & HZS#2” is Sidewise (behaviour in Nature)
Rest Plotted and Mentioned on Chart
Color code Used:
Green =. Positive bias.
Red =. Negative bias.
RED in Between Green means Trend Finder / Momentum Change
/ CYCLE Change and Vice Versa.
Notice One thing: HOW LEVELS are Working.
Use any Momentum Indicator / Oscillator or as you "USED to" to Take entry.
⚠️ DISCLAIMER:
The information, views, and ideas shared here are purely for educational and informational purposes only. They are not intended as investment advice or a recommendation to buy, sell, or hold any financial instruments. I am not a SEBI-registered financial adviser.
Trading and investing in the stock market involves risk, and you should do your own research and analysis. You are solely responsible for any decisions made based on this research.
"As HARD EARNED MONEY IS YOUR's, So DECISION SHOULD HAVE TO BE YOUR's".
Do comment if Helpful .
NIFTY S/R for 3/10/25Support and Resistance Levels:
Support Levels: These are price points (green line/shade) where a downward trend may be halted due to a concentration of buying interest. Imagine them as a safety net where buyers step in, preventing further decline.
Resistance Levels: Conversely, resistance levels (red line/shade) are where upward trends might stall due to increased selling interest. They act like a ceiling where sellers come in to push prices down.
Breakouts:
Bullish Breakout: When the price moves above resistance, it often indicates strong buying interest and the potential for a continued uptrend. Traders may view this as a signal to buy or hold.
Bearish Breakout: When the price falls below support, it can signal strong selling interest and the potential for a continued downtrend. Traders might see this as a cue to sell or avoid buying.
MA Ribbon (EMA 20, EMA 50, EMA 100, EMA 200) :
Above EMA: If the stock price is above the EMA, it suggests a potential uptrend or bullish momentum.
Below EMA: If the stock price is below the EMA, it indicates a potential downtrend or bearish momentum.
Trendline: A trendline is a straight line drawn on a chart to represent the general direction of a data point set.
Uptrend Line: Drawn by connecting the lows in an upward trend. Indicates that the price is moving higher over time. Acts as a support level, where prices tend to bounce upward.
Downtrend Line: Drawn by connecting the highs in a downward trend. Indicates that the price is moving lower over time. It acts as a resistance level, where prices tend to drop.
Disclaimer:
I am not SEBI registered. The information provided here is for learning purposes only and should not be interpreted as financial advice. Consider the broader market context and consult with a qualified financial advisor before making investment decisions.

Investors, Traders, and PolicymakersImportance of Global Trading for Investors, Traders, and Policymakers
1. Introduction to Global Trading
Global trading operates on multiple levels: goods and services, equity and debt markets, derivatives, currencies, and commodities. It is driven by comparative advantages, technological innovation, financial liberalization, and geopolitical developments.
Key characteristics include:
Interconnected Markets: Global financial markets are highly interlinked, making regional events impactful worldwide.
Liquidity and Accessibility: Investors and traders can access international assets, currencies, and derivatives from virtually anywhere.
Information Flow: Technological advances ensure faster dissemination of economic data, corporate news, and trading signals across borders.
The significance of global trading is profound, as it influences economic growth, investment strategies, and policy decisions.
2. Importance for Investors
Investors are individuals or institutions aiming to grow wealth over time. Global trading provides them with several advantages:
2.1 Portfolio Diversification
Investing in multiple international markets reduces risk exposure to any single economy or asset class. For example, equities in emerging markets may perform differently from those in developed markets, providing a hedge against domestic volatility.
Benefits:
Reduces portfolio risk through geographical diversification.
Exposure to a variety of asset classes (equities, bonds, ETFs, commodities).
Potential for higher long-term returns in rapidly growing economies.
2.2 Access to Growth Opportunities
Certain regions offer growth potential not available domestically. For instance, emerging markets often exhibit higher GDP growth, expanding consumer bases, and rapidly developing industries.
Example: Global investors buying shares in tech companies in Southeast Asia or Latin America can capture high growth rates absent in mature markets.
2.3 Currency Hedging and Returns
International investments introduce currency risk. While this can be a risk, it also offers opportunities for gains through currency appreciation.
Strategies: Investors can use derivatives, forward contracts, and ETFs to hedge currency risk or capitalize on favorable exchange rate movements.
2.4 Inflation Protection
Global trading allows investment in countries with stronger monetary policies or lower inflation rates, providing protection against domestic inflation erosion.
2.5 Participation in Global Innovation
Global markets allow investors to access innovations, technology companies, and sectors not present locally. This ensures exposure to cutting-edge industries like AI, biotech, renewable energy, and digital assets.
3. Importance for Traders
Traders, unlike long-term investors, focus on short- to medium-term price movements to profit from market volatility. Global trading affects traders in several dimensions:
3.1 Exploiting Market Inefficiencies
Global trading creates opportunities from price differentials, arbitrage, and time zone gaps. For instance:
Time Zone Arbitrage: Traders exploit differences between Asian and European or U.S. markets.
Cross-Exchange Arbitrage: Identifying discrepancies between futures, options, and underlying spot prices across regions.
3.2 Increased Liquidity
Global trading increases market participation, enhancing liquidity, reducing transaction costs, and improving the execution of trades. Traders can enter and exit positions more efficiently in liquid markets.
3.3 Access to Diverse Instruments
Global markets offer access to a wide variety of trading instruments:
Futures, options, CFDs, ETFs, and forex.
Commodities like oil, gold, and agricultural products.
Digital assets and cryptocurrencies.
3.4 Risk Management Strategies
Global trading provides tools to hedge risks:
Cross-Market Hedging: Hedging stock exposure with global index derivatives.
Currency Hedging: Protecting against adverse currency movements.
Sectoral Hedging: Using international commodities or equities to offset domestic sectoral risks.
3.5 Exploiting News and Macroeconomic Events
Traders leverage macroeconomic releases, central bank policies, and geopolitical developments worldwide to generate profits. Fast, algorithmic trading systems and HFT (High-Frequency Trading) strategies often capitalize on global news in milliseconds.
4. Importance for Policymakers
Policymakers, including government authorities, central banks, and regulatory bodies, rely on global trading for strategic economic planning and stability. Its importance is multidimensional:
4.1 Economic Growth and Development
Global trade allows countries to specialize in sectors where they have a comparative advantage, enhancing productivity, job creation, and GDP growth.
Trade Surpluses and Investment: Exports generate foreign exchange, which supports domestic investment and infrastructure development.
4.2 Policy Formulation and Regulation
Policymakers use insights from global markets to craft informed regulations:
Exchange rate policies, interest rate adjustments, and capital controls.
Financial market regulations to prevent systemic risk.
Taxation and investment incentives for foreign capital.
4.3 Financial Stability and Crisis Management
Global trading links domestic economies to international financial systems. Policymakers must monitor cross-border capital flows, manage currency volatility, and mitigate risks from global shocks.
Example: The 2008 financial crisis demonstrated how interconnected markets can transmit shocks worldwide. Policymakers need coordination with international bodies (IMF, World Bank) to stabilize economies.
4.4 Promoting Investment and Capital Inflows
Open financial markets attract foreign direct investment (FDI) and portfolio inflows, stimulating growth and innovation. Policymakers can leverage global trading to:
Encourage technology transfer.
Enhance employment opportunities.
Strengthen financial infrastructure.
4.5 Global Competitiveness
Policymakers can benchmark domestic performance against international markets, ensuring competitiveness in sectors like technology, finance, and manufacturing.
5. Interconnected Impact on All Stakeholders
The importance of global trading lies not only in isolated benefits but also in its systemic impact:
5.1 Feedback Loops
Investors’ foreign portfolio allocations affect currency stability.
Traders’ activity influences volatility and liquidity.
Policymakers’ decisions impact market sentiment globally.
5.2 Information Flow and Transparency
Global trading promotes transparency, standardization, and reporting practices. Access to international data helps all stakeholders make informed decisions.
5.3 Technological Advancement
Advances in fintech, electronic trading, blockchain, and AI analytics are driven by global demand. Investors and traders gain new tools, while policymakers regulate emerging technologies to prevent systemic risk.
6. Challenges and Considerations
Despite the opportunities, global trading poses challenges that stakeholders must address:
6.1 Market Volatility
Global markets are susceptible to rapid swings due to geopolitical events, economic crises, or policy changes.
6.2 Currency and Interest Rate Risks
Exchange rate fluctuations and cross-border monetary policies can affect returns for investors and traders.
6.3 Regulatory Disparities
Different regulatory frameworks can complicate trading, requiring compliance expertise and coordination.
6.4 Political and Geopolitical Risks
Trade wars, sanctions, and diplomatic tensions can disrupt global markets.
6.5 Technological and Cyber Risks
The interconnectedness of markets increases vulnerability to cyberattacks, algorithmic errors, and system failures.
7. Strategies for Leveraging Global Trading
For Investors:
Diversify portfolios globally across regions and asset classes.
Hedge currency and political risks.
Monitor macroeconomic indicators across major economies.
For Traders:
Exploit time zone and cross-market price differentials.
Use algorithmic and high-frequency trading to capitalize on global events.
Manage risk through derivatives and hedging.
For Policymakers:
Foster policies encouraging foreign investment.
Maintain financial stability through prudent regulations.
Engage in international cooperation to manage crises.
8. Conclusion
Global trading is an indispensable component of modern financial systems. For investors, it provides diversification, growth opportunities, and access to innovation. For traders, it offers liquidity, arbitrage opportunities, and risk management tools. For policymakers, it is a strategic lever for economic growth, stability, and competitiveness.
The interconnected nature of global markets requires all stakeholders to adopt informed, proactive, and adaptive strategies. While the benefits are substantial, the associated risks—from volatility and currency exposure to regulatory and geopolitical challenges—cannot be ignored. Mastering global trading dynamics is essential for maximizing opportunities while safeguarding against systemic threats, making it a critical element of contemporary financial and economic strategy.

Nifty Ocktober TDX Levels -Nifty commenced October with a bullish Marubozu candlestick.
Similarly, September also opened with a bullish Marubozu, which was followed by a fourteen-day rally of 1,000 points. We will observe whether a similar trend persists this October.
The market demonstrated strong resilience in September, remaining above the bullish zone despite significant geopolitical challenges. India’s current economic data continues to provide solid fundamental support.
If this higher low formation is maintained, it could pave the way for a higher high target. Market participants should consider positioning accordingly, as clarity is expected by next Monday.
Please monitor these key levels to remain aligned with market movements, especially in such volatile conditions where analysis and forecasts can change rapidly.

Nifty 50 Index Pattern Trade AnalysisNSE:NIFTY
A classic "Cup and Handle" pattern is emerging on the Nifty 50 5-minute chart, signaling a potential bullish continuation move.
Pattern Structure & Logic
Cup Formation: A rounded bottom formed after a sustained decline, showing that sellers exhausted and buyers slowly regained control.
Handle Formation: A smaller consolidation (pullback) near resistance, creating a fresh support zone before a breakout attempt.
Breakout Entry (24,790):
Entry is suggested above the pattern breakout level as this confirms buyers have regained control after absorbing selling pressure at resistance.
Volume generally increases at breakout, validating the move’s strength.
Trade Plan
Stop Loss (24,740.00):
Place initial risk below the handle’s low. This level acts as last support before pattern invalidation, allowing for tight risk management.
Target (24,990.00):
The target is set using the measured move logic (depth of cup added to the breakout line), matching strong supply/resistance area nearby.
This aligns with common pattern targets and intraday resistance bands.
Pattern Logic & Psychology
Bullish Implication:
The cup and handle shows shift from bearish to bullish sentiment, with consolidation (handle) confirming sellers are exhausted.
Breakout is confirmed when price closes above handle resistance on strong volume; traders seek upside momentum toward calculated pattern target.
Risk Management:
A stop below the handle low limits exposure on failed breakouts.
Trailing stops may be employed as price approaches the pattern target.

Nifty Analysis EOD – October 1, 2025 – Wednesday 🟢 Nifty Analysis EOD – October 1, 2025 – Wednesday 🔴
Bulls kick off October with a breakout surge
🗞 Nifty Summary
Nifty opened flat, dipped slightly, and then rallied 85 points from the low. The index repeatedly tried to break the 24,675–24,685 resistance zone, but early attempts failed. With support holding at PDC, an ascending triangle pattern formed, and its breakout finally ignited a 130-point rally to 24,800, meeting the pattern target.
After a retracement to 24,750 support, a trendline breakout around 2 PM added another 80 points, marking the day’s high at 24,867.95. Nifty closed strong at 24,853.40, near the high of the day.
The first trading day of October turned out to be a sentiment shift, with bulls firmly in control. The day’s 262-point range nearly engulfed the last three sessions combined, with a close at the highest high in 3 days.
🛡 5 Min Intraday Chart with Levels
🛡 Intraday Walk
Flat open → dip to 24,606.
85-pt rally attempts 24,675–24,685 resistance, multiple failures.
Support at PDC → ascending triangle breakout, rally to 24,800.
Pullback → support at 24,750.
2:00 PM → trendline breakout, sharp +80-pt rally.
Day high: 24,867.95, close: 24,853.40 (near high).
📉 Daily Time Frame Chart with Intraday Levels
🕯 Daily Candle Breakdown
Open: 24,620.55
High: 24,867.95
Low: 24,605.95
Close: 24,836.30
Change: +225.20 (+0.92%)
🏗️ Structure Breakdown
Large green body (~215.75 pts).
Wide range: 262 pts.
Tiny wicks → minimal rejection.
📚 Interpretation
Buyers stepped in strongly from 24,600 zone.
Trend sustained all day, with close near high.
Momentum shifted firmly to the bulls.
🕯Candle Type
Bullish Marubozu-like candle → strong, decisive buyer dominance.
🛡 5 Min Intraday Chart
⚔️ Gladiator Strategy Update
ATR: 173.37
IB Range: 95.80 → Medium
Market Structure: Balanced
Trade Highlights
11:05 Long Trade – Target Achieved (R:R 1:3.63)
14:00 Long Trade – Trailing SL Hit (R:R 1:3.12)
📌 What’s Next? / Bias Direction
Bias has turned bullish above 24,750. A close above 24,870 could open the gates toward 24,980–25,000, while 24,600 remains the key downside base.
📌 Support & Resistance Levels
Resistance Zones:
24868
24890 ~ 24915
24990 ~ 25000
25048.75
Support Zones:
24775 ~ 24750
24735
24685 ~ 24675
💡 Final Thoughts
“Momentum loves confirmation — when resistance breaks and holds, the market often rewards patience with decisive follow-through.”
✏️ Disclaimer
This is just my personal viewpoint. Always consult your financial advisor before taking any action.

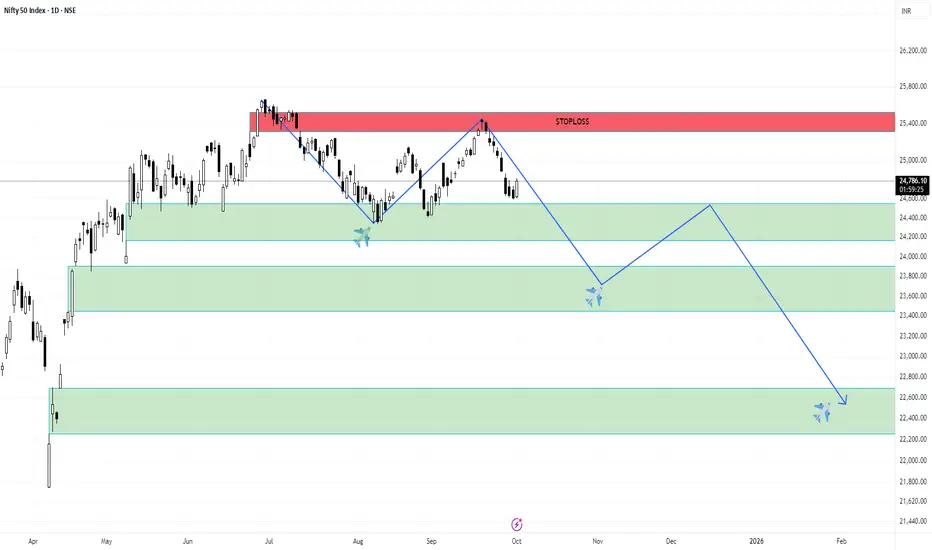
Nifty 50: Genuine Rally or Selloff Setup?The Nifty 50 Index went up, but this upward move was likely just a temporary correction, not the start of a new, long-term rise.
Bottom (Wave W): The index first hit a low around 24,377
Bounce (Wave X): It then went up to a high near 25,448. This rise was a clear, three-part corrective move (like an ABC pattern) that stayed inside a rising channel .
Clue: Because the move from the bottom (W) to the peak (X) was corrective, it suggests the overall trend is still bearish (downward).
Points to look at:
1. Reversal: The index is currently around 24,836 and is starting to turn down from the top of that rising channel. This suggests the temporary rise is over.
2. Projected Drop (Wave Y): The main prediction is a significant drop (Wave Y) that will likely break the previous low of 24,377 .
3. Target: This decline is expected to head toward the lower blue trendline on the chart, completing a larger WXY corrective pattern.
4. Projection: Ending point of wave (Y) can act as the ride for the new impulse cycle.
5. Bearish Stance: Traders should be cautiously bearish (expecting the price to fall).
6. Price action perspective: Previous swing is bearish, better to look at short positions for safe entry.
7. Selling Opportunities: Any small upward movements (retracements) are seen as good selling opportunities (betting on the price going down), as long as the price doesn't break above the recent highs or the channel ceiling.24,300 is indeed a strong demand zone.
Stay tuned!
Money Dictators :)

Nifty levels - Oct 03, 2025Nifty support and resistance levels are valuable tools for making informed trading decisions, specifically when combined with the analysis of 5-minute timeframe candlesticks and VWAP. By closely monitoring these levels and observing the price movements within this timeframe, traders can enhance the accuracy of their entry and exit points. It is important to bear in mind that support and resistance levels are not fixed, and they can change over time as market conditions evolve.
The dashed lines on the chart indicate the reaction levels, serving as additional points of significance to consider. Furthermore, take note of the response at the levels of the High, Low, and Close values from the day prior.
We hope you find this information beneficial in your trading endeavors.
* If you found the idea appealing, kindly tap the Boost icon located below the chart. We encourage you to share your thoughts and comments regarding it.
Wishing you success in your trading activities!

Nifty Clear target for 25000 go long folk slong opportunity in nifty 50 .. keep your sl and NSE:NIFTY go long

NIFTY DAILY CANDLE VIEWAfter long time analysing nifty daily candle. Market gives many opportunity to enter in this market but not only for profit or loss. They can check your discipline and many more.
We can plan our trade with risk and reward only. wait for your level and calculate your risk than enter in trade.
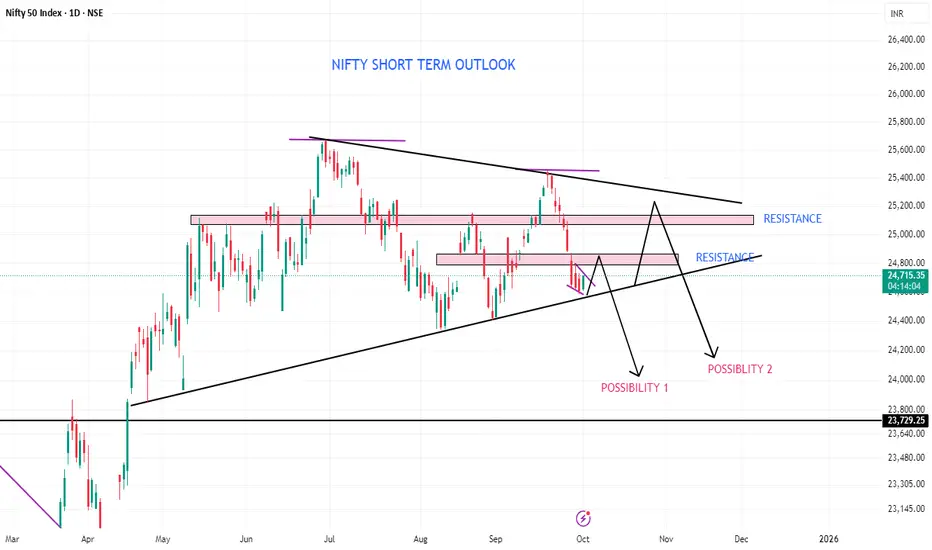
NIFTY SHORT TERM OUTLOOK Nifty at present facing resistance around 25200-25350...last year nifty fallen in September by making H&S pattern. Both shoulders creating strong resistance at 25200-25350 zone... In short term now nifty making symmetrical triangle in addition to H&S .. Nifty has strong resistance around 24850.. So possibility 1 is that this bounce in nifty may not sustain much. Even if nifty crosses 24850 on closing basis, Nifty will again face resistance around 25000 zone
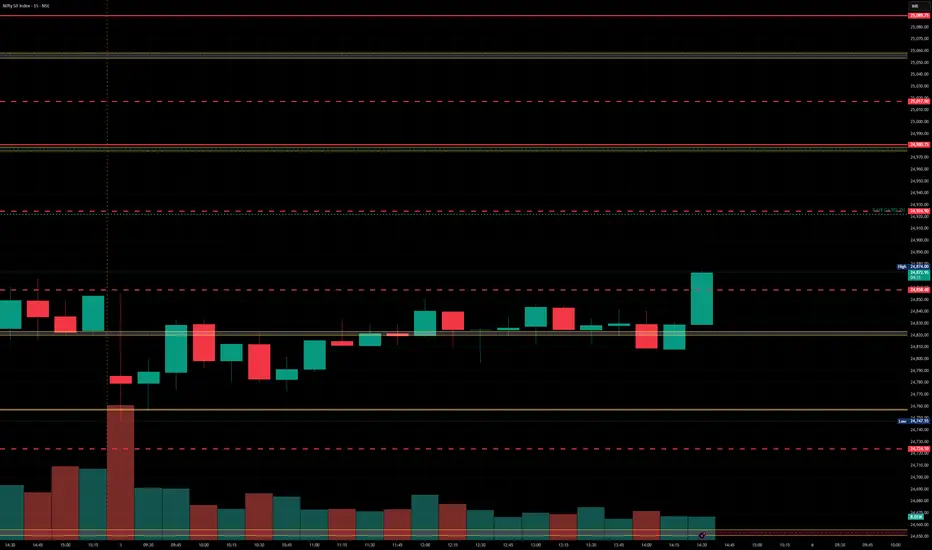
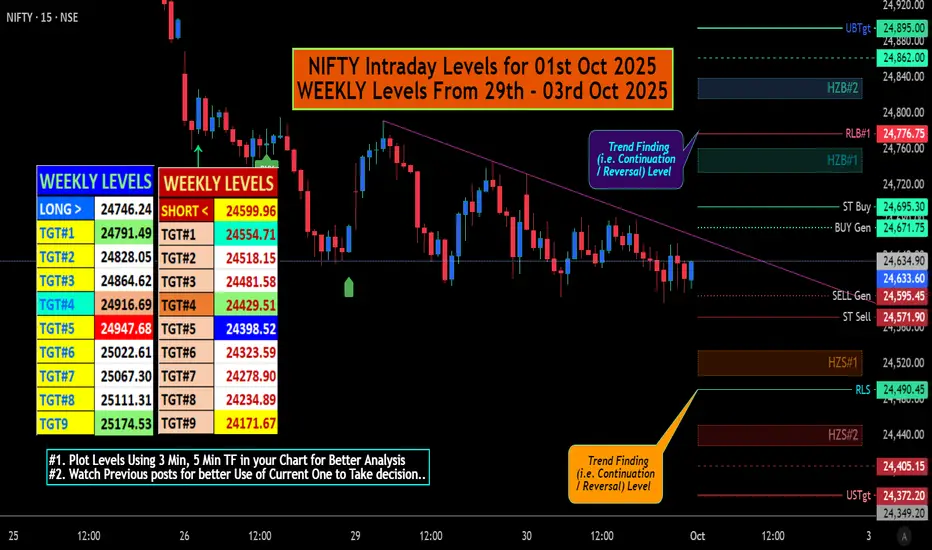
NIFTY Intraday Levels for 01st Oct 2025 “শুভ সারদীয়া”
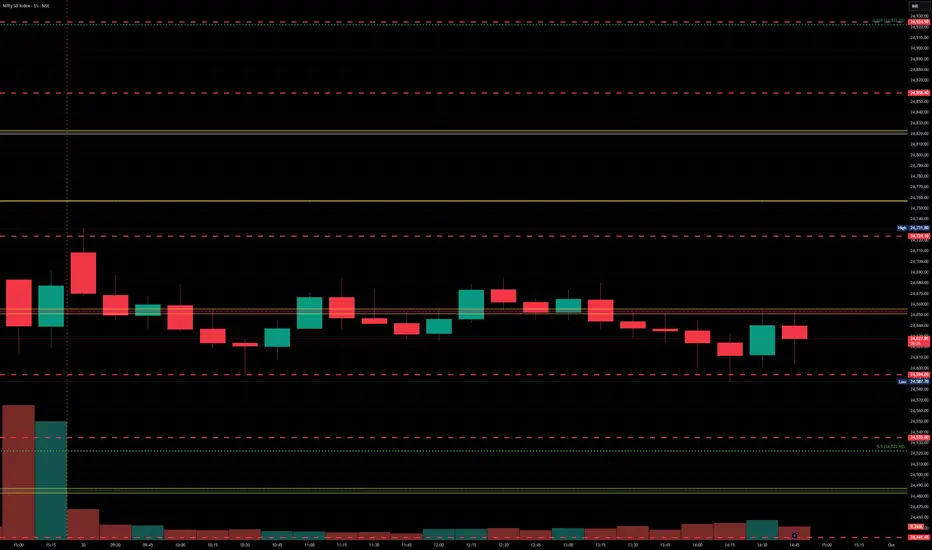
Technical Overview and Trade Setup for Nifty 50 Index (15-Minute Chart)
Technical Overview
• Price Action:
o The Nifty 50 Index started around 25,400 on September 22 and declined steadily to approximately 24,633.60 by the end of September 30.
o The downtrend features a series of lower highs and lower lows, with intermittent pullbacks (e.g., around September 25 and 29) followed by resumed declines.
o Candlestick patterns include several red (bearish) candles, with occasional blue (bullish) candles indicating short-term reversals or consolidation.
• Key Levels:
o Support: Plotted on Chart, though 24n500 -24, 532 can play Crucial Role.
o Resistance: Plotted on Chart. Though The pullback high around 25,090–25,200 (September 25) serves as a key resistance zone.
• Volume:
o Volume is relatively moderate, with a spike of 44.24M shares on September 30, suggesting increased selling pressure or interest near the close.
• Trend:
o The overall trend is bearish, with a steep decline of approximately 800+ points (~3.5 %) over the 8-day period.
o The 15-minute timeframe shows intraday volatility, but the broader direction remains downward.
Trade Setup
Based on the technical overview, here’s a potential trade setup for the Nifty 50 Index, focusing on the current bearish trend and considering the time (11:46 PM IST, post-market hours in India). This setup assumes continuation into the next trading session (October 1, 2025) and aligns with your interest in volatility (HV-IV context).
1. Short Trade (Bearish Continuation)
• Rationale:
o The downtrend is intact, with no significant reversal signals (e.g., bullish engulfing or strong support hold).
o Increased volume on September 30 suggests selling momentum, supporting a bearish outlook.
o HV may rise with this sharp move, while IV could spike if market uncertainty persists (e.g., post-close news or global cues).
# "WEEKLY Levels" mentioned in BOX format.
^^^^^^^ Plot Levels Using 3 Min, 5 Min Time frame in your Chart for Better Analysis ^^^^^^^
L#1: If the candle crossed & stays above the “Buy Gen”, it is treated / considered as Bullish bias.
L#2: Possibility / Probability of REVERSAL near RLB#1 & UBTgt
L#3: If the candle stays above “Sell Gen” but below “Buy Gen”, it is treated / considered as Sidewise. Aggressive Traders can take Long position near “Sell Gen” either retesting or crossed from Below & vice-versa i.e. can take Short position near “Buy Gen” either retesting or crossed downward from Above.
L#4: If the candle crossed & stays below the “Sell Gen”, it is treated / considered a Bearish bias.
L#5: Possibility / Probability of REVERSAL near RLS#1 & USTgt
HZB (Buy side) & HZS (Sell side) => Hurdle Zone,
*** Specialty of “HZB#1, HZB#2 HZS#1 & HZS#2” is Sidewise (behaviour in Nature)
Rest Plotted and Mentioned on Chart
Color code Used:
Green =. Positive bias.
Red =. Negative bias.
RED in Between Green means Trend Finder / Momentum Change
/ CYCLE Change and Vice Versa.
Notice One thing: HOW LEVELS are Working.
Use any Momentum Indicator / Oscillator or as you "USED to" to Take entry.
⚠️ DISCLAIMER:
The information, views, and ideas shared here are purely for educational and informational purposes only. They are not intended as investment advice or a recommendation to buy, sell, or hold any financial instruments. I am not a SEBI-registered financial adviser.
Trading and investing in the stock market involves risk, and you should do your own research and analysis. You are solely responsible for any decisions made based on this research.
"As HARD EARNED MONEY IS YOUR's, So DECISION SHOULD HAVE TO BE YOUR's".
Do comment if Helpful .
Nifty 50Nifty 50 Chart Analysis
As you can see on the chart, a falling wedge pattern is formed on the chart and at the same time an inverse head & shoulder pattern is also being formed, if the neckline of 24685 level is broken then the level of Nifty can be seen coming up to 24800.

Nifty Analysis EOD – September 30, 2025 – Tuesday🟢 Nifty Analysis EOD – September 30, 2025 – Tuesday 🔴
Expiry drama continues, but no reversal in sight
🗞 Nifty Summary
Nifty opened with a 31-point gap up, quickly filled the gap, and then added 50 points from the low to test 24,731.80 — the same level that acted as strong resistance yesterday. Once again, the index failed to cross this barrier, triggering a sell-off to 24,593, breaking below the PDL.
However, this breakdown turned out to be false, sparking a 90-point recovery back to the PDC at 24,677.50. Multiple attempts to reclaim the PDC failed. Post 2 PM, volatility spiked — with wild candles and sharp shadows around key levels like PDL, trapping both sides of traders.
Eventually, Nifty settled at 24,633.60, marking the 9th consecutive red close. While the fall seems to be slowing, there is still no sign of reversal yet.
🛡 5 Min Intraday Chart with Levels
🛡 Intraday Walk
Gap up +31 pts → gap filled early.
Bounce of +50 pts to test 24,731.80, yesterday’s resistance.
Sharp sell-off to 24,593 (below PDL).
False PDL breakdown → 90-pt recovery to PDC (24,677.5).
Multiple failures to reclaim PDC.
After 2 PM → wild, volatile candles with traps around PDL.
Closed at 24,633.60.
📉 Daily Time Frame Chart with Intraday Levels
🕯 Daily Candle Breakdown
Open: 24,668.55
High: 24,731.80
Low: 24,593.05
Close: 24,633.60
Change: −1.30 (−0.01%)
🏗️ Structure Breakdown
Tiny red body → indecisive close.
Range: ~139 pts → lower than yesterday.
Long shadows on both ends → strong tussle between bulls and bears.
📚 Interpretation
Rejection repeated at 24,731.
False breakdown below PDL shows buyers defending.
Closing near mid-range with tiny body → indicates pause in momentum.
🕯Candle Type
Small-bodied candle with long shadows → Indecision candle / Doji-like structure.
Signals exhaustion but no confirmation of reversal.
🛡 5 Min Intraday Chart
⚔️ Gladiator Strategy Update
ATR: 173.37
IB Range: 95.80 → Medium
Market Structure: Balanced
Trade Highlights:
10:50 Long Trade – Target Achieved (R:R 1:2.1)
12:15 Long Trade – Trailing SL Hit (R:R 1:0.26)
13:20 Short Trade – Target Achieved (R:R 1:1.96)
📌 What’s Next? / Bias Direction
Bias remains bearish below 24,731. A decisive close above this level could trigger a short-term reversal. Until then, sideways-to-downtrend movement dominates with volatility around support zones.
📌 Support & Resistance Levels
Resistance Zones:
24685 ~ 24675
24735
24750 ~ 24775
24868
24890 ~ 24915
Support Zones:
24600 ~ 24572
24500
24430 ~ 24400
💡 Final Thoughts
“In trading, sideways days are often the market’s way of loading energy. The trap candles test patience — the real move begins once levels finally break.”
✏️ Disclaimer
This is just my personal viewpoint. Always consult your financial advisor before taking any action.

Strong Base Formed ! Nifty Positioned for Explosive Move This is the daily timeframe chart of Nifty 50.
Nifty 50 is sustaining above the LOP support zone around 24,400–24,500. The index has formed an ascending broadening wedge pattern at this support and appears to be completing the last leg of the structure.
Support Zone: 24,500–24,550
Resistance Zone: 25,600–25,800
If the support zone holds, we may see higher prices in Nifty 50 in the coming sessions.
Thank you.

Nifty levels - Oct 01, 2025Nifty support and resistance levels are valuable tools for making informed trading decisions, specifically when combined with the analysis of 5-minute timeframe candlesticks and VWAP. By closely monitoring these levels and observing the price movements within this timeframe, traders can enhance the accuracy of their entry and exit points. It is important to bear in mind that support and resistance levels are not fixed, and they can change over time as market conditions evolve.
The dashed lines on the chart indicate the reaction levels, serving as additional points of significance to consider. Furthermore, take note of the response at the levels of the High, Low, and Close values from the day prior.
We hope you find this information beneficial in your trading endeavors.
* If you found the idea appealing, kindly tap the Boost icon located below the chart. We encourage you to share your thoughts and comments regarding it.
Wishing you success in your trading activities!
Analysis on NIFTY50(short term bearish)1. Index fell sharply from 25400 to 24600
2. it is sitting now at 24600 support zone testing before in early September.
3. Indecision near support.
4. Selling pressure earlier was strong.
NIFTY50 is still in short-term downtrend, holding support at 24600.
Disclaimer:
I am NOT a SEBI registered advisor nor a financial advisor.
Any investments or trades I discuss on my blog are intended solely for educational purposes and do not represent specific financial, trading, or investment advice.
Disclosure:
I, the author of this report, and my immediate family members do not have any financial interest or beneficial ownership in the securities mentioned herein at the time of publication.

nifty50 Analysis | be careful from trapMarket Outlook
Support Zone: 24,550 – 24,400
Resistance Levels: 24,750 – 24,790 and 24,960 – 24,990
A falling wedge pattern is currently forming just above the support zone. The key level to watch is 24,590, as a sweep of this low appears likely. However, before a potential breakdown, price may first retest the immediate resistance area and face rejection, leading back toward the support zone.
