NQ Weekly Analysis!FA Analysis:
1- We know that the FED opened the door for a rate cut in September (Next week). The FED gave priority to address Employment Mandate issue and considered the higher inflation data as one time shot.
2- Hence, the Inflation (the second FED mandate) the most relevant data this week with both PPI and CPI to validate the FED view of one time shot. Another higher inflation will destroy this narrative and the FED might revise the way forward.
The story is simple: Higher Inflation data will send NQ down and vice-versa for inline and softer inflation.
TA Analysis:
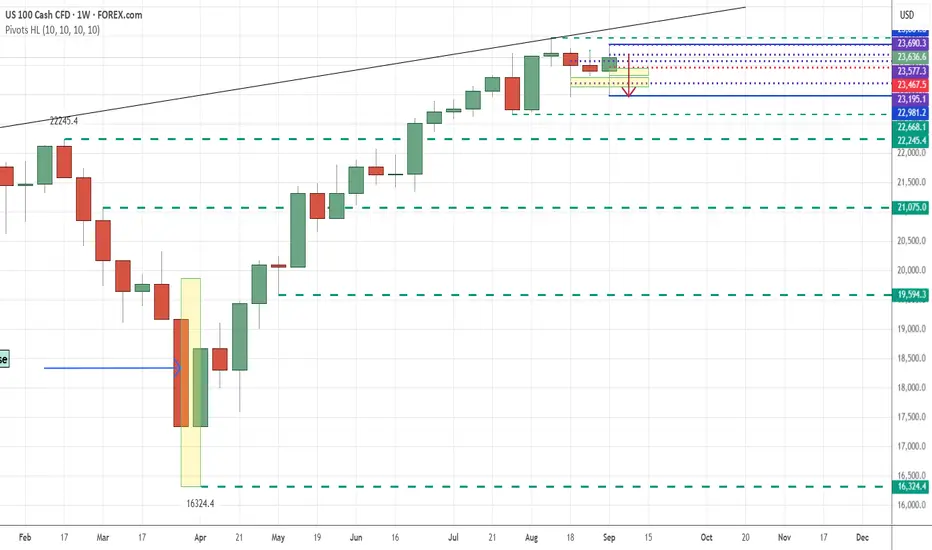
Weekly TF:
The weekly close expresses really the incertitude regarding the direction. No clear direction; both direction are open; all will depend on inflation data.
Daily TF:
The daily close was bearish. NFP data provided an inline inflation data but a very negative employment data. As mentioned, bad data data is bad for NQ and vice-versa.
From daily perspective, price might retest Friday high or just NFP low (magenta dotted line) and continue down towards TP1, TP2 and TP3 particularly if Inflation data comes strong.
H4 TF:
H4 provided a break down. Inline with daily analysis, the least resistance is that price continues down after a short retrace up.
GL Everyone!
USTECH100CFD trade ideas
BUY STOP (NAS100)NAS is bullish
Inverse H&S
Buy stop on neckline and hold the buy until next psychological number = 24000.00


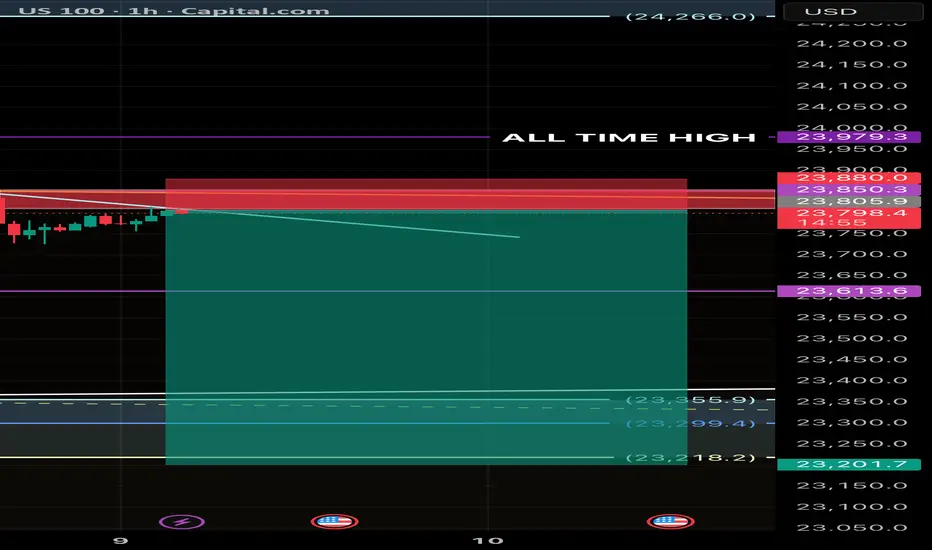
US100 – Short Setup Near All-Time High US100 – Short Setup Near All-Time High
Price is currently testing a critical resistance zone near the all-time high at 23,979. After rejecting from this level, I’ve identified a potential short opportunity with a favorable risk-to-reward ratio.
Price testing ALL-TIME HIGH (23,979) and rejecting from resistance zone.
🔴 Entry: 23,798 – 23,805
🛑 SL: 23,880
🎯 TP1: 23,613 | TP2: 23,355 | TP3: 23,201
⚡ Strong supply zone + rejection → high R:R setup (~1:5).
❌ Invalidation above 23,880.
#US100 #NASDAQ100 #indices #PriceAction #TradingSetup #SupplyDemand #ShortTrade
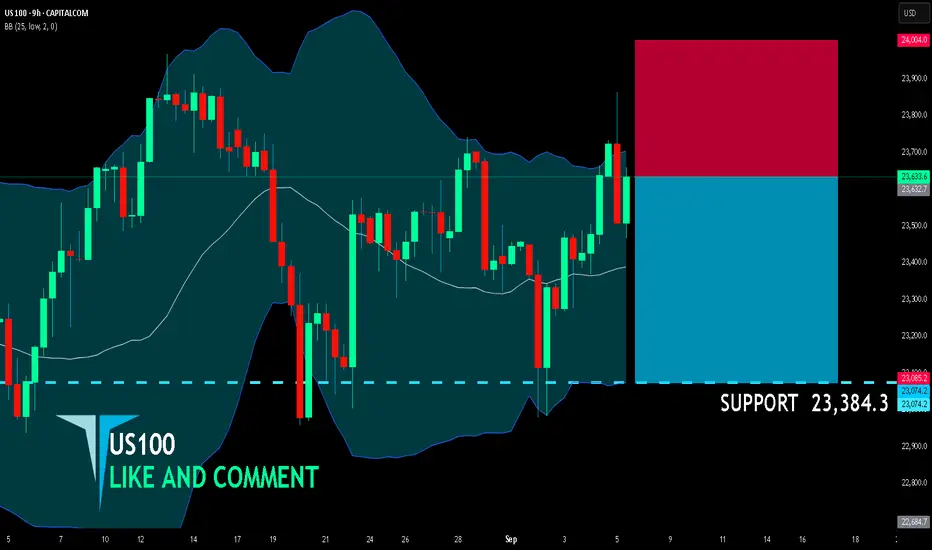
US100 SHORT FROM RESISTANCE
US100 SIGNAL
Trade Direction: short
Entry Level: 23,632.7
Target Level: 23,384.3
Stop Loss: 24,004.0
RISK PROFILE
Risk level: medium
Suggested risk: 1%
Timeframe: 9h
Disclosure: I am part of Trade Nation's Influencer program and receive a monthly fee for using their TradingView charts in my analysis.
✅LIKE AND COMMENT MY IDEAS✅
NAS100USD (SHORT)
Fib Level to continue Down trent
Break and retest on bullish flag
Nasdaq is a Downtrend

NASDAQ - Bullish Flow into Highs
Bias: Bullish
HTF (4H Overview):
From the bird’s-eye view, structure remains bullish. Liquidity is being targeted across the 30M–4H multi-timeframe play, with strong bullish intent confirmed by volume printing to the upside.
LTF (30M / 5M Confirmation):
A proper CHoCH has been established. Once the trend shift occurs, we wait for the pullback before attending longs.
Entry Plan:
Look for entry after the courtyard liquidity is collected and demand is mitigated (slash zone).
Targets:
Initial: 5M highs
Extended: 30M highs, depending on market delivery.
Mindset Note:
Patience—let liquidity do its job before striking.

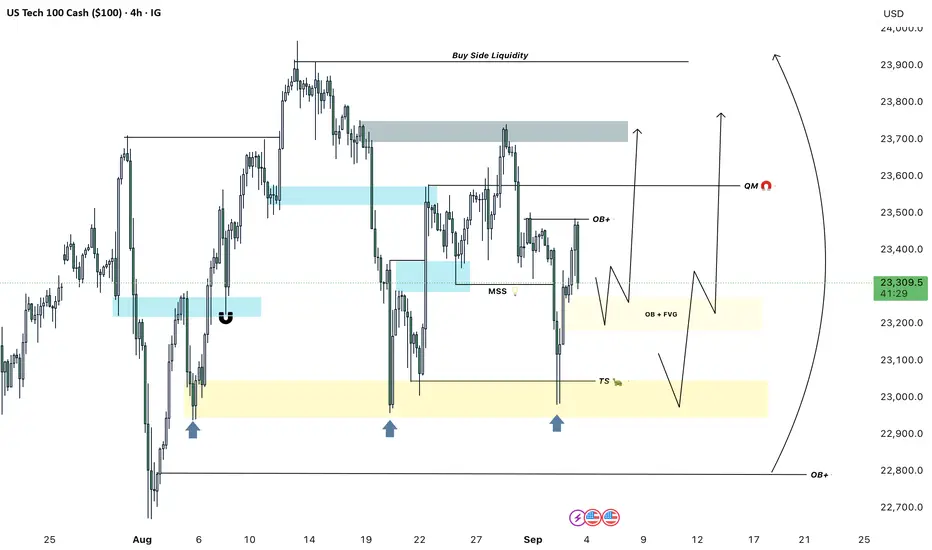
NASDAQ H4 : RETESTING TIME ?? Hello Everyone ,
The Nasdaq Currently Got Rejection From OB (23,480)
We Are Expecting Retest Buy From Below Zones ⬇️
OB + FVG (23,275 / 23180)
SUPPORT (23,00 / 22,995)
ORDER BLOCK ( 22,785)
Hope You Understand , Follow Us For More
Good Luck 🤞
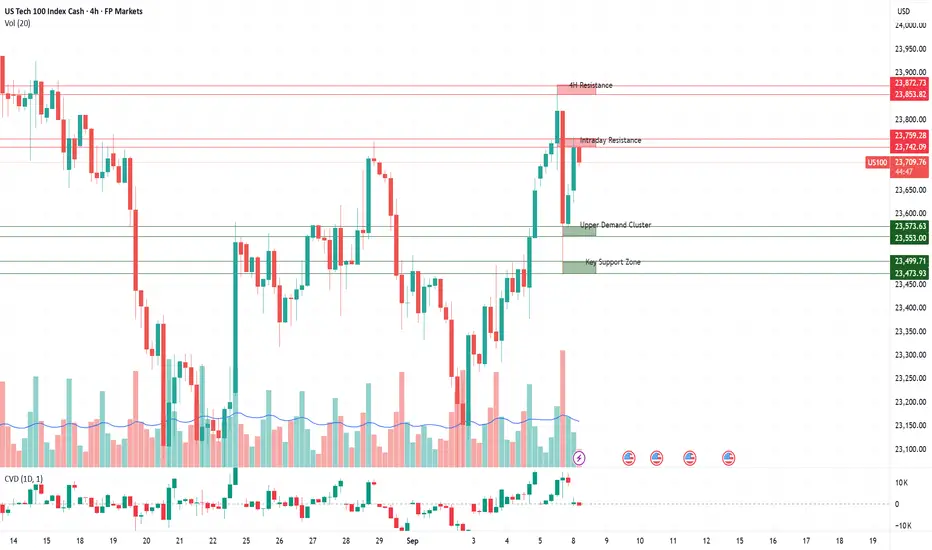
Nas100: Trading Levels in FocusSupply Zones (Red)
23,853 - 23,873
A strong supply zone near recent highs. Sellers are expected to defend aggressively here, making it a potential rejection area. A confirmed breakout and retest, however, could open the path toward new highs.
23,742 – 23,759
This zone reflects last week’s high-volume rejection. Acts as an intraday decision area: sharp rejections can trigger short setups, while a clean break and hold above would strengthen bullish momentum.
Demand Zones (Green)
23,553 – 23,573
A fresh demand zone aligned with recent breakout structure. Buyers may attempt to defend here for continuation longs. If broken, the zone flips into resistance, adding downside pressure.
23,473 – 23,500
Well-tested support area with prior absorption. Strong bounce potential, but multiple retests increase the risk of a breakdown. A failure here would likely accelerate bearish momentum.
Overall Sentiment: Cautiously Bullish on Fragile Ground
At its core, the market is cautiously optimistic right now. Positive momentum from Big Tech and expectations of looser monetary policy are fueling short-term upside potential. At the same time, consolidation and uncertainty around macro data keep sentiment restrained. Momentum is present but it relies on breakout moves holding.
NASDAQ at Record Highs after US CPI report, but can it last?In today’s video, we break down the major market moves triggered by the July US CPI report. Headline CPI rose 0.2% month-over-month—right in line with expectations and a slowdown from the previous month. Year-over-year, headline inflation came in at 2.7%, just under the 2.8% forecast, while Core CPI rose 0.3% MoM (matching forecasts) but was a bit hotter at 3.1% YoY (vs. 3.0% expected).
These “not as bad as feared” inflation numbers kept hopes alive for a September Fed rate cut, pushing the odds of a cut to 96%. Markets responded strongly: the NASDAQ 100 closed at a record high, just shy of the 24K handle, with broad gains in tech and communication stocks, as traders bet on a more dovish Fed.
We also cover the technical setup for the NASDAQ 100 and key risk factors heading into the second part of August.
This content is not directed to residents of the EU or UK. Any opinions, news, research, analyses, prices or other information contained on this website is provided as general market commentary and does not constitute investment advice. ThinkMarkets will not accept liability for any loss or damage including, without limitation, to any loss of profit which may arise directly or indirectly from use of or reliance on such information.

Shall Nasdaq still keep bullish?After an long accumulation without a clear bullish, the Triangle pattern was shaped waiting an good break out in NY session with important News!
The most important level need to break out!

NAS100 UPDATE - VERY IMPORTANT READ!Dear Friends in Trading,
INVESTING LIVE - IMPORTANT:
Equities start to get hit by bond market rumblings
The blow up in long-end yields is biting at broader market sentiment now
Stocks down
S&P 500 futures are now down 0.5% as markets are seeking shelter amid the blow up in bond yields. European indices are also sinking lower across the board with the DAX now down nearly 1% with the CAC 40 also turning early gains to losses now. It's all coming undone as we see long-end yields surge higher all across major economies.
France's 30-year yields are now above 4.50% for the first time since 2011 and that follows suit from the situation in the UK here. And as warned there, it was only a matter of time before the spillover impact hits at stocks today. And it's not just in Europe, we're seeing the same in Japan and also the US as well. From last week: The US yield curve continues to steepen post-Jackson Hole
These are testing times and if there's ever a good reason for a correction in stocks, this would be it.
Elsewhere, gold is also being dragged back down on the day as traders are seeking safety in the US dollar at the moment. The precious metal has pared earlier gains to $3,478 now. But if it is a case of truly focusing on the blow up in yields with a steepening of the yield curve, I reckon the play will be to buy gold on dips for the long haul.
I sincerely hope my point of view offers a valued insight.
Thank you for taking the time study my analysis.

Bullish bounce off 61.8% Fibonacci support?US100 is falling towards the support level which is a pullback support that aligns with the 61.8% Fibonacci retracement and could bounce from this level to our take profit.
Entry: 23,289.88
Why we like it:
There is a pullback support that aligns with the 61.8% Fibonacci retracement.
Stop loss: 22,983.03
Why we like it:
There is a multi-swing low support.
Take profit: 23,729.56
Why we like it:
There is a pullback resistance.
Enjoying your TradingView experience? Review us!
Please be advised that the information presented on TradingView is provided to Vantage (‘Vantage Global Limited’, ‘we’) by a third-party provider (‘Everest Fortune Group’). Please be reminded that you are solely responsible for the trading decisions on your account. There is a very high degree of risk involved in trading. Any information and/or content is intended entirely for research, educational and informational purposes only and does not constitute investment or consultation advice or investment strategy. The information is not tailored to the investment needs of any specific person and therefore does not involve a consideration of any of the investment objectives, financial situation or needs of any viewer that may receive it. Kindly also note that past performance is not a reliable indicator of future results. Actual results may differ materially from those anticipated in forward-looking or past performance statements. We assume no liability as to the accuracy or completeness of any of the information and/or content provided herein and the Company cannot be held responsible for any omission, mistake nor for any loss or damage including without limitation to any loss of profit which may arise from reliance on any information supplied by Everest Fortune Group.

NASDAQ Index Analysis (US100 / NASDAQ):The NASDAQ index is moving in an uptrend and is currently testing the 23,800 resistance level.
🔻 Bearish Scenario:
If the price manages to break below 23,750 and hold, it is likely to head towards the lower support level at 23,500.
🔺 Bullish Scenario:
If the price breaks above 23,850 and holds, this could support a continuation of the bullish move toward 24,000.
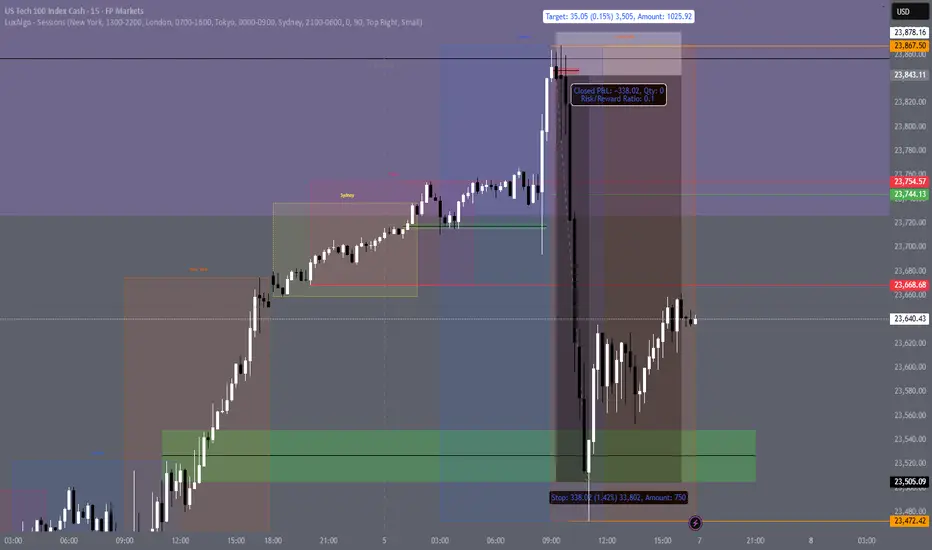
killzone ideal setup to takeSTEP 1: Spot session HH/LL (prefered asia session)
STEP 2: Wait for next session to sweep HH/LL of previous session
STEP 3: Spot FVG,OB or wtv that confirm reversal/continuation
STEP 4: Enter position after confirmation of market reaction
NAS100 At Major Resistance - Breakout or Reversal?NAS100 Technical Analysis: 🚀 At Major Resistance - Breakout or Reversal? 📉
Asset: NAS100 (NASDAQ 100 CFD)
Analysis Date: September 5, 2025
Current Closing Price: 23,639.8 (as of 12:59 AM UTC+4)
Timeframes Analyzed: 1H, 4H, D, W
Executive Summary & Market Outlook 🧐
The NAS100 is at a critical technical juncture, testing a formidable resistance zone between 23,600 and 23,800. 📊 The index is in a clear long-term bullish trend but shows signs of short-term exhaustion after a powerful rally. This is a classic "make-or-break" level. A decisive breakout above 23,800 could ignite a new leg up towards 24,500, while a rejection here may trigger a significant corrective pullback towards 22,800. This analysis provides a roadmap for both intraday traders 🎯 and swing traders 📈.
Multi-Timeframe Technical Analysis 🔍
1. Trend Analysis (Daily & 4-Hour Chart):
Primary Trend: 🟢 Bullish. Price is above all major Daily Moving Averages (200, 100, 50 EMA), which are aligned bullishly.
Short-Term Trend: 🟡 Bullish but Overextended. The rally has been near-vertical, suggesting the market is ripe for a pause or pullback.
2. Key Chart Patterns & Theories:
Resistance Confluence Zone 🧱: The current price is battling a massive resistance cluster. This zone includes:
A prior major swing high (Price Action Resistance).
The 127.2% and 161.8% Fibonacci extension levels from the last significant correction.
A potential Bullish Cypher pattern's Potential Reversal Zone (PRZ).
Elliott Wave Theory 🌊: The rally from the last major low is best counted as a powerful Impulse Wave. We are likely in the final stages of Wave 5 or a complex Wave 3 extension. This implies that while the trend is up, a larger Wave (4) correction is increasingly probable. Typical retracement targets for a Wave 4 are the 38.2% Fib level near 22,800.
Ichimoku Cloud (H4/D1) ☁️: Price is trading high above the Cloud on daily charts, confirming the strong bullish trend. The Lagging Span (Chikou Span) is also well above price, indicating sustained buying pressure. However, such extreme extensions often precede consolidation.
Gann Theory ⏳: The 23,600-23,800 area represents a key mathematical resistance zone. A daily close above this could open the path to the next Gann angle target.
3. Critical Support & Resistance Levels:
Resistance (R1): 23,800 - 24,000 (Key Psychological & Technical Ceiling) 🚨
Resistance (R2): 24,500 (Projected Target)
Current Closing Price: ~23,640
Support (S1): 23,200 - 23,400 (Immediate Support & 21-period EMA) ✅
Support (S2): 22,800 - 23,000 (Major Support - 38.2% Fib & Prior Breakout Zone) 🛡️
Support (S3): 22,200 (200-Day EMA & 50% Fib)
4. Indicator Consensus:
RSI (14-period on 4H/D): Reading is above 70 on both timeframes, signaling severely overbought conditions. 📛 This is a warning against chasing longs at these highs. A bearish divergence is forming on the 4H chart, hinting at weakening momentum.
Bollinger Bands (4H) 📏: Price is consistently riding the upper band, a sign of a strong trend. However, a move back towards the middle band (20-period SMA) is a common next step after such extensions.
Moving Averages: The bullish alignment (EMA8 > EMA21 > EMA50) is intact. The EMA 21 on the 4H chart (~23,400) is critical immediate support.
Volume & VWAP: Volume has been declining on the most recent push higher, a potential bearish divergence 📉 suggesting a lack of conviction at these highs.
Trading Strategy & Forecast 🎯
A. Intraday Trading Strategy (5M - 1H Charts):
Bearish Scenario (Rejection Play) ⬇️: This is the preferred setup given overbought conditions. Look for bearish reversal candlestick patterns (e.g., Bearish Engulfing, Evening Star 🌟) at or near the 23,800 resistance.
Entry: On confirmation of rejection.
Stop Loss: Tight, above 23,850.
Target: 23,400 (TP1), 23,200 (TP2).
Bullish Scenario (Breakout Play) ⬆️: If buyers overpower and we get a strong 1H close above 23,850, a momentum long could be viable.
Entry: On a small pullback to ~23,780 (re-test as support) or on the breakout.
Stop Loss: Below 23,650.
Target: 24,200 (TP1), 24,500 (TP2).
B. Swing Trading Strategy (4H - D Charts):
Strategy: WAIT FOR A PULLBACK. The risk/reward for new long entries at this resistance is poor. 🚫 The optimal strategy is to wait for a healthy correction to key support zones to add long positions.
Ideal Long Zones: 23,200 (shallow pullback) or 22,800 (deeper correction). ✅
Bearish Risk: A daily close below 22,800 would signal a much deeper correction is likely underway, potentially targeting 22,200.
Risk Management & Conclusion ⚠️
Key Risk Events: High-impact US economic data (e.g., NFP, CPI) and Fed policy announcements are paramount. 🔥 Any hawkish surprises could be the catalyst for a sharp tech-led selloff.
Position Sizing: The potential for increased volatility demands conservative risk management. Never risk more than 1-2% of your account on a single trade.
Conclusion: The NAS100 is bullish but exhausted. 🥴 The current resistance zone is a high-risk area for new longs and a high-probability area for a pullback. 🎯 Swing traders should be patient for a better entry. Intraday traders can play the range between 23,200 and 23,800 until a decisive break occurs. The overall trend remains up, but a period of consolidation or correction is the most probable outcome in the near term.
Overall Bias: 🟢 Bullish above 22,800 | 🟡 Neutral/Bearish below 23,200
For individuals seeking to enhance their trading abilities based on the analyses provided, I recommend exploring the mentoring program offered by Shunya Trade. (Website: shunya dot trade)
I would appreciate your feedback on this analysis, as it will serve as a valuable resource for future endeavors.
Sincerely,
Shunya.Trade
Website: shunya dot trade
Disclaimer: This post is intended solely for educational purposes and does not constitute investment advice, financial advice, or trading recommendations. The views expressed herein are derived from technical analysis and are shared for informational purposes only. The stock market inherently carries risks, including the potential for capital loss. Therefore, readers are strongly advised to exercise prudent judgment before making any investment decisions. We assume no liability for any actions taken based on this content. For personalized guidance, it is recommended to consult a certified financial advisor.

Nas100 Trade Set Up Sep 9 2025FX:NAS100
www.tradingview.com
Price is still playing within a 1h HH/HL range so still overall bullish. PDH was swept so i am expecting SSL liquidity to be swept before looking for a 1m IFVG for a continuation higher

Potential Buy Zone for NAS100Trade what you see and not what you feel. This is what I see. There is a demand zone on 15 min which has not been balanced. There is also another demand zone below that one on 1hr time frame that has also not been balanced. Will wait for the market to retrace to the demand zone and if I get proper indications of going long on smaller TF I will take the long. I have a feeling though that the market might go to the lower demand zone because there is a potential formation of a H&S pattern forming. So, stop losses will be tight if I enter on the 15 min demand zone.

Naz 100 in a tricky spotIts trying to break that downtrend as it got oversold on the way down.lets see if it can break the trend

NAS100Currently in bullish movement. Waiting for retracement or pullback to the marking zone and looking for a buy opportunity. Please wait for the close candle to make a decision or execute for trade.
H4-H1-M15

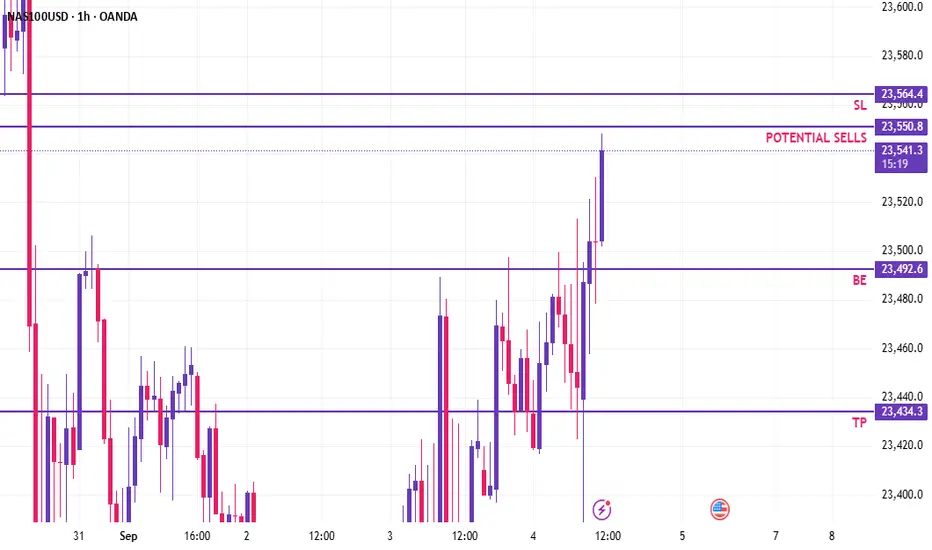
NAS100 | Price is approaching a key level for potential sellsAs price approaches this key level price could potentially sell off if we see good rejection. Let price play out and see if sellers step in at this level. If we are below look for sells above buys.
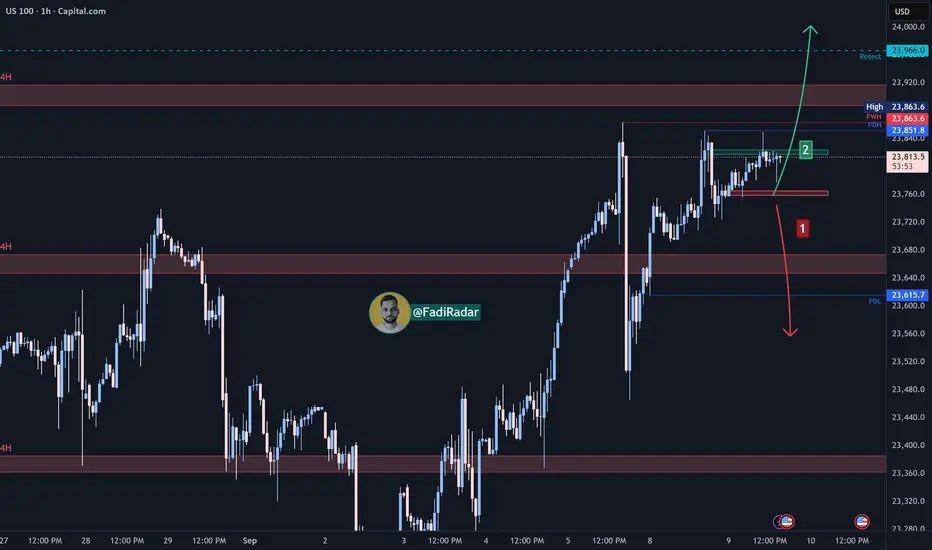
USD100 BULLISH CONTINUATION IDEA 📈 Bullish Continuation Idea
🔹 Technical Analysis
Trend Bias: All higher timeframes confirm a bullish continuation trend.
Key Structure: On the H4 timeframe, price formed a higher low (HL) at the 38.2% Fibonacci retracement, supporting the bullish bias.
Profit Target: First TP at the -27% Fibonacci extension (24,000 – 24,070 zone).
Liquidity Targets: Markets typically hunt liquidity (daily highs/lows, swing points, equal highs/lows). The prior swing high on the daily provides additional confluence for this target.
Lower Timeframe Structure: H1 shows bullish HH/HL structure. Price fully mitigated the recent H1 Fair Value Gap (FVG) and swept the recent data low, possibly offering a strong entry zone for continuation upwards.
🔹 Fundamental Analysis
While N100 often moves independently of news, key events can act as catalysts:
Wednesday 09/10/2025 – Core PPI (Low-Moderate Impact):
If PPI prints lower as expected, this should fuel bullish momentum.
No major rallies or crashes expected, but could provide continuation fuel.
Thursday 09/11/2025 – CPI Y/Y (High-Moderate Impact):
Historically, N100 reacts inversely to bullish CPI prints.
Based on past CPI releases (08/12/25, 07/15/25, 06/11/25, 02/12/24), expect a possible short-term dip before resuming the trend.
Best opportunities may come after NY open liquidity grabs.
⚠️ Risk Disclaimer
This is not financial advice – just my personal analysis. If we all knew exactly where the market was going, we’d all be millionaires. Trade cautiously and always prioritize risk management.
Happy Trading ❤️

QQQ Concentration RiskSince mid-2023, the gap has steadily widened - it doesn’t mean an immediate reversal, but it does mean QQQ is very top-heavy (the NDX/NDXE ratio tends to oscillate in bands; rather than, trend infinitely higher)
Strong NDX vs weak NDXE suggests a fragile rally
If mega-caps stumble, the whole index could pull back hard
However, if breadth improves (NDXE starts outperforming), that would strengthen the rally base
Current leadership concentration favors short-term bullish momentum (45%), but the rally is fragile, if mega-caps falter, the downside could open quickly (30%)
1. FAANG + NVDA/TSLA Leadership Persists
Ratio keeps rising (NDX > NDXE)
Leaders continue to attract flows (AI, cloud, semis).
QQQ pushes to new highs with narrower breadth
Rally vulnerable if just one or two leaders stumble (NVDA, AAPL, etc.)
+5–10% upside near term if momentum holds
2. Pause & Rotation (25%)
Ratio stalls near highs
Equal-weight (NDXE) starts to catch up
Breadth improves modestly, but QQQ as a whole chops sideways
QQQ consolidates in a 5%–7% band
3. Breadth Divergence Resolves Lower (30%)
Concentration risk unwinds
Leaders mean-revert (profit-taking, earnings disappointments)
NDX underperforms NDXE, ratio falls from highs
QQQ could correct −10% or more
The ratio at 2.88 is stretched relative to historical balance
A “reasonable” medium-term range would be closer to 2.3–2.5 (15% to 25% on percentage scale)
Implies QQQ pause/correction while NDXE holds steady or outperforms, or broadening participation (small/mid Nasdaq catching up)
