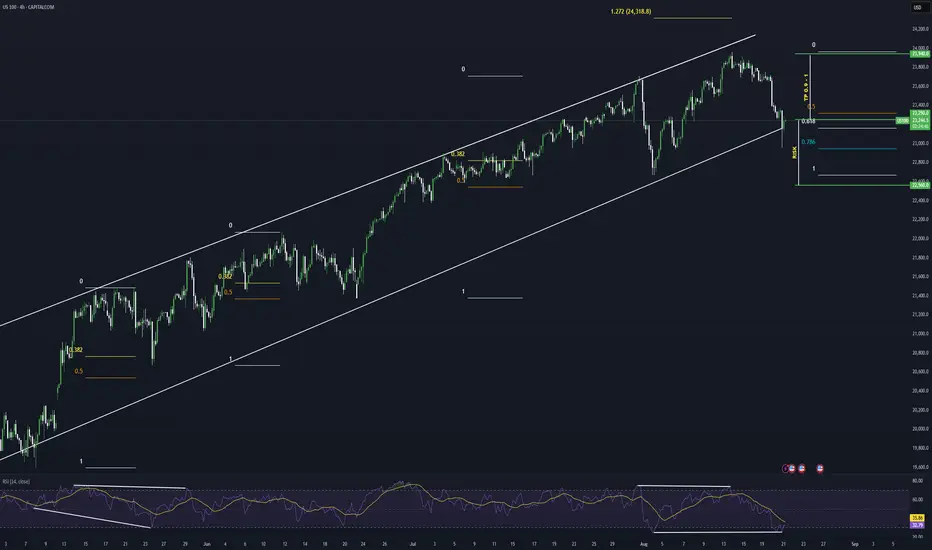
NAS100 - Stock Market, Waiting for Inflation Index?!The index is above EMA200 and EMA50 on the one-hour timeframe and is in its long-term ascending channel. If the drawn upward trend line is maintained, we can expect Nasdaq to reach its previous ATH. In case of its valid breakdown, its downward path will be smoothed to the specified demand zone, where it can be bought with appropriate risk-reward.
U.S. equities closed lower on Friday after a volatile session, capping off a turbulent week in negative territory. Initially, weaker-than-expected employment data fueled optimism that the Federal Reserve would move toward further rate cuts. However, growing fears of an economic recession quickly overshadowed that optimism and pushed the indexes into the red.
Following the labor market report, expectations for a 25-basis-point rate cut at the Fed’s September meeting are now virtually certain. The main question, however, is how fast subsequent cuts might unfold. Some analysts have even floated the possibility of a surprise 50-basis-point cut on September 17. Fed Chair Jerome Powell, speaking at the Jackson Hole symposium, stressed that risks stemming from labor market weakness may now outweigh inflation risks—a factor that could justify a shift in the central bank’s policy approach.
Nick Timiraos, a prominent Wall Street Journal reporter closely tracking Fed policy, noted that the sharp slowdown in job growth over the summer has likely cemented the Fed’s decision to cut rates by 25 basis points in the upcoming meeting.
Still, he made no explicit mention of a 50-basis-point move. While markets have raised the probability of that scenario to 14%, Timiraos believes the main focus remains on a more moderate reduction. He also observed that the latest jobs report has deepened uncertainty over the pace and scope of cuts beyond September—a challenge that policymakers and markets will grapple with in the months ahead.
Barclays Bank now projects the Fed will lower rates three times in 2025—each time by 25 basis points in September, October, and December. This is an upward revision from its earlier forecast of just two cuts in September and December.
President Donald Trump once again lashed out at Fed policy in a post on his social media platform, writing: “Jerome Powell should have cut rates long ago. But as usual, he has acted too late.”
Meanwhile, mounting concerns over ballooning fiscal deficits—not only in the U.S. but also in countries like Japan, France, and the U.K.—have placed added pressure on long-dated bonds. The yield on the 30-year U.S. Treasury briefly climbed to a one-and-a-half-month high last week. At the same time, the Treasury Department plans to issue new three-year, ten-year, and thirty-year securities next week, an event that could further fuel volatility in the bond market.
The coming week will be light in terms of data volume, yet the few scheduled releases will carry significant weight as inflation once again takes center stage. On Wednesday, the Producer Price Index (PPI) for August will be published. Forecasts suggest both the headline and core readings will show sharp declines compared to July.
On Thursday, the European Central Bank (ECB) will hold its policy meeting, where markets currently expect the deposit rate to remain unchanged at 2.15%. Shortly afterward, traders will turn their attention to the U.S. Consumer Price Index (CPI) for August, along with weekly jobless claims data—closely monitored for signs of potential weakness in the U.S. labor market.
Finally, on Friday, the preliminary University of Michigan Consumer Sentiment Index will be released. This survey has been a particularly important gauge of inflation expectations this year, offering deeper insights into how U.S. households perceive price trends.
The PPI, which reflects changes in goods prices at the factory gate, often provides more forward-looking signals than the CPI. As shown in July’s data, any unexpected surge in August’s numbers could temper investors’ optimism about the pace of rate cuts. For now, the impact of tariffs on goods prices appears limited, while the Fed’s main concern remains the risk of renewed inflationary pressures in the services sector. According to the Cleveland Fed’s Nowcast model, headline inflation rose 0.1% in August to reach an annualized rate of 2.8%, while core inflation held steady at 3.1%.
USTECH100CFD trade ideas

The #1 Trading Skill: Controlling Your RiskThe secret to trading isn’t winning every trade - it’s about managing risk.
Risk management and trading. This is one of the most important topics if you’re
serious about becoming a profitable trader. Risk management is the foundation of trading. If
you don’t manage your risk you won’t make it. Simple as that.
No one can predict whether the market will go up or down with 100%
certainty. That’s why as traders we can never fully control how much profit we make. But we
can control one thing. How much we lose. And that brings us to the first step in risk
management. Understanding the power of the risk-reward ratio.
When choosing a trading strategy that suits you one of the factors to consider is its risk-reward
ratio. Every strategy has its own balance between risk and potential reward and understanding
this is key. This is where we need to put our math brains to work.
What is the risk-reward ratio? Simply put it tells us how much we stand to gain for every unit
of risk we take. It’s a straightforward but powerful metric that helps determine whether a
strategy can be profitable over time.
Let’s break it down with a simple example:
• If your strategy has a 1:1 risk-reward ratio it means that for every $100 you risk you
aim to make $100 in profit. Win or lose the potential gain and loss are the same.
• If your strategy has a 1:2 risk-reward ratio you risk losing $100, but if the trade goes
your way you make $200. This means your potential reward is twice as big as your risk.
• If your strategy has a 1:5 risk-reward ratio for every $100 you risk you have the
chance to make $500. Here the possible reward is much greater than the risk you take.
Your risk-reward ratio has a big impact on your overall profitability. But the risk-reward ratio
alone doesn’t tell the full story. To know if a strategy is truly profitable you also need to
consider another key factor: Win rate.
Your win rate is the percentage of trades that end in profit. This is where math and probabilities come into play.
• If your strategy has a 50% win rate it means that out of 10 trades 5 are winners and 5
are losers.
• If your win rate is 40% 4 out of 10 trades will be profitable.
The key to long-term success is finding the right balance between risk-reward and win rate.
• If you have a 1:1 risk-reward ratio and a 40% win rate your strategy won’t be
profitable. Over 10 trades you win 4 times and lose 6 times. Since you win and lose the
same amount per trade your losses will be bigger than your gains in the long run.
• But with a 1:5 risk-reward ratio and the same 40% win rate your strategy becomes
profitable. That’s because your winning trades make far more than you lose on your
losing trades.
The takeaway? There’s no such thing as a right or wrong strategy only ones that are profitable
or unprofitable. The key is to find a strategy that gives you a mathematical edge over time.
NASDAQ H4 : RETESTING TIME ?? Hello Everyone ,
The Nasdaq Currently Got Rejection From OB (23,480)
We Are Expecting Retest Buy From Below Zones ⬇️
OB + FVG (23,275 / 23180)
SUPPORT (23,00 / 22,995)
ORDER BLOCK ( 22,785)
Hope You Understand , Follow Us For More
Good Luck 🤞

ZGM | NASDAQ SNIPER ZONES FOR LONGTERM BASED ON SNR Nasdaq Trade !
NASDAQ H4 BREAKOUT THE SELL TRENDLINE FIRST , AND BOX OF RBS CALLED (RESISTANCE BECOME SUPPORT) HAVE A X SETUP
X SETUP EXPLAINED !
The Sell TL Broke And Nasdaq Have A Buy TL Thats Means Its The XSetup
X SETUP + QM SETUP + SUPPORT
FOLLOW US FOR MORE KNOWLEDGE AND TRADE IDEAS

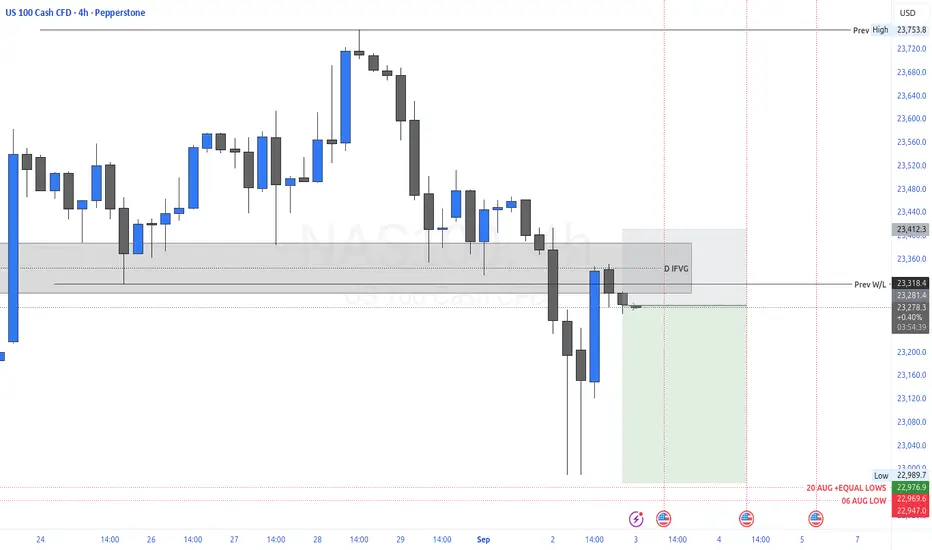
Nas100 Trade Update Sep 4 2025FX:NAS100
www.tradingview.com
Price came into bearish 1h FVG then formed 2m IFVG and hit tp3 60 pips at asia lows. Then hit bullish 1h FVG and formed 2m IFVG to hit tp3 60 pips at BSL

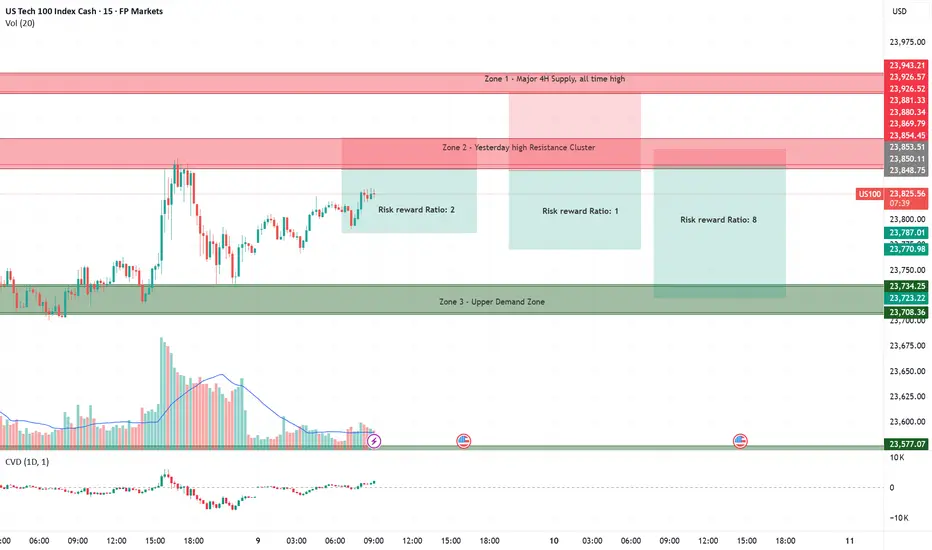
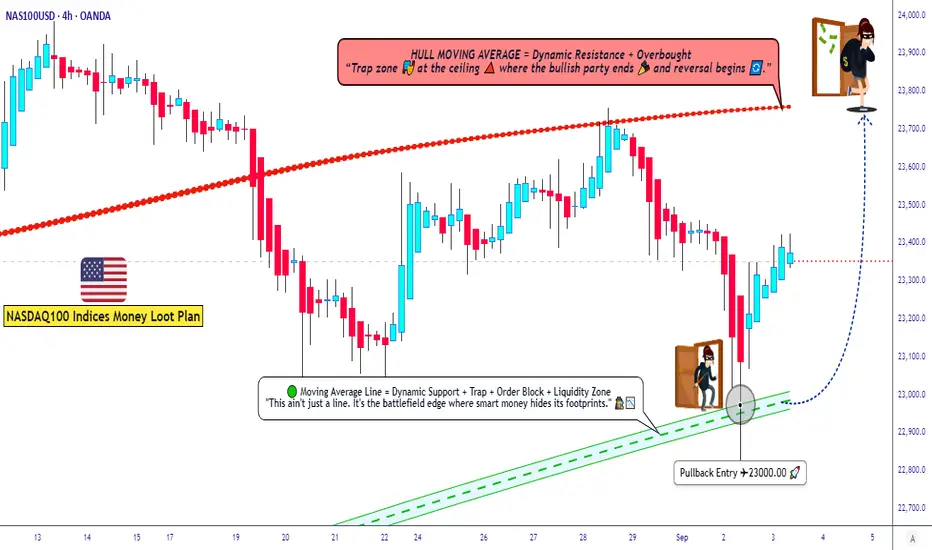
US100 Trading Plan ¦ Layering Strategy + Macro Sentiment Drivers🚀 NASDAQ100 / US100 Index – Thief Money Heist Plan 🎭
📌 Plan: Bullish Swing / Scalping Setup
Dear Ladies & Gentlemen (Thief OG’s), here’s the heist-style breakdown for US100 🔑:
🏴☠️ Entry Style (Thief Layering Strategy)
Using layered limit orders for flexibility & precision:
• 23200.0
• 23250.0
• 23300.0
• 23350.0
(You may increase limit layers based on your strategy & risk appetite)
📉 Moving Average Pullback Entry Plan
• Buy entries on pullbacks to the Fibo level 382 Triangular Moving average zone.
• Look for bullish candles confirming the bounce from these MAs.
• This offers better risk-to-reward by catching momentum on retracements instead of chasing highs.
❓ Why This Works?
• Moving averages often act as dynamic support/resistance in trending markets.
• Institutional traders & algos track them heavily, making them high-probability zones.
• Combining with layering entries = higher flexibility + reduced risk of mistimed single entry.
🛡️ Stop Loss (Protect the Vault)
• Thief SL: @23000.0
• Reminder: Adjust your SL based on your own strategy & risk tolerance.
🎯 Target (Escape Zone)
• Overbought + Trap Zone ahead!
• Escape target: @23750.0
• Note: Don’t rely only on my TP — secure profits at your own pace and risk.
📊 US100 Index CFD Real-Time Data Sep 03
📈 Daily Change: +133.47 (+0.57%)
📅 Monthly Performance: +0.76%
📆 Yearly Performance: +23.48%
😰😊 Fear & Greed Index
📊 Current Reading: 53/100 (Neutral)
🧐 Interpretation: Market sentiment is balanced, showing neither extreme fear nor greed. Investors are cautious but not panicked.
🧠 Retail vs. Institutional Sentiment
👥 Retail Traders: Moderately bullish (55% Long, 45% Short)
🏦 Institutional Traders: Slightly cautious (50% Long, 50% Short)
🔑 Key Drivers: Mixed signals from manufacturing data and upcoming labor market reports.
📉📈 Fundamental & Macro Score
📊 Macro Score: 6/10
Manufacturing PMI (48.7) still in contraction but improving.
Labor market data (JOLTS) awaited for clarity.
⚡ Volatility Score: 5/10 (Moderate)
VIX near average levels, indicating stable expectations.
💧 Liquidity Score: 7/10
Strong volume and breadth in large-cap tech stocks.
🐂🐻 Overall Market Outlook
✅ Bullish (Long): 60%
Supported by strong yearly gains and resilience in big tech.
⚠️ Bearish (Short): 40%
Concerns over manufacturing contraction and inflation pressures.
💡 Key Takeaways
📈 US100 is trending mildly positive today (+0.57%).
😐 Sentiment is neutral—no extreme fear or greed.
📊 Macro data hints at cautious optimism but watch for upcoming labor reports.
🐂 Overall bias leans slightly bullish for long-term holders.
📊 Related Pairs to Watch
FOREXCOM:SPX500
TVC:DJI
TVC:VIX
NASDAQ:NDX
FX:USDOLLAR
✨ “If you find value in my analysis, a 👍 and 🚀 boost is much appreciated — it helps me share more setups with the community!”
#NASDAQ100 #US100 #NDX #SPX500 #DJI #TradingView #SwingTrade #ScalpTrading #LayeringStrategy #MarketAnalysis
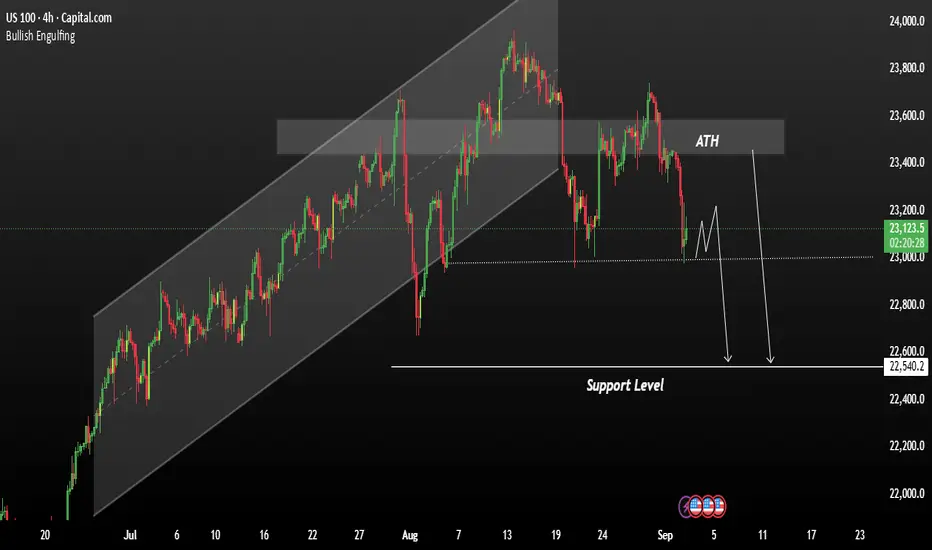
USNAS100 remains in a consolidation phase with a downside biasThe USNAS100 remains in a consolidation phase with a downside bias, following a slight price slip on Friday, as traders turned cautious ahead of the PCE inflation report — the Fed’s preferred gauge for inflation This Personal Consumption Expenditures (PCE) report, due pre-market, is highly anticipated and may play a pivotal role in shaping the Federal Reserve's September rate decision.
Price action remains below key resistance levels As long as the index fails to break above resistance, the bias remains bearish A downside break from consolidation could target 22,540 in the short term.
You may find more details in the chart.
Trade wisely best of Luck,
Ps; Support with like and comments for better analysis Thanks for supporting.
NASDAQ 1D MA50 SUPPORT NASDAQ 1D MA50 Support 🟢
NDX consolidating on the 1D MA50 inside its Channel Up since May.
RSI setup looks like the May 30 Higher Low ✅.
Last bullish leg from this formation gave +6.80% — same play now targets 24,500 🎯.
Kaizo precision. Rally loading… 🥷🚀

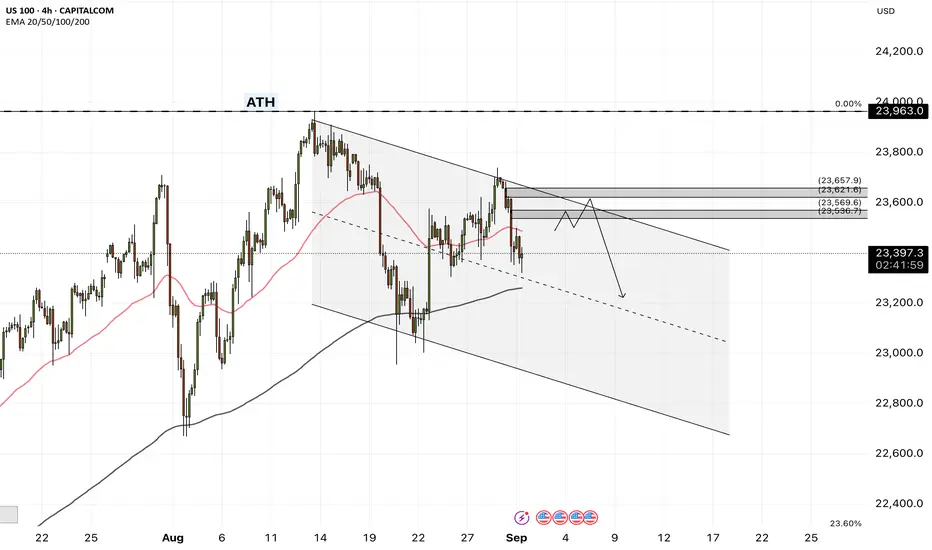
NASDAQ Eyes 23,565 Pivot as PCE Report LoomsNASDAQ – Update
The Nasdaq slipped on Friday as traders turned cautious ahead of the highly anticipated PCE inflation report, the Fed’s preferred gauge that could heavily influence the September rate decision. The release, expected before the bell, will likely set the near-term trend.
Technical Outlook:
The index reversed from resistance, showing signs of pressure ahead of the data.
A 1H close below 23,565 will confirm bearish continuation toward 23,435 → 23,295 → 23,170, especially if PCE comes in hotter than expected.
If the report is softer, bullish momentum may resume, targeting the ATH at 23,870, with extended resistance at 24,090.
Key Levels:
Support: 23,565, 23,435 – 23,295 – 23,170
Resistance: 23,690 – 23,870 – 24,090
📌 Bias: Neutral ahead of the PCE release. Expect high volatility and wait for confirmation at the pivot level before positioning.

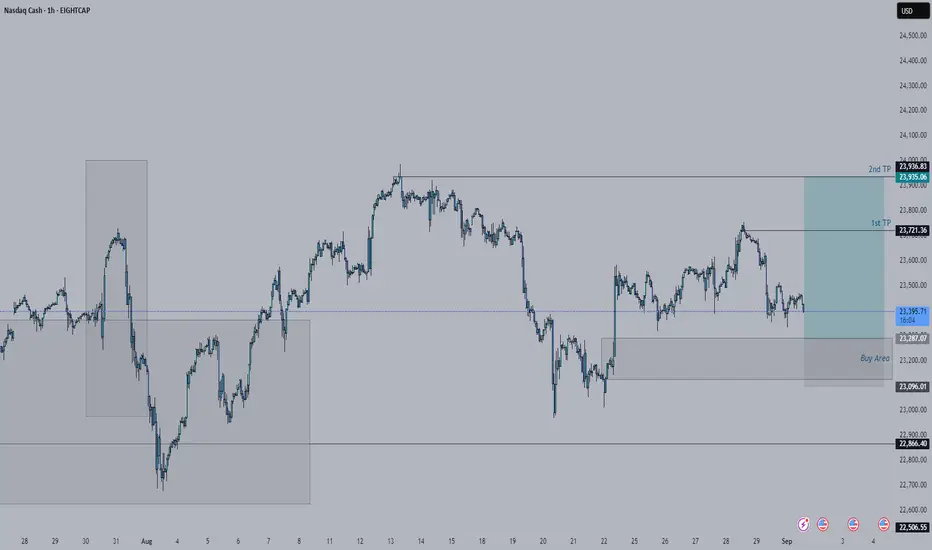
NAS100 Long Setup | Demand Zone ReactionPrice action on NAS100 has pulled back into a key demand zone after sweeping liquidity below short-term support ($$$). This area also aligns with previous imbalance fills, suggesting buyers may look to defend it once again.
📊 Technical Outlook
Price swept liquidity under prior support and tapped into demand.
Long idea is valid with risk defined below demand zone.
If buyers hold this zone, upside continuation is likely toward the 23,500–23,700 region.
🌐 Market Sentiment
Seasonality Risk: September is historically the weakest month for U.S. equities, often marked by heightened volatility.
Investor Sentiment: Surveys show mixed outlook — Fear & Greed Index remains in “Greed” (64), while AAII still reports more bears than bulls.
Macro Headlines: Fed uncertainty, tariff rulings, and over-reliance on tech remain short-term risks.
⚖️ Summary
Technically, NAS100 is sitting in a prime buy zone — liquidity grab + demand reaction setup. However, fundamentals still suggest caution, as September volatility could trigger deeper sweeps before a meaningful rally.
👉 For me, it’s a buy from demand with controlled risk. If bulls defend, we could see momentum shift back upward.
💬 What do you think — will bulls hold this level, or will September’s volatility push NAS100 even lower?

NAS100 H4 | Bearish drop offNAS100 has rejected off the sell entry of 23,475.21, which is a pullback resistance that lines up with the 38.2% Fibonacci retracement and could drop from this level to the downside.
Stop loss is at 23,575.82, which is a pullback resitance that aligns with the 61.8% Fibonacci retracement.
Take profit is at 23,110.94, which is a swing low suport that is slightly below the 161.8% Fibonacci extension.
High Risk Investment Warning
Trading Forex/CFDs on margin carries a high level of risk and may not be suitable for all investors. Leverage can work against you.
Stratos Markets Limited (tradu.com ):
CFDs are complex instruments and come with a high risk of losing money rapidly due to leverage. 65% of retail investor accounts lose money when trading CFDs with this provider. You should consider whether you understand how CFDs work and whether you can afford to take the high risk of losing your money.
Stratos Europe Ltd (tradu.com ):
CFDs are complex instruments and come with a high risk of losing money rapidly due to leverage. 66% of retail investor accounts lose money when trading CFDs with this provider. You should consider whether you understand how CFDs work and whether you can afford to take the high risk of losing your money.
Stratos Global LLC (tradu.com ):
Losses can exceed deposits.
Please be advised that the information presented on TradingView is provided to Tradu (‘Company’, ‘we’) by a third-party provider (‘TFA Global Pte Ltd’). Please be reminded that you are solely responsible for the trading decisions on your account. There is a very high degree of risk involved in trading. Any information and/or content is intended entirely for research, educational and informational purposes only and does not constitute investment or consultation advice or investment strategy. The information is not tailored to the investment needs of any specific person and therefore does not involve a consideration of any of the investment objectives, financial situation or needs of any viewer that may receive it. Kindly also note that past performance is not a reliable indicator of future results. Actual results may differ materially from those anticipated in forward-looking or past performance statements. We assume no liability as to the accuracy or completeness of any of the information and/or content provided herein and the Company cannot be held responsible for any omission, mistake nor for any loss or damage including without limitation to any loss of profit which may arise from reliance on any information supplied by TFA Global Pte Ltd.
The speaker(s) is neither an employee, agent nor representative of Tradu and is therefore acting independently. The opinions given are their own, constitute general market commentary, and do not constitute the opinion or advice of Tradu or any form of personal or investment advice. Tradu neither endorses nor guarantees offerings of third-party speakers, nor is Tradu responsible for the content, veracity or opinions of third-party speakers, presenters or participants.

NAS100 - Stock Market, in the Work Week!The index is below the EMA200 and EMA50 on the four-hour time frame and is in its short-term descending channel. If this channel is maintained and the specified range is reached, a close sale can be made with a suitable reward.
Economists anticipate that customs tariffs will push consumer prices higher while slowing economic growth in the coming months. Inflation is expected to accelerate, though not to the extreme levels of the 1970s when the term “stagflation” was coined to describe the combination of high inflation and economic stagnation. Unlike a recession—where the economy contracts and prices fall—stagflation features rising prices despite economic weakness. The U.S. economy could be heading toward a 1970s-style stagflationary environment, though analysts believe this time it will be far less severe.
Many experts argue that the U.S. is on the verge of a period of sluggish growth paired with accelerating inflation. The root cause lies in President Donald Trump’s tariffs, which simultaneously raise consumer costs and weigh on the labor market. However, economists expect this inflationary wave to be much milder than the double-digit annual increases that strained household budgets in the 1970s.
On the corporate front, Nvidia released its second-quarter earnings last week. Revenue reached $46.7 billion, exceeding analysts’ expectations of $46.23 billion. The company’s data center unit—the main growth driver—generated $41.1 billion, slightly below the $41.29 billion forecast. Adjusted earnings per share came in at $1.05, while the adjusted gross margin stood at 72.7%.
Looking ahead, Nvidia projected third-quarter revenue of around $54 billion, with a margin of error of plus or minus 2%. Its board also approved an additional $60 billion share repurchase program. Regarding China, the company reported zero sales of H20 chips to Chinese clients during Q2 and stated that no shipments are planned for that market in the near future.
In the earnings call, CEO Jensen Huang emphasized that the Chinese market could present a $50 billion opportunity for Nvidia this year. He estimated annual growth in China at nearly 50%, noting that the country is the world’s second-largest computing market and home to half of global AI researchers. Huang stressed that maintaining a presence in China is vital for the company’s long-term future, even amid ongoing political and trade tensions between Washington and Beijing.
On the monetary policy side, UBS warned that weakening the independence of the Federal Reserve—especially following Trump’s threat to remove Fed board member Lisa Cook—could have significant economic consequences. In its analysis of Jerome Powell’s speech at the Jackson Hole symposium, UBS described it as “classic Powell”: hinting at the possibility of a September rate cut to offset tariff effects but lacking a broader long-term framework for the evolving economy.
UBS emphasized that failure to strongly defend Fed independence could heighten political risks and destabilize markets.The bank warned that if the central bank comes under political influence, potential outcomes include the reemergence of inflationary instability, a one-percentage-point increase in real borrowing costs, and negative effects on fiscal policy, corporate investment, housing affordability, household savings, and speculative activity.
This week begins with one fewer trading day due to the Labor Day holiday, yet the economic calendar remains packed, with the labor market at the center of attention. On Tuesday, the ISM Manufacturing PMI for August will be released, followed by the JOLTS job openings report on Wednesday.
Thursday will be particularly important, bringing the August ADP private payrolls report, weekly jobless claims, and the ISM Services Index—all at once. These data points are especially significant given the recent large revisions to the Nonfarm Payrolls (NFP) report, which have renewed focus on the degree of convergence or divergence between ADP and NFP figures.
Historically, ADP and NFP reports have often diverged, leaving traders mispositioned when relying too heavily on ADP data. A recent example occurred in July, when ADP reported a decline of 33,000 jobs, while NFP the following day showed a gain of 147,000—well above expectations of 110,000. However, after NFP revisions, the actual trend proved more consistent with ADP’s numbers.
The most important event of the week will take place on Friday: the release of the August U.S. Nonfarm Payrolls report. Investors will be monitoring it closely, as any signs of labor market weakness could reinforce expectations for a Fed rate cut in mid-September.
Despite growing stagflation risks and heightened market volatility, Bank of America (BofA) suggested that autumn could be an attractive entry point for bullish investors. The bank cautioned that while volatility may exert short-term downward pressure, potential pullbacks could serve as buying opportunities.
The VIX volatility index fell to its lowest level of the year following Powell’s dovish remarks at Jackson Hole. Still, concerns about stretched stock valuations, a potential AI-driven bubble, and political risks tied to Fed independence suggest that this calm may not last.
NasDaq Bullish analysisNasDaq is currently retracing back on the gap it made previous movement it had. Bigger time frame NasDaq is buy, the movement it is making at the moment is just a reaction before it pushes back to the upside.
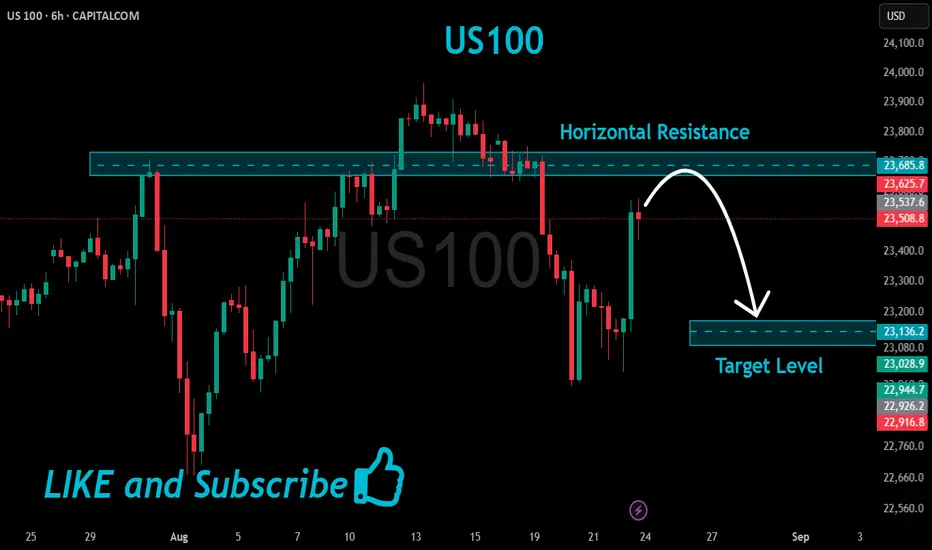
US100 Resistance Ahead!
HI,Traders !
#US100 is trading in an
Uptrend and Silver shot
Up sharply today and it
Is now locally overbought
So after the retest of the
Horizontal resistance above
At 23685.8 from where we
Will be expecting a local
Bearish move down!
Comment and subscribe to help us grow !
Bullish momentum to extend?US100 is falling towards the support level, which is an overlap support that aligns with the 23.6% Fibonacci retracement and could bounce from this level to pir tale prpft.
Entry: 23,546.52
Why we like it:
There is an overlap support level which aligns with the 23.6% Fibonacci retracement.
Stop loss: 23,300.44
Why we like it:
There is a pullback support that lines up with the 61.8% Fibonacci retracement.
Take profit: 23,938.06
Why we like it:
There is a swing high resistance.
Enjoying your TradingView experience? Review us!
Please be advised that the information presented on TradingView is provided to Vantage (‘Vantage Global Limited’, ‘we’) by a third-party provider (‘Everest Fortune Group’). Please be reminded that you are solely responsible for the trading decisions on your account. There is a very high degree of risk involved in trading. Any information and/or content is intended entirely for research, educational and informational purposes only and does not constitute investment or consultation advice or investment strategy. The information is not tailored to the investment needs of any specific person and therefore does not involve a consideration of any of the investment objectives, financial situation or needs of any viewer that may receive it. Kindly also note that past performance is not a reliable indicator of future results. Actual results may differ materially from those anticipated in forward-looking or past performance statements. We assume no liability as to the accuracy or completeness of any of the information and/or content provided herein and the Company cannot be held responsible for any omission, mistake nor for any loss or damage including without limitation to any loss of profit which may arise from reliance on any information supplied by Everest Fortune Group.

A Crucial Test Lies Ahead for the Nasdaq 100The Nasdaq 100 faces a major test over the remainder of this week, with Nvidia reporting results after the close on 27 August and the US PCE report due on the morning of 29 August. The index has struggled to regain its losses after peaking on 13 August, facing stiff resistance just below the 61.8% retracement level at 23,670. In addition, the 10- and 20-day moving averages have proved to be sticking points, with the index unable to break away from either.
Momentum, as measured by the relative strength index, has also turned lower, forming a series of lower highs. Furthermore, a bearish divergence has emerged, with the RSI making lower highs while the Nasdaq 100 registered higher highs from the end of July through to mid-August.
Looking more closely, we see that the Nasdaq 100 had a straight-line rally on 22 August, and such rallies can sometimes be treated in a similar fashion to gaps. As a result, it is entirely possible that the index could give back its recent gains and fall back to 23,210, especially if it continues to struggle to surpass resistance at 23,620.
A breakout above 23,620 would be a bullish development despite a number of bearish signals. It would suggest the potential for the index to rise to 23,800 and possibly back to the previous highs.
Written by Michael J. Kramer, founder of Mott Capital Management.
Disclaimer: CMC Markets is an execution-only service provider. The material (whether or not it states any opinions) is for general information purposes only and does not take into account your personal circumstances or objectives. Nothing in this material is (or should be considered to be) financial, investment or other advice on which reliance should be placed.
No opinion given in the material constitutes a recommendation by CMC Markets or the author that any particular investment, security, transaction, or investment strategy is suitable for any specific person. The material has not been prepared in accordance with legal requirements designed to promote the independence of investment research. Although we are not specifically prevented from dealing before providing this material, we do not seek to take advantage of the material prior to its dissemination.

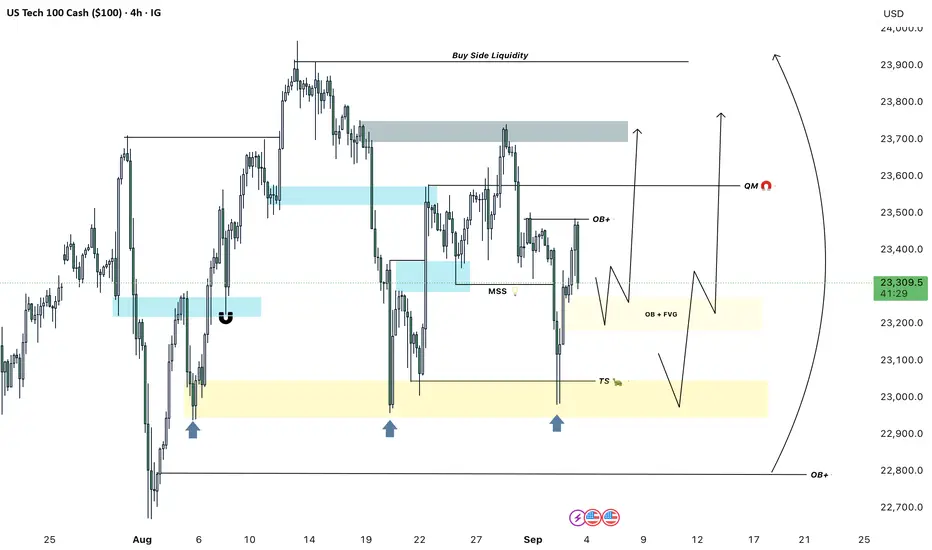
NQ is still bullish on the HTFDespite NQ being bearish on the lower timeframes, it is very bullish on the higher timeframe. with good risk management, I would prefer siding with the buyers as per my analysis attached.

NASDAQ holding the 4H MA200 can initiate the next rally.Nasdaq (NDX) has been trading within a Channel Up since mid May and currently is consolidating on its 4H MA200 (orange trend-line). Based on the 4H RSI we might be on a similar Higher Low as on May 30, having previously made a Channel Up bottom near the 1D MA50 (red trend-line).
The Bullish Leg that followed this Low was +6.80%, so we have our Target tailored on it at 24500.
-------------------------------------------------------------------------------
** Please LIKE 👍, FOLLOW ✅, SHARE 🙌 and COMMENT ✍ if you enjoy this idea! Also share your ideas and charts in the comments section below! This is best way to keep it relevant, support us, keep the content here free and allow the idea to reach as many people as possible. **
-------------------------------------------------------------------------------
💸💸💸💸💸💸
👇 👇 👇 👇 👇 👇

NASDAQ Potential Bullish ContinuationNASDAQ price action seems to exhibit signs of potential Bullish momentum as the price action may form a credible Higher Low with multiple confluences through key Fibonacci and Support levels which presents us with a potential long opportunity.
Trade Plan:
Entry : 23250
Stop Loss : 22560
TP 0.9 - 1: 23870 - 23940
US100: Ready to rise further after good US dataUS100: Ready to rise further after good US data
Today the US reported very good data in general. Despite being preliminary data, they are still showing signs of a strong economy.
Tomorrow the US will report the final data and they have a good chance of being higher than expected.
Given that the US continues to have strong data despite the mess that Trump is creating, there is a good chance that the indices will continue to rise further. They are a clear indicator of the US economy. We must be careful of any manipulation that may occur or from Trump's comments.
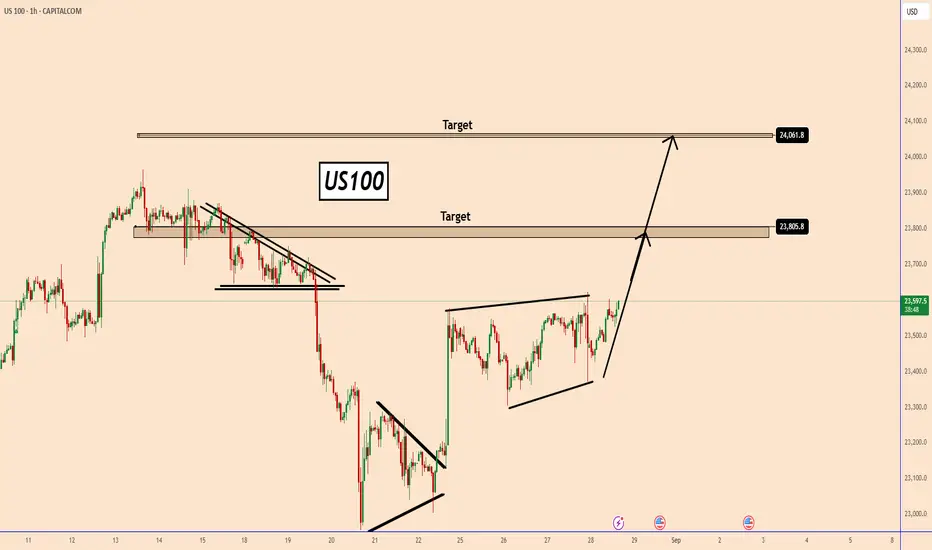
US100 completed a clear bullish pattern and it could reach 23800 and 24100 soon
You may find more details in the chart!
Thank you and Good Luck!
PS: Please support with a like or comment if you find this analysis useful for your trading day
US initial jobless claims 229K vs 230K expected
US GDP 2nd estimate for Q2 3.3% vs 3.1% estimate
US PCE prices preliminary 2.0% vs 2.1% preliminary
PCE ex food and energy housing 2.2% versus 2.2% preliminary
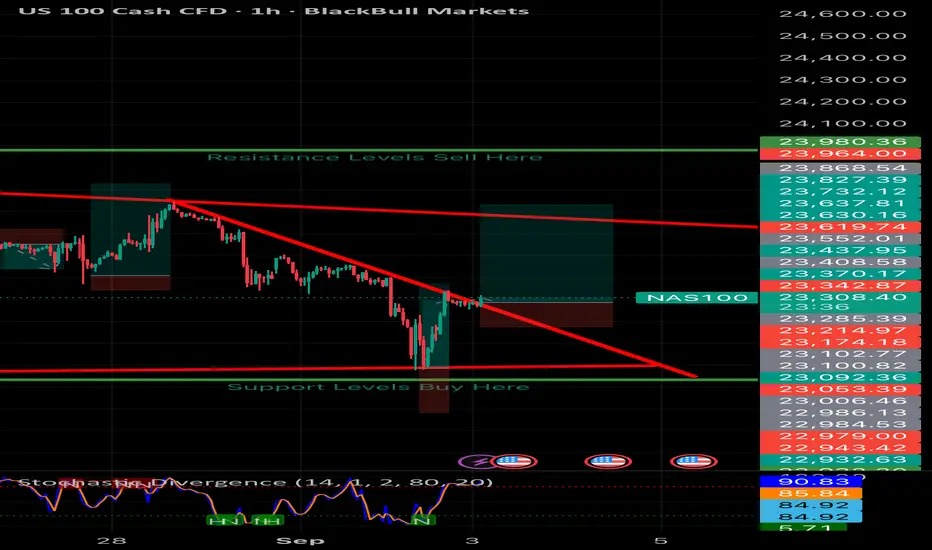
NAS100 technical analysisNAS100 technical analysis. Price just broke through trend line. Confirms price should continue to be bullish and go up to resistance levels.