Sark into the 5-0Shark appears to have been completed at the 113 area of our top of the old high and reversed. Let’s see if we can get into the 5-0 toward 47200.
Trade ideas

The Road to DOW 100KWhy the Fourth Turning Won’t Resolve Until Super Cycle Wave III Peaks and Wave IV Finds Bottom:
As we close out 2025 with the Dow Jones Industrial Average within reach of the psychological 50,000 level and despite all the well-deserved doom and gloom, the question on every die-hard bullish investor’s mind is not if the index will reach 100,000, but when — and what price will be paid along the way.
Some analysts interpret the structure as Grand Super Cycle Wave III (or V), depending on where they anchor the pre-industrial baseline. This distinction does not alter the implications: under both counts, the current advance is still part of an extended third wave, and third waves are not where secular crises resolve. They are where excess accumulates.
The rarely seen proprietary chart above from 1693, which splices British Stock prices and the Clement Burgess Index to the Dow, presents a radical yet rigorous Elliott Wave-based perspective:
Before unpacking the connections, a brief orientation is helpful. Elliott Wave degree structures range from small, short-term patterns up to century-scale formations known as Cycle, Super Cycle, and Grand Super Cycle. These higher-order waves capture long economic booms, demographic arcs, technological eras, and broad civilizational moods. When an impulse of this magnitude is still unfolding, the society riding atop it rarely enters true crisis resolution until the wave completes.
The entire advance of the Dow from the 1896 low is part of one single Super Cycle III wave. It is currently in the late stages of a smaller and ongoing 16-year Cycle Wave V within a larger GRAND SUPER CYCLE Wave III (or V, depending on the higher-degree interpretation). The implications are profound.
NOTE: It took 66 years (1900-1966) for the Dow to advance 10x from 100 to 1000, then only 33 years (1966-1999) for another 10x move from 1000 to 10,000. If Elliott’s rule of alternation applies, it might be 66 years from 1999, or 2065, before the Dow advances another 10x from 10,000 to the 100,000 level. Should a Venezuela-like inflation occur in the coming years, it is conceivable that the Dow reaches its 10x 100K milestone 33 years from 1999, or by 2032.
The generational crisis known as the Fourth Turning — the societal upheaval Strauss and Howe originally predicted would end by 2026 — will not find resolution until Super Cycle Wave III tops and its corresponding Wave IV bottoms, likely sometime between 2030 and 2036.
BULLISH NOTE: As captioned beneath the chart above, it is plausible that strong inflationary winds can extend the current 16-year Cycle Wave V to 2030-2032, inverting our suspicion for a severe decline into this period. If this occurs, Super Cycle III will have thrown over the upper trend channel and be marked accordingly.
Because Super Cycle III has not yet peaked, the conditions required for a true Fourth Turning catharsis have not yet formed. Instead of concluding, the crisis continues to compound—geopolitical fractures, monetary instability, demographic strain—held in suspension by a still-advancing secular market wave. The tension builds, but the break has not arrived.
Until Super Cycle III peaks, perhaps in 2026, when it surpasses the 5X threshold of 50K after passing its last major 10X milestone at 10K in 1999, the path remains upward with violent trepidation.
The Grand Channel: A 330-Year Perspective
When British stock data from 1693 is spliced with the Dow Jones Industrial Average beginning in 1896, a remarkable parallel channel emerges:
The lower trendline connects the Clement Burgess 1857 low, the 1896 low, and the 1932 low.
The upper trendline is a parallel copy drawn from the 1720 South Sea Bubble peak, which aligns rather nicely with the current print highs in the Dow for 2025-2026. A throw-over above the upper trend channel is always possible.
This channel has contained the entire modern equity advance for over three centuries. The current price action is pressing hard against the upper boundary — a classic termination signal in Elliott Wave analysis.
The Grand Super Cycle uptrend channel from 1693 to the present.
Super Cycle Degree: One Unfolding Impulse
The entire move from 1896 is labeled as a single Super Cycle advance:
Super Cycle I — 1857 low to 1881 high
Super Cycle II — 1929 crested with an expanded Cycle degree B wave peak high leading to the 1932 low (a sharp, primary five-wave down Cycle degree C-Wave correction terminating Super Cycle II).
Super Cycle III — 1932 low to present (extended, currently completing an extended Cycle V)
The post-1932 advance is not five complete Super Cycle waves. It is an extended third at Super Cycle degree still in progress, with the current rally from the 2009 low representing Cycle V within that larger III wave.
This labeling reconciles and defines the extraordinary duration and amplitude of the bull market without violating Elliott’s rules of proportionality and alternation.
Primary and Cycle Degree: The Final Leg
Within the ongoing Super Cycle III, the advance since 1932 subdivides into five clear Cycle waves with an additional subdivision at the primary degree between 1942 and 1999.:
Cycle I — 1932–1937
Cycle II — 1937–1942
Subdivided Primary Degree (within Cycle III):
Primary 1 — 1942-1946
Primary 2 — 1946-1949
Primary 3 — 1949-1965
Primary 4 — 1965-1982
Primary 5 — 1982-1999
Cycle III — 1942–1999
Cycle IV — 1999–2009
Cycle V — 2009-present (extended, currently in its terminal phase 2025-2032)
The post-2009 Cycle degree rally is the last of Cycle V (terminal to Super Cycle III from the 1932 low) — the structure that produced the extraordinary gains of the past sixteen years.
FOUR DEGREES of TREND: Grand Super Cycle Waves are the largest Roman Numerals noted in red, Super Cycle labels are in black, Cycle degree in blue, and the smallest Primary waves are illustrated with standard red numerals and letters.
The Fourth Turning Resolution
The Strauss-Howe updated Fourth Turning framework predicts a period of intense societal crisis peaking in the late 2020s to early 2030s.
In Elliott Wave terms, this crisis corresponds to Super Cycle Wave IV — the deep, multi-year correction that must follow the completion of Super Cycle III.
This correction will likely take the form of a sharp zig-zag, or complex combination, lasting 3–8 years and retracing at least 38% of the entire advance from 1857. Such a decline would drive the Dow down toward the COVID lows of 2020, near the 18,000 level.
The resolution of this Fourth Turning — the rebirth phase — will not begin until Super Cycle Wave IV finds its bottom, projected to occur within the 2030–2036 timeframe.
Only then will Super Cycle Wave V begin — the final advance that carries the Dow to its next 10x target of 100,000.
Conclusion
The market is not yet in the final stages of a multi-century bull market ending in a grand cycle collapse, but rather approaching a Super Cycle Wave IV bear market event , which could still strip the Dow by 60-65% before the Super Cycle V wave bull resumes. The Dow is in the late stages of a multi-century third wave that still has one more explosive leg ahead to tag the Grand Super Cycle terminal.
The Fourth Turning crisis will be severe, but it will be a corrective event within a larger bullish structure — not the end of the Grand Super Cycle advance.
Although investors may wish to sidestep the pending decline, those who mistake Super Cycle Wave IV for the end of the bull market will miss the greatest opportunity of the coming generation.
The channel is speaking.
The waves are clear.
And after some much-needed, long overdue, and well-deserved pain, 100,000 on the Dow remains not just possible — but inevitable. Let’s hope so, anyway.

SELL ON US30 PAPERSTONE CHART DEC 12, 2025I See a shift in momentum towards the downside and i want to capitalise on this move.
despite being at all time high. i will exit when appropriate
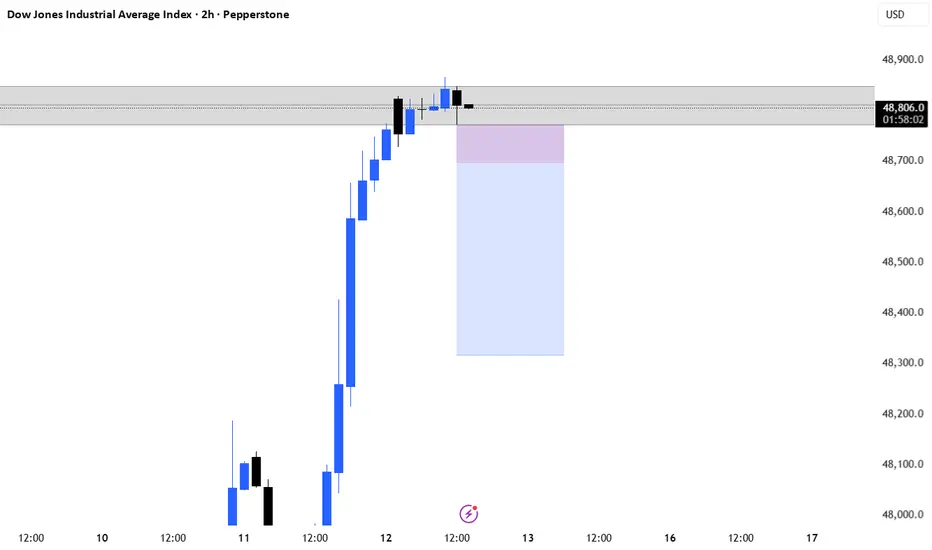
BUYS ON US30. FRI DEC 12, 2025. TRADE IDEA 3 CAPITAL.COM CHARTLooking For LONGS at all Time high if the current BUY Momentum Persists AS seen ON The H2 BULLISH candle. I don't have High expectations though being Friday and the fact that we are at All time High

US30 Trade Set Up Dec 12 2025Price remains bullish making ATH so i will want to see price first sweep internal London lows or lower SSL first before looking for 1m-5m IFVG/CISD to continue higher


H1 NEW WAVEUS30 bullish ,NEW HH printed
Pullback on the previous High ,
waiting an M5 shift in structure on the zone
To take a new move

US30: Late-Cycle Pop or Pullback Setup?The 𝐃𝐨𝐰 is pressing fresh highs into a historically soft seasonal window with stretched momentum and limited follow-through. I’m initiating/adding to a daily timeframe short aiming for a retrace back into prior breakout territory. My baseline path is a drift lower toward 44,500–44,000 (T1) and then the broader demand band near 43,000–42,2500 (T2), where I’ll reassess.
This isn’t a “crash” call—just a tactical mean-reversion as macro tailwinds fade, breadth narrows and the first Fed cut shifts the narrative from “rates down” to “why they’re down.”
Technicals:
• Stretched swing: Price has stair-stepped higher with shallow pullbacks; we’re now extended above the 50/100-DMA stack with waning impulse on push days (smaller real bodies, upper wicks).
• Local resistance: Repeated stalls into the same supply shelf. I’m leaning into the most recent failed extension and fading the box.
Structure map:
• Entry: around/into the failed-break zone 46.4k area.
• Invalidation: daily close > recent spike highs around 47.7k-48.0k.
• Targets: T1 45,000–44,500 (prior ATH retest / micro-POC region); T2 44,000–43,000.
• Risk: 0.5–1.0R per add; scale in only on rejection prints or lower-highs.
Fundamentals:
1) The first Fed cut is not automatically bullish.
The Fed delivered a 25 bps cut in September and signaled more easing, which historically can coincide with late-cycle growth scares and choppier equity returns rather than a straight-line melt-up. The cut was framed around cooling activity and inflation progress. 
2) Growth data is mixed—manufacturing still weak.
The ISM Manufacturing PMI remained in contraction in August (48.7)—below the 50 expansion line—signaling ongoing softness in goods demand. That is typically a headwind for the Dow’s cyclical mix. 
3) ES500 (S&P 500) breadth is narrow; concentration risk elevated.
Mega-caps continue to dominate performance and index leadership, while equal-weight underperforms and concentration risk stays high—conditions that historically increase pullback vulnerability. 
4) Valuations are rich versus history.
FactSet’s mid-summer forward 12-month P/E for the S&P 500 hovered well above 5- and 10-year averages (>22x vs. ~19x/17x), leaving less cushion if growth wobbles or margins compress. 
5) Sentiment & seasonality aren’t tailwinds.
September/early Q4 are seasonally tricky—historically the weakest stretch for US equities—just as the market tries to price the path of cuts vs. growth. 
6) Policy & trade headline risk.
Tariff timelines and “reciprocal” duties remain in play (with officials signaling Aug-1 implementation and additional measures possible), a rolling overhang for global cyclicals and exporters tied into the Dow complex. 
Note: Please remember to adjust this trade idea according to your individual trading conditions, including position size, broker-specific price variations, and any relevant external factors. Every trader’s situation is unique, so it’s crucial to tailor your approach to your own risk tolerance and market environment.

This week we leave it hereThe week has been overall bullish, but as we know we incurred a lot of losses, that is what we will be educating ourselves and finding solutions for. Instead of being bitter and sad about it, we try to win once more, but this time different, Happy trading.

Long therm Nixonian Gold TopExpansion and Rotation Top of Gold from 1980 at its peak, aligns with timing pivots and could be a strong possibility. Will be likely updated as it goes along. Real Estate top by 2028-'29 ?

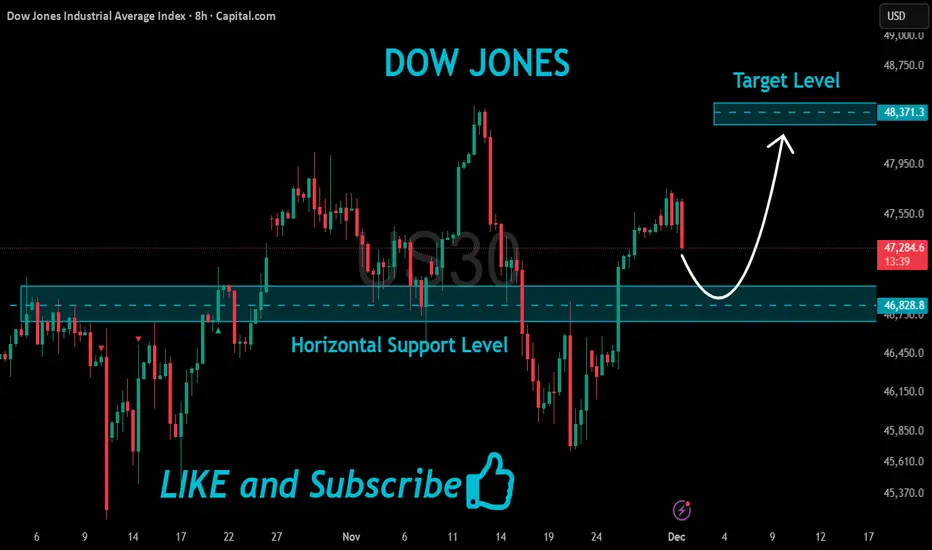
US30 Risky Long!
HI,Traders !
#US30 is about to retest
A horizontal support level
Of 46828.8 while trading
In a local uptrend so
We will be expecting a
Local bullish rebound
And a further move up !
Comment and subscribe to help us grow !
US30 Trade Secured 1500 Pipsperfect trade, sweeping London lows then IFVG on the 2m to target 1h FVG

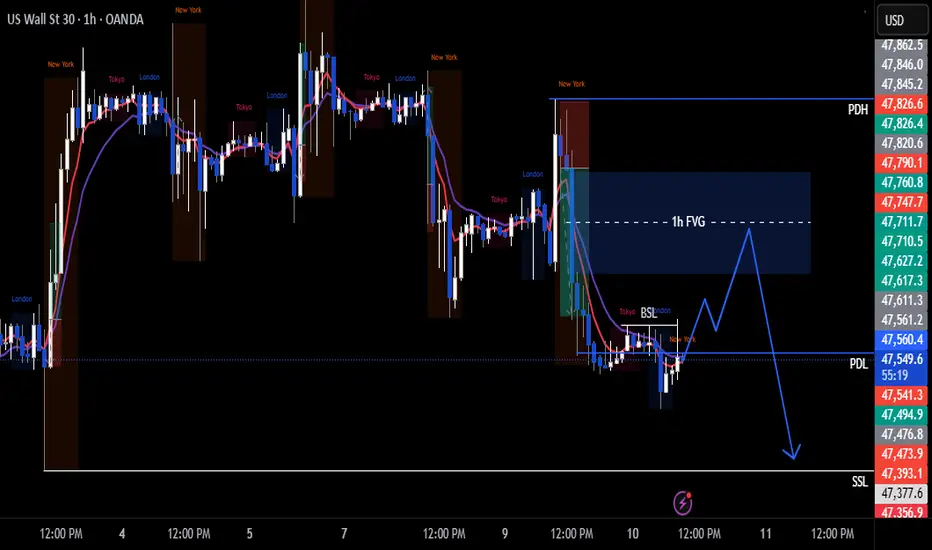
US30 Trade Set Up Dec 20 2025Price is overall bearish making LH/LL but has left a wide 1h FVG i will expect price to fill before continuing its bearish trend to lower SSL
GET READY FOR DOW30 HIGH PROBABILITY BUY SETUP SOON!!!🚨US30 HIGH PROBABILITY BUY SETUP 🚨
* Here We Can See Clearly The Next Potential Moves For DJ30 Coming Hours/Days.
* Keep Your Eyes Close On Your Trading Positions.
* Happy PIP Hunting Traders.
FXKILLA.

Bullish Setup for US30
We have bullish order flow on the 1M and 1W timeframes.
On the daily chart, we have a bullish high-probability leg with a clean FVG.
We took 4H $$ from the range, so we can potentially take sell-side liquidity before moving higher.
Stop: 4H SP(swing point) body
TP: ATH
RR: 1:2

$DJIPrices are elevated, and buyers may not be willing to keep absorbing at these high levels.
To attract fresh liquidity, the market might need to pull back or offer cheaper entry points, otherwise sellers could step in to rebalance the price.
This type of setup usually means volatility is coming as the market searches for fair value.

Going Long on US30I'm waiting for the price to come to my entry, but I will wait for price action for confirmation.

I'm going long on US30I'm waiting for the price to come to my entry, and wait for confirmation. That means price action.

US30 WatchFor those who see this I am a London/NY session intraday trader. So currently I'm watching Us30 I like to wait for a move and a obvious pull back and then continuation. I try not to have a predetermined bias because US30 tends go anywhere at anytime more times than it's not, it's more in my favor to react than to predict. Since 5AM its touched one of my quarter levels. I'm looking for some sort of higher time frame retracement and then looking for entries.
I try to keep my strategy simple. My charts are simple. I follow my own version of price action, which I'll look to explain as I continue to post my charts throughout the week. As of right now this is what I see and I'm still waiting.

US30 Trade Set Up Dec 9 2025Price remains bearish making LH/LL on the 1h so i will wait for a reaction from London lows being swept before looking for internal 1m-5m internal bearish structure to continue lower to demand and SSL

DJ30_Sell Analyses4h swing is Bearish and Price is in Premium gives Bearish Choch
15m swing is Bullish but
15m internal POI is align with 4h
may get some shorts opportunity a after 15m fractal Choch

Potential area for longsJust a potential area to expect longs. Wait for price to retrace to that area and buy with confirmation

Massive WALL STREET Short At All Time High Price is testing the all time high while a head and shoulders formation is visible on the Daily, indicating potential distribution at resistance
On H4, momentum is overbought and price has remained range bound for approximately four sessions, signaling reduced follow through on the upside
Sentiment appears fragile amid discussion of an AI driven excess, and risk appetite is moderating into strength
Harmonic confluence is present, with a deep crab on H1 and a crab on H4 aligning near current levels to define a potential reversal zone
Multi-timeframe momentum is stretched up to H4; bearish RSI divergence is present on H1 and H4, with H4 showing roughly a 15-point divergence while price holds flat
Repeated failures at the all-time high confirm supply; this level continues to cap advances and strengthens the resistance profile
The H1 trend has transitioned from flat to lower, shifting near-term bias to the downside within the broader range
Cross-market context is consistent, as major US indices are also near record highs and failing to extend, which adds intermarket confirmation
Risk parameters are defined with a stop above 48,250 or above the all-time high at 48,425, which would invalidate the reversal thesis
Initial downside objective is 47,300, corresponding to the next significant support and consistent with an H4 scale pullback
Position management should consider partial profit taking at interim supports and a reduction in risk if RSI resets higher without corresponding price weakness
