$5 Billion Nvidia & Intel Deal = Moon?Key Drivers of the Rally
Fed Rate Cut
The Federal Reserve cut short‐term interest rates by 25 basis points this week — the first rate cut in a while. That typically boosts equities because borrowing costs fall, making future earnings more valuable.
The cut also signalled that further easing might be possible, which increases optimism about slower financing conditions ahead.
Strong Tech & AI Sentiment
Tech names, especially those involved in AI, chip manufacturing, cloud, data centres, have had good news. For example, Nvidia & Intel made a joint investment/partnership plan which lifted Intel heavily and helped boost tech indices.
Nvidia is buying $5 billion of Intel common stock at $23.28/share, which gives Nvidia about a 4% stake in Intel.
This comes after recent government investment in Intel (the U.S. got a ~10% stake) to shore up its competitive position.
SPX500H2026 trade ideas

ES | Market may retrace from hereMarket has been on a tear, per the technical seems like it might be a good time for a pullback. Will drop more details shortly.

Cooking a rotation Large frame ranges for 2025 / 2026 -- all targets upside tapped on previous chart and current price inside 12M sell box - with esz already beyond @ 6681.
NFP revision showed employment weaker than data implied and CPI Beat 5 year expectations showing inflation not done.
Consumer sentiment showing pessimism on jobs and prices.
Market front running rate cut "relief" pricing in 3 cuts and pushing es to 4 consecutive days of new ATHs.
3d s1 @ 6621
1d macro s1 @ 6624 s2 @ 6546
Both pending bearish rotation
on esz downside rotation confirms at sustain below 6656
on esu below 8h s1 @ 6606
as of 15 Sept 11:27 ET
esu5 vol @ 861.6k
esz5 vol @ 963.1k
vol has shifted to esz5, current high @ 6681.25
price already inside 3d sell box.
1M sell begins @ 6685
n200 @ 6036
Buy boxes noted on chart, including 12M buy for 2026 and major sup levels @ 5450 and 5037
Rotation is a feature not a flaw.
2025 at roughly 140.9% of range; never be the last one out.
Appreciate the risk.

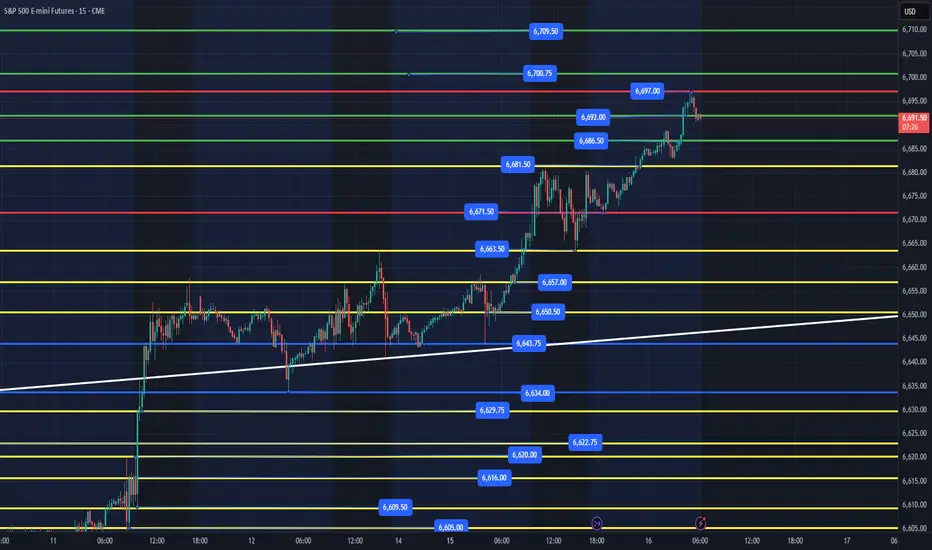
ES - September 17th - FOMC - Daily Trade PlanSeptember 17th - 6am
I stated yesterday in our daily trade plan -
"My main levels I will be watching for a pull back to are 6681-83, 6671, 6643. The white trend line will continue to be a magnet on any pullback, but when we start to really sell off, price can slice through lots of levels below. That is why it is important to be patient and wait for price to build a good base and institutions to start accumulating again."
We pulled back to 6682 then spiked to 6687 then lost the level after the open. We then flushed the overnight low of 6671, spiked, but could not hold anything higher 6675. We finally then hit the Monday afternoon low of 6663 with a very quick flush down to 6661.25. I was actually able to ride this move up to 6673 as my stop was at 6660 (not 6662) when I wrote my note yesterday at 11:07am. I also stated the "reclaim of 6671 should keep us moving higher". 6671 became a magnet yesterday and the highest we got was 6676.
In my 3:35pm Note - "Today we got a nice pullback, and I was able to grab 10pts with a very tight stop. The 6671 level became a magnet this afternoon and then we lost it after 3:15pm. Price should still retest the 6682 level in the overnight session. IF, we lose the 6662 daily low, we will need to work down the levels with 6643 being a good spot for points. I do not think we will lose the 6662 low overnight and will most likely head higher to retest 6682 then continue up the levels if we can hold overhead resistance."
What happened overnight? We still haven't cleared 6676 and finally lost the 6661 level after testing 2x with a nice flush down to 6653 and then reclaim of 6657. You can look at the 1 min chart around 4:30am and see that we flushed down to 6656, then back tested 6661, came back down to make a low at 6653 and you can enter on any reclaim of 6656. Of course, this was a great level reclaim that I was not yet awake for 🤷♂️. The good news, we should get another great setup at some point today.
--------------------------------------------------------------------------------------------------------------------
Today's action is pretty simple, to be honest.
Our overnight session low is 6653 with high at 6674. IF, we can clear 6674, we should continue higher. I think we will get another pullback, Ideally, to flush the 6653 level and reclaim or even better a deeper scary flush below 6643 and reclaim, then head higher up the levels.
Key Support Levels - 6643, 6649-50 (white trendline) 6653, 6659, 6663
Key Resistance Levels - 6674, 6682, 6686, 6692, 6697
Upside targets above are 6700, 6709, 6724, 6732 (IF, Bulls really want it)
My main levels I will be watching for a pull back to are 6659, 6653, 6648-50, 6643. The white trend line (6648-50) will continue to be a magnet on any pullback. Size down today and be patient. We have the FOMC at 2pm and I will only be taking trades that present themselves until around 12pm. I will be off my desk the rest of the day. I will send out a note around 10am after the NYSE open has settled.


ES - September 16th - Daily Trade PlanSeptember 16th - 5:50am
Please note that we are now using the December contracts (ESZ2025). All levels will now be focused on December, not on September (ESU2025). Yesterday & Weekly Trade Plan looks weird due to the rollover on prices. All of these levels have been updated to reflect the new contract and should align with your trading view ES1 or ESZ2025 charts.
I am not going to dive into yesterday, since the contract rolled over and the trading plan of when I posted has switched and everything is out of sync, but we will not have that issue moving forward until December. This will happen 4x a year, 1x each quarter.
What is our game plan for today? If you have been following me for the past couple of months you will know that I am looking for pullbacks that institutions are manipulating to flush key levels, run stops, then get long. Guess what we have lacked the past 3-4 sessions? Not many pullbacks. Our last good pull back was Wednesday 10th at 3:15pm. This can be frustrating but as a professional trader, I have to take what my edge gives me, and I am always hunting for the highest quality setups. I can go without trading for a day or a week, IF, my edge does not present itself. We have had some low-quality trades that I have gotten some 5pt-8pt trades, but not my typical edge. So why is this happening? Well, Institutions are distributing and not accumulating. Retail traders are chasing in, and we have been going parabolic as FOMO has taken over. The VIX has quietly risen to over 18 and yesterday we had a green day with a green VIX. This Tell's me that Institutions are starting to add Insurance to the upcoming FOMC meeting and the VIX should continue to rise heading into tomorrow's 2pm FOMC meeting.
Let's talk about what levels we can grab some points at today.
Our overnight session low is 6671 with high at 6697. At this point, I cannot chase, and we will get a big sell off at some point this week. When we do, you must let price build a base at a core level below, before just blindly entering at a level.
Key Support Levels - 6692, 6681-83, 6671, 6663, 6657, 6650, 6643
Key Resistance Levels - 6697, 6700, 6709+
Upside targets above are 6700, 6709, 6732 (IF, Bulls really want it)
My main levels I will be watching for a pull back to are 6681-83, 6671, 6643. The white trend line will continue to be a magnet on any pullback, but when we start to really sell off, price can slice through lots of levels below. That is why it is important to be patient and wait for price to build a good base and institutions to start accumulating again.
I will post an update around 10am.
--------------------------------------------------------------------------------------------------------------------
Couple of things about how I color code my levels.
1. Purple shows the weekly Low
2. Red shows the current overnight session High/Low (time of post)
3. Blue shows the previous day's session Low (also other previous day's lows)
4. Yellow Levels are levels that show support and resistance levels of interest.
5. White shows the trendline from the August lows.
ES - Weekly Trading Plan - September 15th - 19thSeptember 14th - 7:45am
Recap of last week's plan -
"We have to stay bullish until proven otherwise, last week 6369 was the key level to hold and we did. This week 6410-6425 really needs to hold. I could see us pulling back into the 6425-6435 zone, trapping and moving us higher. The first big level I will be looking for a flush and reclaim is 6453-6458 area, that was last Thursday and Friday's levels."
"Target Levels for Week - 6567, IF, price wants it we could go higher to 6597, 6615 but those are not my main targets for the week as the white trendline around 6567 should be a strong resistance."
On Sunday we opened up and could only pullback to 6480 before building a nice base around 6490 area and that became the key low for the week. We ended up moving higher throughout the week and exceeded our targets of 6567, 6597, and just short of 6615.
-----------------------------------------------------------------------------------------------------------
Let's review this week's plan!
ES contract (ESU2025) expires Friday September 19th, and I will be rolling over after close on Monday to December (ESZ2025). I will keep you posted on the Daily Trade Plan
Last week our low was 6480 with a high of 6606 put in on Friday at the close. The white trend line continues to be support and would be very bullish if we can flush no lower than 6560-64 level and then continue higher to the 6615, 6637 and could reach 6684, IF, price really wants it.
I anticipate trapping this week as we look towards the FOMC on 17th and Quarterly Window Dressing by Institutions.
We have to stay bullish until proven otherwise, last week 6490, 6545, 6575 are 3 key levels to hold this week and look for some reaction. (I will go into more detail on Monday Daily Trade Plan)
Key Support Levels - 6575, 6562-64, 6545-50, 6535, 6523, 6490.
Key Resistance Levels - 6496, 6507-09, 6520, 6542
Target Levels for Week - 6615,6637 and could reach 6684 zone.
My main levels I will be watching for a pull back to are 6576, 6562, 6535 is last big area that I believe needs to hold, or we could be in for a change of character. Any loss of 6490 should be a bigger picture caution sign and we will evaluate price action daily via the Daily Trade Plan.
Follow to read my daily trade plan - I will send out tonight's Sunday Session Open Trade Plan by 5pm EST.
-----------------------------------------------------------------------------------------------------------------
Purple Levels - Weekly High/Low
Green Levels - Weekly Targets
Yellow Levels - Daily Key Levels (See Daily Trade Plan)
White - Rising trendlines from august lows
100 to 1,000,000Proverbs 3:5-6 trust in the lord with all your heart and lean not on your own understanding. acknowledge him in all your ways and he will make your ways straight.
This is the begining of a series, where I Gideon Stoker a follower of Christ will be turning 100$ or in this case 94$ into 1,000,000.

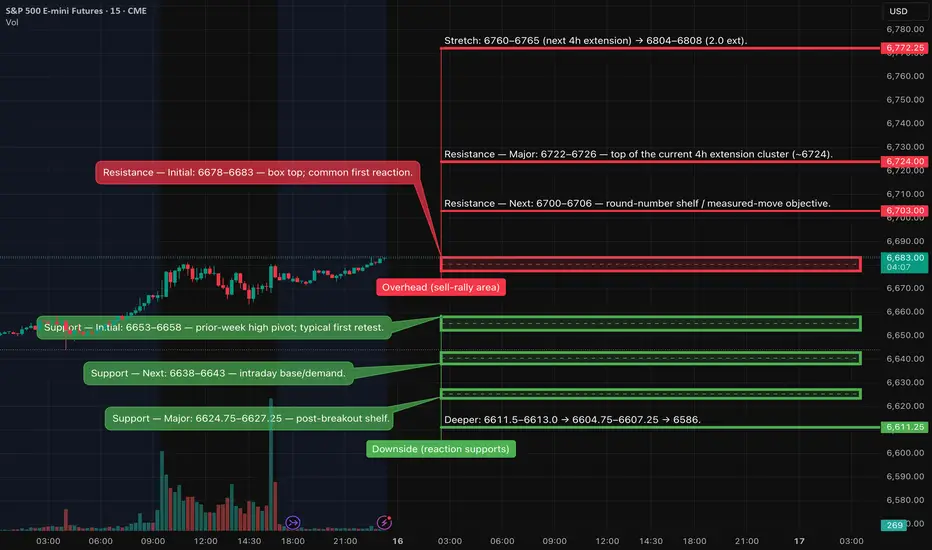
ES (SPX) - Analyses - Key zones - Trade Setups for Tue, Sep 16Bias: BUY DIPS into 6653–6643. Continuation long on 15m acceptance ≥ 6722–6726 with a 5m hold. Counter-trend short only on a clean 15m rejection at 6722–6726 (2.0R gate).
Why bullish bias (even with short fade allowed)
So, here’s why I’m leaning bullish (but I’m cool with a short fade now and then):
First off, when you check out the higher time frame (HTF), the trend is up. It’s usually a better bet to buy when prices dip rather than trying to call the top.
Then there's the risk situation: if we look at support around 6638–6643 and resistance levels at 6678/6700, we can set up for a nice 2R–3R trade with tight stops based on the 15-minute chart.
As for shorts, we’re going against the trend here. The only reason to short would be if we hit major resistance around 6722–6726. But if we don’t see a proper rejection, I’m not going to push it—I’ll just stick to going long.
Setups:
Long — Dip Buy (primary)
• Zone: 6653–6658 (Support-Initial) → 6638–6643 (Support-Next).
• Trigger: 15m reclaims support (body back above) → 5m re-close up with HL → 1m HL entry.
• SL: under the 15m trigger-low −0.25/−0.50.
• TPs: 6678–6683 → 6700–6706 (then trail only after TP2).
Tomorrow’s key U.S. events (ET)
• Retail Sales & Core Retail Sales — 8:30 (consumer pulse; can move index futures).
• Industrial Production & Capacity Utilization — 9:15.
• NAHB Housing Market Index — 10:00.
• Import/Export Price Indexes — 8:30.
• Treasury bill auctions (4- & 8-week; supply headline).
• FOMC (two-day) begins Tue; decision & SEP/dot plot Wed.
• Monthlies/OPEX: Fri Sep 19 (flows can affect tape later in week).
Long — Acceptance Continuation (secondary)
• Flip condition: 15m full-body ≥ 6722–6726 and 5m holds ≥ 6720–6722.
• Entry: 6721–6723 HL retest.
• SL: under the 15m trigger-low −0.25/−0.50.
• TPs: 6760–6765 → 6804–6808.
Short — Rejection Fade (counter-trend, extremes only)
• Zone: Resistance — Major 6722–6726 (or 6700–6706 if Major remains untagged).
• Trigger: 15m sweep & body back inside → 5m LH re-close → 1m fail/reclaim sell.
• SL: 15m sweep-high +0.50.
• TPs: 6678–6683 → 6653–6658 → 6638–6643.
Day 30 — Trading Only S&P Futures | One-Month MarkDay 30 of Trading Only S&P Futures is in the books!
I started the day a little rough, down -100 from an overnight trade, but patience paid off. Watching NQ DD buy signals kept me from forcing shorts early, and SPX gamma levels showed 6620 as the top. Once we hit it, I shorted and played the range for steady gains, finishing with a clean MOB bounce for +196.94.
Big milestone here — 30 straight days of trading only the S&P Futures. The consistency is starting to show, and the lessons are stacking up fast.
📰 News Highlights
VIX jumped 6% while the market gained 0.5% — an odd divergence worth watching.
🔑 Key Levels for Tomorrow=
Above 6645 = Remain Bullish
Below 6635 = Flip Bearish

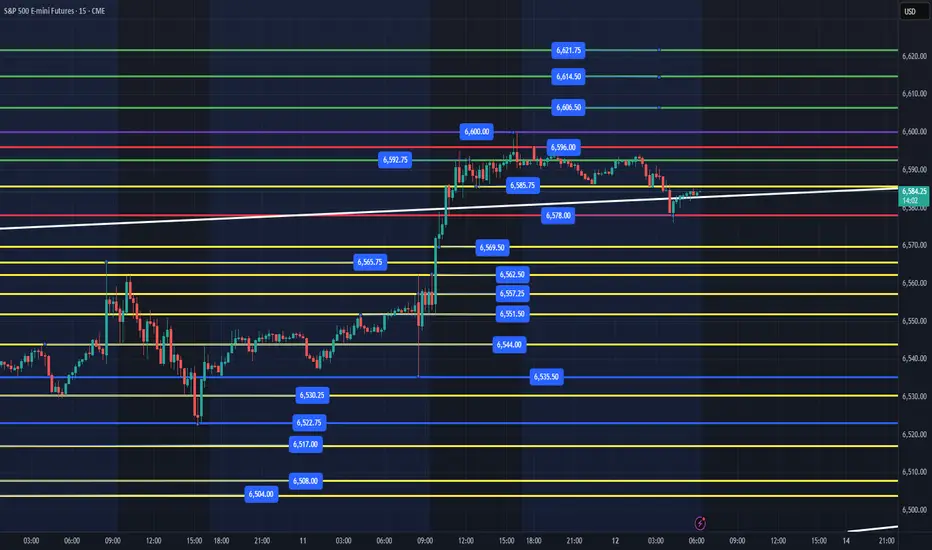
ES - September 12th - Daily Trade PlanSeptember 12th - 6:15am EST
Yesterday we had great trading conditions, and we have exceeded our weekly targets! I wrote at 5:50am EST in my trade plan the following - (You can see it in the related publication section)
"Overnight low is 6534 and high is 6551 as of writing. We have to remain bullish until proven otherwise, so the targets above at 6567, 6578 and if it really wants it can get to 6592. I have said that the white trend line is a magnet that we are heading towards. We just don't know what route price will take to achieve its targets. We focus on our process and edge to take points out of the market daily."
There were 2 key takeaways from this that I want to point out.
1. 6551 was the overnight session high at time of writing. It also became a key support that took us higher after 9:30am. You can see on the 15 min chart a nice consolidation of price that held until breaking out.
2. My initial targets of 6567, 6578 were met, we blew past the white trend line magnet and then ripped past my target of 6592 and the high of the day was 6600.
6600 on ES & 46,000 on DOW are big round numbers! You should never be bearish when the trend is up, I do think we can be cautious for many reasons. September is typically a bearish month, Fed Cutting rates will actually be bearish, not bullish, Employment rate is going higher, Credit Card delinquencies are higher, Auto Payment delinquencies are higher, etc., etc., etc.
Those reasons are data, news, opinions and not how we make money on a daily basis trading ES. As we all know, Institutions make money on news events, by using those events to scare retail investors into a bearish mindset, sell price down to key levels that they can run stops, grab liquidity, and then ride the market higher. It's called accumulation and distribution.
------------------------------------------------------------------------------------------------------------------
Let's get into today's trading plan!
Overnight low is 6576 and high is 6596. We have been going sideways overnight and into the white trend line magnet. We are currently grinding slowly across the white trendline as I write this plan. After a healthy 65pt move yesterday, price needs to settle and figure out what it wants to do. While we don't care what price decides to do or the path it takes, we will just focus on what levels do we think have the highest probability of flushing, reclaiming and driving us higher to the next level. (Why? I do NOT SHORT ES, I LONG areas that liquidity will be present and institutions are buying at).
Key Support Levels - 6576, 6569, 6562, 6551, 6535, 6522
Key Resistance Levels - 6585, 6592, 6596, 6600
Upside targets above are 6606, 6614, 6621+
Key Levels to watch for price opportunities:
1. Overnight low at 6576. This area was tested and really has not given us much of a bounce, so not sure there is much liquidity left in the tank when we test it again.
2. 6562, flush and reclaim to back test 6576 and potentially keep going higher.
3. 6551, flush and reclaim to back test 6576 and potentially keep going higher.
IF, price breaks below 6551, I will only be focused on the flush and reclaim of the levels in blue below at 6535, 6522. This could be 6530, reclaim 6535 or 6517, reclaim 6522.
IF, price can flush and reclaim the red or blue levels, those are always my highest quality spots I am looking to ride higher. The yellow levels are very important support and resistance levels that you can get reclaims of and move higher. They can also be choppy and harder to enter without a short time frame edge for entry. It is all based on your strategy, goals and edge of getting points from ES.
I will post an update around 10am after the NYSE open.
---------------------------------------------------------------------------------------------------------------------
Couple of things about how I color code my levels.
1. Purple shows the weekly High/Low
2. Red shows the current overnight session High/Low (time of post)
3. Blue shows the previous day's session Low (also other previous day's lows)
4. Yellow Levels are levels that show support and resistance levels of interest.
5. White shows the trendline from the August lows.
ES — Week Ahead (Sep 15–19) — Fundamentals & Key Risk WindowsMacro focus: FOMC (Wed 2:00/2:30 pm ET), plus Retail Sales, Industrial Production, Housing Starts, Jobless Claims, Philly Fed, and LEI.
Calendar (ET):
Tue 9/16
• Retail Sales (Aug) 8:30 — Census schedule confirms Sep 16, 8:30 am release.
• Industrial Production (Aug) 9:15 — G.17 release calendar shows Sep 16 at 9:15 am.
• NAHB Housing Market Index (Sep) 10:00 — NAHB schedule sets Sep 16, 10:00 am.
• FOMC (Day 1) begins — Fed calendar.
Wed 9/17
• Housing Starts/Permits (Aug) 8:30 — Census/HUD note next report Sep 17, 8:30 am.
• FOMC Statement 2:00 / Powell 2:30 — Fed event calendar.
Thu 9/18
• Initial Jobless Claims 8:30 — DOL weekly; last print 263k (spike tied to TX/fraud anomalies).
• Philly Fed (MBOS) 8:30 — 3rd Thu schedule.
• Conference Board LEI 10:00 — next release Sep 18, 10:00 am.
Fri 9/19
• State Employment (Aug) 10:00 — BLS schedule.
• (FYI for next week: Existing Home Sales (Aug) Tue Sep 23, 10:00 am.)
Context to watch:
• Markets widely expect a 25 bp cut at the Sep 16–17 FOMC; path/“dots” and Powell’s tone matter more than the cut size.
• Michigan sentiment (prelim) fell to 55.4 with inflation expectations elevated (1-yr 4.8%, 5-yr 3.9%).
Tomorrow (Mon 9/15) — Trade Plan
Kill-zones (ET): NY AM 09:30–11:00; NY PM 13:30–16:00.
News risk: NAHB 10:00 (size down or wait 2–3m around print)
Long from support 6586 → TP1 6600
• 15m trigger: Rejection at 6586 (close ≥ 6587 after testing ≤ 6585).
• 5m confirm: Higher-low + close ≥ 6588.
• 1m entry: First retest that closes back above 6587.
• Hard SL: 15m wick low − 0.25–0.50.
• TP1: 6600 (book 70%, runner 30% @ BE).
• TP2 (runner): 6606.25.
Short from resistance 6600 → TP1 6586
• 15m trigger: Rejection at 6600 (close < 6596.5 after probing ≥ 6598.5).
• 5m confirm: Lower-high + close < 6596.0.
• 1m entry: First retest that closes back below 6596.5.
• Hard SL: 15m wick high + 0.25–0.50.
• TP1: 6586 (book 70%, runner 30% @ BE).
• TP2 (runner): 6581.50.
Weekly plan—how fundamentals change our timing
• Tue AM (Retail Sales 8:30 / IP 9:15 / HMI 10:00): Expect a more directional NY AM; trade level→level but avoid first prints by ±3–5m.
• Wed (FOMC 2:00/2:30): Treat NY PM as the main event; no positions carried into 1:55–2:35 unless already at TP1 with runner @ BE.
• Thu (Claims/Philly/LEI): 8:30–10:00 stack can create a trend morning; trade acceptance if a 15m body prints through a level.
US Stock Market, Retail Investors’ Pessimism;A Positive Signal?1) What is contrarian analysis of financial markets?
Contrarian analysis is an original way of looking at financial markets, based on market sentiment, particularly the sentiment of retail traders, often considered the “weak hands” of the market. Instead of following the dominant opinion, it assumes that the crowd is often wrong, especially retail investors. Indeed, they tend to react emotionally: buying when everything looks good and selling when everything looks bad.
However, markets rarely behave so obviously. When the majority of retail investors are euphoric and convinced that the rally will continue, it often means most of them have already bought, leaving few potential buyers to push prices higher – and therefore the market top may be near. Conversely, when these same investors are pessimistic, it usually indicates that they have already sold, that the downside potential is limited, and that the market bottom is near.
Applied to US equities, this reasoning becomes particularly interesting. Imagine a steadily rising market, supported by strong corporate earnings and a solid economy. If retail investors remain cautious or worried despite this, it may suggest that the rally is not over. Their skepticism leaves room for additional buying later, which can extend the trend.
In summary, contrarian analysis encourages us to view retail investors’ pessimism as an opportunity rather than a threat. As long as they doubt, the market is probably not at its peak. It is only when optimism becomes widespread that real caution is warranted.
2) According to the AAII, retail investors’ pessimism is near its yearly high regarding US equities
The current sentiment situation is particularly interesting. According to the latest survey by the American Association of Individual Investors (AAII), the percentage of retail investors with bearish expectations has climbed near its yearly high and stands well above its historical average.
Yet, the S&P 500 is trading near its all-time high. According to contrarian analysis, this suggests that the bullish cycle top in the S&P 500 has not yet been reached, since market peaks are always built on retail investors’ euphoria (and troughs on their pessimism).
DISCLAIMER:
This content is intended for individuals who are familiar with financial markets and instruments and is for information purposes only. The presented idea (including market commentary, market data and observations) is not a work product of any research department of Swissquote or its affiliates. This material is intended to highlight market action and does not constitute investment, legal or tax advice. If you are a retail investor or lack experience in trading complex financial products, it is advisable to seek professional advice from licensed advisor before making any financial decisions.
This content is not intended to manipulate the market or encourage any specific financial behavior.
Swissquote makes no representation or warranty as to the quality, completeness, accuracy, comprehensiveness or non-infringement of such content. The views expressed are those of the consultant and are provided for educational purposes only. Any information provided relating to a product or market should not be construed as recommending an investment strategy or transaction. Past performance is not a guarantee of future results.
Swissquote and its employees and representatives shall in no event be held liable for any damages or losses arising directly or indirectly from decisions made on the basis of this content.
The use of any third-party brands or trademarks is for information only and does not imply endorsement by Swissquote, or that the trademark owner has authorised Swissquote to promote its products or services.
Swissquote is the marketing brand for the activities of Swissquote Bank Ltd (Switzerland) regulated by FINMA, Swissquote Capital Markets Limited regulated by CySEC (Cyprus), Swissquote Bank Europe SA (Luxembourg) regulated by the CSSF, Swissquote Ltd (UK) regulated by the FCA, Swissquote Financial Services (Malta) Ltd regulated by the Malta Financial Services Authority, Swissquote MEA Ltd. (UAE) regulated by the Dubai Financial Services Authority, Swissquote Pte Ltd (Singapore) regulated by the Monetary Authority of Singapore, Swissquote Asia Limited (Hong Kong) licensed by the Hong Kong Securities and Futures Commission (SFC) and Swissquote South Africa (Pty) Ltd supervised by the FSCA.
Products and services of Swissquote are only intended for those permitted to receive them under local law.
All investments carry a degree of risk. The risk of loss in trading or holding financial instruments can be substantial. The value of financial instruments, including but not limited to stocks, bonds, cryptocurrencies, and other assets, can fluctuate both upwards and downwards. There is a significant risk of financial loss when buying, selling, holding, staking, or investing in these instruments. SQBE makes no recommendations regarding any specific investment, transaction, or the use of any particular investment strategy.
CFDs are complex instruments and come with a high risk of losing money rapidly due to leverage. The vast majority of retail client accounts suffer capital losses when trading in CFDs. You should consider whether you understand how CFDs work and whether you can afford to take the high risk of losing your money.
Digital Assets are unregulated in most countries and consumer protection rules may not apply. As highly volatile speculative investments, Digital Assets are not suitable for investors without a high-risk tolerance. Make sure you understand each Digital Asset before you trade.
Cryptocurrencies are not considered legal tender in some jurisdictions and are subject to regulatory uncertainties.
The use of Internet-based systems can involve high risks, including, but not limited to, fraud, cyber-attacks, network and communication failures, as well as identity theft and phishing attacks related to crypto-assets.

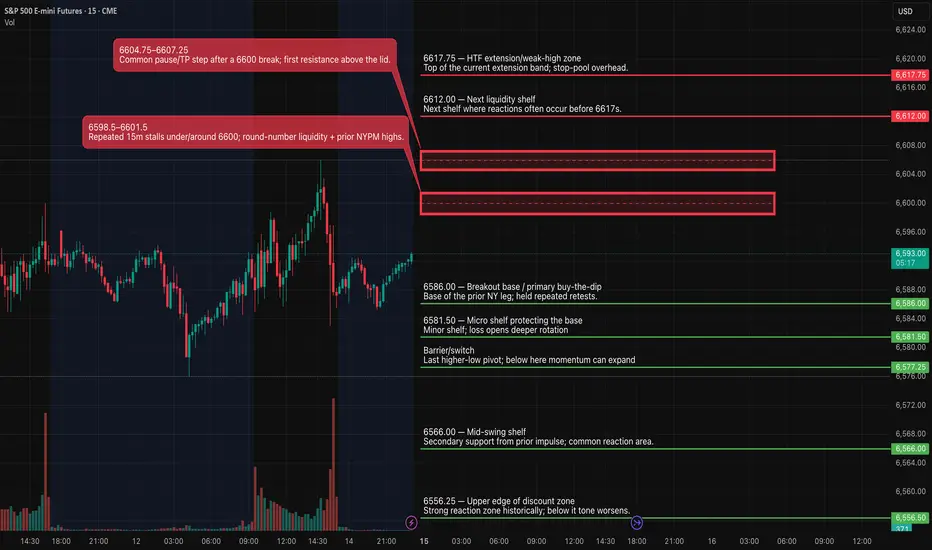
ES (SPX) Futures Analyses for tomorrow Sep 12Overnight
Expect balance 6586–6596 with a modest bullish tilt. If ON accepts >6596.5, drift toward 6603–6606 is likely before NY.
Tomorrow (NY session)
Base case: Early range, then acceptance >6596.5 (close + clean retest) → expansion to 6606 → 6612 → 6616–6619 (HTF extension band).
Failure path: Rejection at 6596–6600 and acceptance <6586 → rotate 6581 → 6577; deeper only if 6577 fails (then 6566/6556).
Fundamentals (times ET)
10:00 — Univ. of Michigan Consumer Sentiment (Prelim, Sep). This is the only major macro print on deck; expect a 2–5m whipsaw around the release, then directional follow-through after displacement.
Today’s context: CPI (Aug) came in +0.4% m/m, +2.9% y/y; Core +0.3% m/m, +3.1% y/y, and Initial Jobless Claims rose to 263k (week ending Sep 6). Together: inflation still sticky but labor softening—into tomorrow this supports “range→up unless 6586 breaks.”
fall in price on es we look to be far overextended and my model shows a growing up side accumulation in laquitity short today

Day 28 S&P Futures | -$78 Trading While Under the WeatherWelcome to Day 28 of Trading Only S&P Futures!
Not my best day — I was feeling under the weather and missed the open. Took a trade at resistance that didn’t work out and left some limit orders higher up at GEX resistance levels. Most of the session I stayed on the sidelines, but my end-of-day orders finally filled and gave me a decent recovery.
Sometimes the best decision when you’re not 100% is to step back and avoid forcing trades.
📰 News Highlights
DOW CLOSES UP OVER 600 POINTS, VIX TUMBLES AS STOCKS END AT RECORD HIGHS AFTER CPI DATA
🔑 Key Levels for Tomorrow
Above 6540 = Remain Bullish
Below 6520 = Flip Bearish

Strategies & Styles in Global TradingPart 1: Foundations of Global Trading Strategies
1.1 Strategic Thinking in Trading
Trading strategies aim to answer three critical questions:
What to trade? (stocks, forex, commodities, indices, crypto, bonds).
When to trade? (entry and exit timing based on analysis).
How much to risk? (position sizing and risk management).
Without a defined strategy, trading becomes speculation driven by emotions.
1.2 Key Influences on Strategy
Global strategies are shaped by:
Market type: Developed (US, EU, Japan) vs. Emerging (India, Brazil, South Africa).
Time horizon: Long-term investments vs. intraday moves.
Information source: Technical analysis, fundamental analysis, quantitative models, or macroeconomic data.
Technology: Algorithmic trading, AI-driven predictions, and blockchain-based platforms.
Part 2: Major Trading Styles
2.1 Day Trading
Definition: Buying and selling within the same day, closing all positions before market close.
Features: Relies on volatility, liquidity, and rapid decision-making.
Tools Used: Intraday charts (1-min, 5-min, 15-min), moving averages, volume profile, momentum indicators.
Global Example: US tech stocks like Tesla or Nvidia are favorite day-trading instruments due to volatility.
Pros: Quick profits, no overnight risk.
Cons: High stress, requires constant monitoring, heavy brokerage costs.
2.2 Swing Trading
Definition: Holding trades for several days or weeks to capture medium-term price swings.
Basis: Combines technical chart patterns with macro/fundamental cues.
Global Example: Trading EUR/USD currency pair during central bank policy cycles.
Pros: Less stressful than day trading, better reward-to-risk ratio.
Cons: Requires patience; risk of overnight news shocks.
2.3 Position Trading
Definition: Long-term strategy, holding positions for months or years.
Basis: Fundamental analysis (earnings, economic cycles, interest rates).
Global Example: Long-term bullish positions in gold as an inflation hedge.
Pros: Less frequent monitoring, aligns with macro trends.
Cons: Requires strong conviction and capital lock-in.
2.4 Scalping
Definition: Ultra-short-term trading strategy, aiming for small profits on many trades.
Basis: Order flow, bid-ask spreads, micro-movements.
Global Example: Forex scalpers trade EUR/USD, GBP/USD due to high liquidity.
Pros: Rapid compounding of profits, no overnight risk.
Cons: High transaction costs, requires lightning-fast execution.
2.5 Algorithmic & Quantitative Trading
Definition: Using computer models, AI, and algorithms to trade automatically.
Methods: Statistical arbitrage, mean reversion, machine learning models.
Global Example: Hedge funds like Renaissance Technologies use quant models to outperform markets.
Pros: Emotion-free, scalable, works 24/7 in multiple markets.
Cons: Requires advanced coding skills, backtesting, and infrastructure.
2.6 High-Frequency Trading (HFT)
Definition: Subset of algorithmic trading using microsecond execution speed.
Basis: Profiting from inefficiencies in order books, arbitrage, spreads.
Global Example: Chicago Mercantile Exchange (CME) futures and US equities.
Pros: Can generate huge volumes of small profits.
Cons: Expensive technology, regulatory scrutiny, highly competitive.
2.7 Event-Driven Trading
Definition: Trading based on news, earnings reports, central bank decisions, or geopolitical events.
Global Example: Buying oil futures after OPEC production cuts; trading GBP during Brexit votes.
Pros: High potential returns.
Cons: High volatility, unpredictable outcomes.
2.8 Arbitrage Strategies
Definition: Profiting from price discrepancies between markets.
Types:
Spatial arbitrage (same asset, different markets).
Triangular arbitrage (currency mismatches).
Merger arbitrage (M&A deals).
Global Example: Simultaneously buying and selling Bitcoin on different exchanges.
Pros: Low-risk if executed correctly.
Cons: Requires speed, capital, and advanced systems.
Part 3: Global Trading Strategies by Asset Class
3.1 Equity Trading Strategies
Value Investing: Buying undervalued stocks (Warren Buffett approach).
Growth Investing: Targeting high-growth sectors like AI or EVs.
Momentum Trading: Riding the wave of strong price trends.
Pairs Trading: Long one stock, short another in the same sector.
3.2 Forex Trading Strategies
Carry Trade: Borrowing in low-interest currency, investing in high-interest currency.
Breakout Trading: Entering positions after a currency breaks key levels.
Range Trading: Buying low, selling high in sideways markets.
News Trading: Trading during central bank announcements or data releases.
3.3 Commodity Trading Strategies
Trend Following: Using moving averages for oil, gold, wheat.
Seasonal Strategies: Trading based on harvests or demand cycles.
Hedging: Producers using futures to lock in prices.
Spread Trading: Buying one commodity and selling another related one (e.g., crude oil vs. heating oil).
3.4 Bond & Fixed Income Trading Strategies
Yield Curve Strategies: Positioning based on steepening or flattening yield curves.
Credit Spread Trading: Exploiting risk premiums between corporate and government bonds.
Duration Hedging: Managing sensitivity to interest rate changes.
3.5 Cryptocurrency Trading Strategies
HODLing: Long-term holding of Bitcoin, Ethereum.
DeFi Yield Farming: Earning interest from decentralized lending protocols.
Arbitrage: Spot vs. futures arbitrage.
Momentum & Volatility Plays: Crypto thrives on extreme price swings.
Part 4: Risk Management & Psychology in Strategies
4.1 Risk Management Tools
Stop-Loss & Take-Profit Orders.
Position Sizing (1–2% capital per trade rule).
Diversification across assets and geographies.
Hedging with options/futures.
4.2 Psychological Styles in Trading
Aggressive vs. Conservative traders.
Discretionary vs. Systematic approaches.
Risk-seeking vs. Risk-averse behaviors.
Trading psychology (discipline, patience, emotion control) often defines whether a strategy succeeds or fails.
Part 5: Regional Differences in Global Trading Styles
US Markets: Heavy focus on tech stocks, options trading, and HFT.
Europe: Strong in forex, bonds, and energy trading.
Asia (Japan, China, India): Retail-dominated, rising algo-trading adoption.
Middle East: Commodity-heavy (oil, petrochemicals).
Africa & Latin America: Emerging markets, currency and commodity-driven.
Part 6: The Future of Global Trading Strategies
AI & Machine Learning: Automated strategies learning from big data.
Blockchain & Tokenization: 24/7 trading, decentralized exchanges.
Sustainable Trading: ESG-based strategies, carbon credits.
Cross-Asset Strategies: Linking equities, commodities, crypto, and derivatives.
Conclusion
Global trading is not just about buying and selling—it is about choosing the right strategy and style that aligns with one’s goals, risk tolerance, and market conditions.
From short-term scalping to long-term investing, from algorithmic arbitrage to macro-driven positioning, traders worldwide adapt strategies to seize opportunities across stocks, currencies, commodities, bonds, and cryptocurrencies.
The winning formula is not a single "best" style—it’s about discipline, adaptability, risk management, and continuous learning. Markets evolve, and so must strategies.
Waiting for CPICPI numbers on Thursday can add to the expectation of future Fed action. The next objective to the upside is 6560.

Sep 10 MES Recap: Watching MAG7, Session Highs/Lows, and Higher MES Journal – September 10, 2025
Today I traded MES using supply and demand levels, while also tracking leadership from the MAG7 (with QQQ as my main proxy).
Track the MAG7 with me on TradingView using the MAG7
List .
I didn’t trade with this strategy until a few guys in my Discord recommended it. I had a bit of a learning curve, but I finished green on most accounts for the first time in a while.
Context I Tracked
Asian session high/low: 6,514 / 6,492
London session high/low: 6,528 / 6,506
Previous day high/low: 6,536.25 / 6,489.25
PPI report (Aug 2025): -0.1% vs forecast, shifted bias from bullish to bearish intraday
VWAP levels on both ES and QQQ
Wins
Stayed green overall on funded accounts with payout potential.
Saw the end-of-day pump confirmed by MAG7, even after an initial retrace.
Reinforced my supply/demand and VWAP process.
Losses and Lessons Learned
Entered one trade without higher timeframe confirmation, which cost me a FundingTicks eval account (treating this loss as tuition).
Learned that higher timeframes (1H/4H/Daily) must confirm intraday levels before entering.
Looking Forward
I’ll combine:
Supply/Demand + Session Highs/Lows
Leader ETF (QQQ/MGK/MAG7)
Higher Timeframes (1H/4H/Daily)
This approach gives me more conviction and fewer blind trades.
Indicators
Since I’m still learning how to mark levels properly, I’m starting out with indicators to help reinforce that I’m using potentially correct levels. I primarily used:
Asian
& London Sessions High/Lows
Previous
Highs & Lows
Supply
and Demand Visible Range
TradingView default VWAP indicator

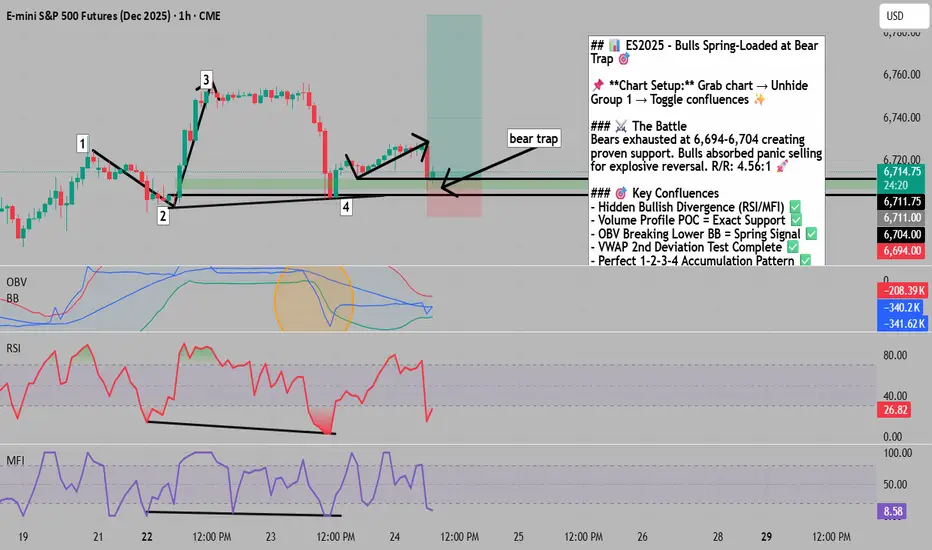
Bulls Spring-Loaded After Bear Trap Test📌 To see my confluences and/or linework, step 1: grab chart, step 2: unhide Group 1 in object tree, step 3: hide and unhide specific confluences. 😊
The Market Participant Battle:
Bears exhausted their ammunition at the 6,694-6,704 support zone (point 4), creating a proven set of market participants that bulls successfully defended. When price closed above the previous high (point 3 above point 1), it confirmed bears were trapped, establishing point 2 as the critical support level. The return to this zone at point 4 triggered a classic spring pattern where bulls absorbed all selling pressure, setting up for an explosive move higher. Smart money appears to be accumulating here while retail bears remain trapped below their stop losses.
Confluences:
Confluence 1: Hidden Bullish Divergence Power Play
The hidden bullish divergence at point 4 is textbook - price printed a higher low while RSI and MFI showed lower lows, screaming institutional accumulation. RSI hit oversold precisely at the bounce point (26.82), confirming maximum pessimism when smart money was buying. The divergence across multiple momentum indicators (RSI, MFI) strengthens the signal exponentially, suggesting bears are fighting a losing battle against algorithmic buying programs.
Confluence 2: Volume Profile & Market Microstructure
The volume profile POC from the major low to point 3 sits exactly at point 4 (6,704 level), acting as a magnetic price attractor. This isn't coincidence - it's where the most contracts changed hands, creating maximum liquidity for institutional players to accumulate. The developing POC support alignment confirms this level as the new value area that market makers will defend aggressively.
Confluence 3: Bollinger Band & OBV Explosion Signal
On-Balance Volume (OBV) breaking below its lower Bollinger Band at point 4 historically precedes violent upward reactions. This extreme reading suggests panic selling into strong hands - the classic transfer from weak to strong participants. Combined with price testing the 2nd standard deviation of VWAP anchored from point 1, we have a triple-loaded spring ready to unleash.
Confluence 4: Mathematical Price Structure
The 1->2->3->4 pattern creates a perfect measured move setup. Point 4's reaction from the proven participant zone (point 2) establishes a risk/reward ratio of 4.56:1 with clear stop placement at 6,694. The mathematical precision of these levels isn't random - it's algorithmic market making at its finest.
Web Research Findings:
- Technical Analysis: S&P currently at 6,713 with strong buying pressure on weekly charts, testing resistance at 6,760. RSI showing negative divergence on daily but oversold on intraday - perfect storm for squeeze higher
- Recent News/Earnings: Q3 earnings estimates revised UP 0.7% (unusual positive revision), with 50% of companies issuing positive guidance vs 43% historical average - bullish fundamental backdrop
- Analyst Sentiment: Technical ratings show "Strong Buy" on weekly/monthly timeframes despite short-term neutral readings - institutions positioning for continuation
- Data Releases & Economic Calendar: Fed cut 25bps on Sept 17 with 2 more cuts expected in 2025, creating liquidity tailwind. Initial jobless claims at 231k (below 241k consensus) shows resilient labor market
- Interest Rate Impact: Fed funds now at 4.00-4.25% with dovish bias. Markets pricing in additional easing through 2026, supportive of risk assets despite inflation concerns
Layman's Summary:
Think of this like a coiled spring that bears just compressed to maximum tension. The Fed is pumping liquidity (rate cuts), companies are beating earnings expectations, and unemployment remains low - all green lights for stocks. The technical setup shows big money quietly buying while retail traders panic sell. When everyone who wanted to sell has sold (point 4), the only direction is up. The VIX at 16.64 shows low fear - perfect for a surprise squeeze higher. Smart money is betting on continuation of the bull market with this classic accumulation pattern.
Machine Derived Information:
- Volume footprint analysis: Buy-side absorption clearly visible at point 4 support - Significance: Institutional accumulation confirmed - AGREES ✔
- Multi-timeframe structure: Support zone respected across 1hr, 4hr, daily timeframes - Significance: Strong technical foundation - AGREES ✔
- Pattern recognition: Clean 1-2-3-4 accumulation schematic with textbook execution - Significance: High probability setup - AGREES ✔
- Fibonacci analysis: 61.8% retracement held perfectly at point 4 - Significance: Mathematical precision confirms support - AGREES ✔
- Indicator confluence dashboard: RSI, MFI, OBV all flash oversold reversal signals - Significance: Multiple confirmations reduce false signal risk - AGREES ✔
- Market profile analysis: High volume nodes acting as price magnets - Significance: Liquidity pools support bullish thesis - AGREES ✔
- Order flow visualization: Aggressive buying visible in footprint charts - Significance: Smart money accumulation pattern - AGREES ✔
Actionable Machine Summary:
All technical analyses unanimously confirm the bullish spring setup. The hidden divergence across RSI/MFI, OBV Bollinger Band break, VWAP 2nd deviation test, volume profile POC support, and clean 1-2-3-4 pattern create an A+ technical setup. The machine analysis shows zero contradictions - every indicator points to the same conclusion: bears are trapped, bulls are loaded, and the spring is about to release violently upward.
Conclusion:
Trade Prediction: SUCCESS ✅
Confidence: HIGH
This is a textbook accumulation pattern with institutional fingerprints all over it. The confluence of hidden bullish divergence, volume profile support, extreme OBV readings, and perfect mathematical structure creates an exceptional risk/reward opportunity. With the Fed maintaining its easing bias, earnings revisions trending positive, and VIX showing complacency, the path of least resistance is clearly higher. The 4.56:1 risk/reward ratio makes this a must-take trade for any serious market participant.
ES - September 24th - Daily Trade PlanBefore reading this trade plan, IF, you did not read yesterdays, or the weekly trade plan take the time to read it first! (You can see both posts in the related publication section)
My trade plan is out later this am due to some family commitments. I will not be highlighting yesterdays, so please read it and review the real-time notes that I posted during the day.
September 24th - 7:30am EST
Overnight session high is 6728 and low is 6711. We have been moving up the levels in a very slow structured way since finding a low yesterday around 6701. Ideally, price will either continue to grind up and retest the 6741-44 area of where we sold off from, or we will need to retest overnight low or yesterday's low to flush and reclaim and move higher to back test the 6741-44 area.
Key Support Levels - 6721, 6715, 6711, 6701
Key Resistance Levels - 6728, 6733, 6741, 6744, 6754
We are in a bit of a holding pattern, unless you have a low time frame entry strategy for a scalp. I personally do not see much to get excited about as price slowly moves higher into some key resistance levels. IF, price loses 6715 and can't reclaim it, then we will probably head lower to retest yesterday's lows. Since I DO NOT SHORT ES, I won't have any good quality setups until we get a pullback. I will be patient and wait for a flush and reclaim of 6711, but 6701 or 6697 would be a much higher quality area.
Make sure you look at yesterday's sell off and plan. I wrote at "1:40pm - I would let price build a base. It could be here at 6710, 6705 or down at 6696. Give it time to build a base with a move lower like this. NO RUSH." We found structure at 6701 and it took us over 2hrs to build a base and chopped everyone around inside that tight 15pt range.
I will post an update around 10am EST.
---------------------------------------------------------------------------------------------------------------------
Couple of things about how I color code my levels.
1. Purple shows the weekly Low
2. Red shows the current overnight session High/Low (time of post)
3. Blue shows the previous day's session Low (also other previous day's lows)
4. Yellow Levels are levels that show support and resistance levels of interest.
5. White shows the trendline from the August lows.
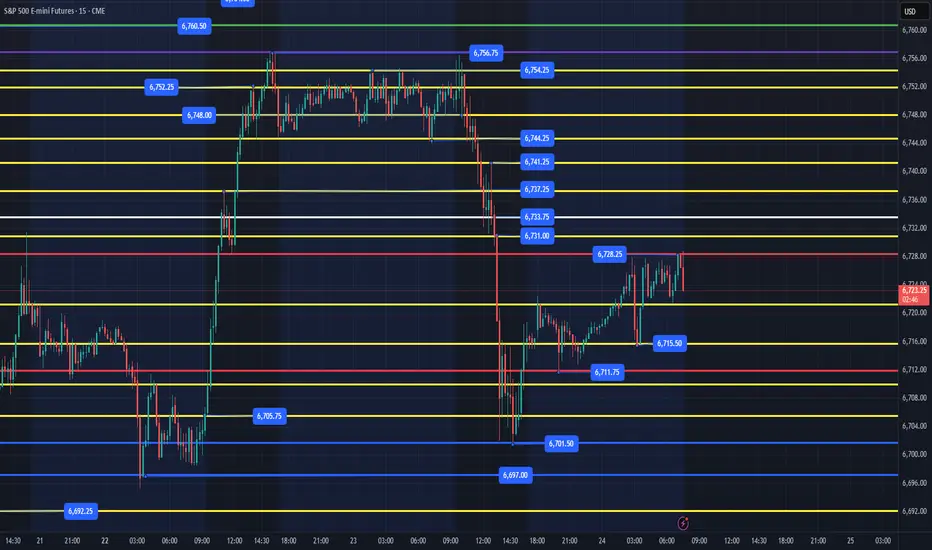
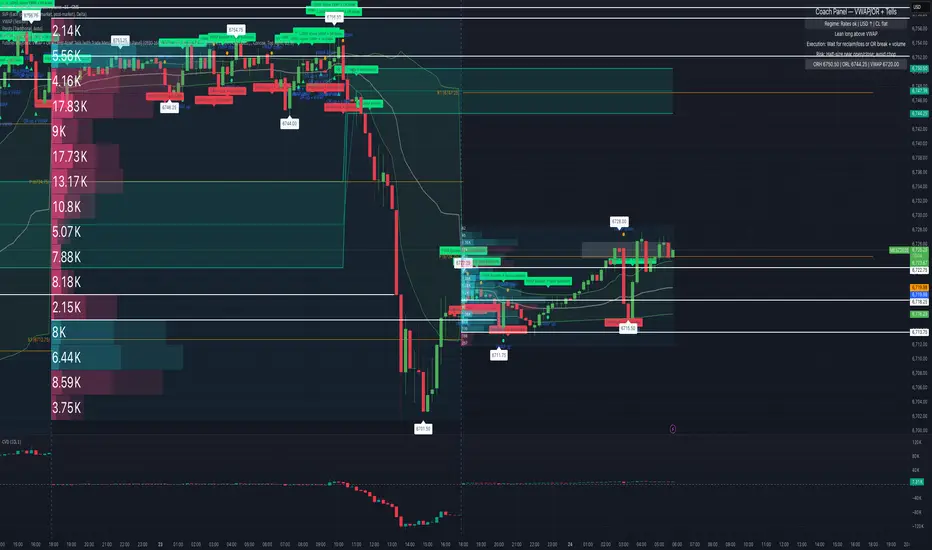
VWAP/OR Setups & Macro Crosscurrents (Sept 24, 2025)The S&P 500 (MES1!) is currently in a volatile state as Wednesday’s trading session commences.
Macro headwinds have dampened expectations for further rate cuts, leading to weakness in Big Tech yesterday. On the other hand, sector tailwinds have emerged, with Micron reporting strong Q4 earnings and Boeing and Palantir forming an AI partnership. These developments have generated after-hours optimism, supporting the performance of semiconductors and AI-related stocks.
This volatile environment presents opportunities for scalpers. The volatility around VWAP/OR levels, coupled with liquidity-driven inflections, creates fertile ground for scalping.
Chart Context (MES1! – 15m & 5m overlays):
VWAP serves as a key pivot point, with multiple reclaims and rejections occurring overnight. The ORH stands at 6720.50, while the ORL is at 6719.75. As of pre-market, the VWAP is also at 6719.75. High-volume nodes at 6710–6722 act as scalp magnet zones. The overnight low at 6701.50 remains the downside inflection point.
Scalping Plan:
- Long bias above VWAP/OR breaks with volume. Target 6728 to 6735+.
- Fade VWAP rejections back to OR. Quick 1–2pt rotations.
- Avoid chop inside VWAP compression.
Risk Management:
- Use half-size into the open; scale only on confirmed breakout.
- Hard stop: sustained trade below 6701.50.
- Event risk: 10:00 AM New Home Sales, 4:10 PM Mary Daly speech.
Takeaway:
Scalpers should focus on reacting to market movements rather than predicting future trends. The ongoing debate between Powell and Micron is likely to lead to whipsaws in the market. Therefore, it’s crucial to adhere to VWAP/OR discipline, respect liquidity pockets, and let the market tape confirm the direction of the trade.