SPX500H2026 trade ideas

Continued absorption and a sideways moveThe expectation for Monday on the daily chart in the S&P 500 is to continue its absorption of fundamental information and a potential sideways market as it does this.

Day 29 — Trading Only S&P Futures | From Red to GreenWelcome to Day 29 of Trading Only S&P Futures!
The day started bearish, and my early shorts worked — until the market began spiking up and flipping bullish. Some of those positions hit stop-loss, so I stepped back and waited.
At 6605 gamma resistance, I shorted again with conviction and rode the reversal back into positive territory, finishing the day at +91.81.
This was a good reminder to not overstay trades when conditions are choppy, and to wait for the high-probability levels to do the heavy lifting.
📰 News Highlights
U.S. SEPTEMBER MICHIGAN 5-YEAR EXPECTED INFLATION RISES 3.9%; EST. 3.4%; PREV. 3.5%
🔑 Key Levels for Tomorrow
Above 6565 = Remain Bullish
Below 6535 = Flip Bearish

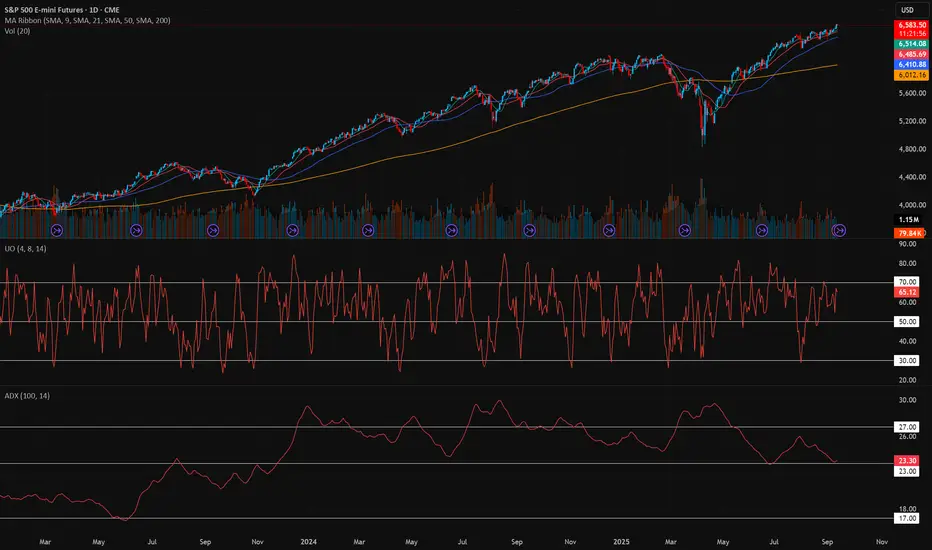
Simple UO + ADX Futures Strategy📚 Trading Plan with UO + ADX + 9/21 MA
1. Indicator Roles
Ultimate Oscillator (UO): Measures momentum across 3 different timeframes (short, medium, long). I use the lengths 4/8/14.
Overbought: > 70
Oversold: < 30
Neutral: 30–70 range
ADX (14-period, 100 smoothed): Measures trend strength, not direction.
Weak trend: < 17~20
Building trend: 20–25
Strong trend: > 27–30, enter on pullback. A bounce from the 9 or 21 MA.
2. Core Trading Logic
We combine momentum (UO) with trend strength (ADX) to avoid false signals.
Long Setup (Buy):
ADX rising above 23 → trend gaining strength.
UO crosses above 30 from below → confirms bullish momentum.
Confirm price is above 21-day MA (optional filter for trend).
📈 Exit:
UO > 50 and turning down, or
ADX below 17, or
Trailing MA.
Short Setup (Sell):
ADX rising above 27 → trend gaining strength.
UO crosses below 70 from above → confirms bearish momentum.
Confirm price is below 9-day MA (optional filter for trend).
📉 Exit:
UO < 30 and turning up, or
ADX drops below 20, or
Trailing stop.
3. Advanced Filters
Avoid false breakouts: If ADX < 20, ignore UO signals (no strong trend).
Divergence filter: If price makes a new high but UO does not → weakening trend.
Scaling:
Add to winners if ADX > 30 and still rising.
Take partial profits if ADX flattens while UO is in extreme zone.
4. Risk Management
Position sizing: Risk 1–2% of account per trade.
Stop loss: Below recent swing low (for longs) or above swing high (for shorts).
Take profit: Risk:Reward 1:2 minimum, or trail with MA.
5. Example Workflow
Case 1 (Bullish):
ADX rises from 18 → 27 (trend forming).
UO crosses 50 → bullish signal.
Enter long.
Exit when UO > 70 and rolls over, or ADX drops < 20.
Case 2 (Bearish):
ADX rises above 25.
UO crosses below 50.
Enter short.
Exit when UO < 30 and turns up, or ADX weakens.
✅ Summary Ruleset
Trade only when ADX > 23–25 (filter out noise).
Go long: UO crosses > 50 with rising ADX.
Go short: UO crosses < 50 with rising ADX.
Exit on momentum extremes (UO < 30 or > 70) or weakening ADX.
Risk: Keep losses capped at 1–2% of equity per trade.
High Expectations!The daily structure in the S&P 500 futures market for Thursday, September 11 indicates high expectations about Fed action next week. Price action for Friday, September 12 is a rest day. This means not a big day up or down without new fundamental information.

Grinding Toward 6,622 and 100% move based off of late 2023 LowHard pressed to see much more upward movement without a significant correction in the cycle. Watching for gaps and increased volatility.

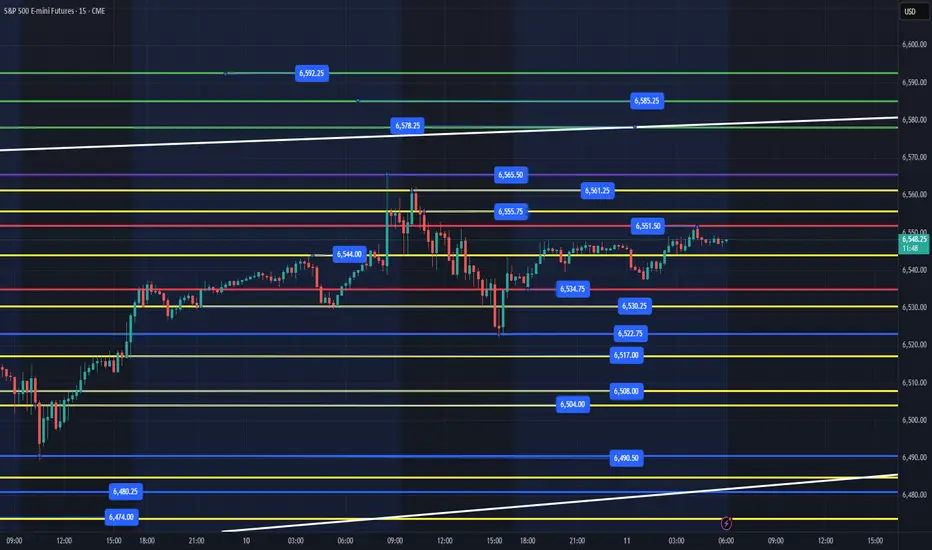
ES - September 11th - Daily Trade PlanSeptember 11th - 5:50am EST
Yesterday, we did not get as much volatility as we have done in the past on economic data release days. Today, we have another with CPI at 8:30am. While we could continue the trend of low volatility, today I am still going to be cautious. Before I get into today's plan, take a minute to read my daily trade plan from yesterday. (See Related Publication Section)
I stated in the plan "Any flush of 6526 and reclaim should be a good level for a move higher. We could see price sell off all the way down to the white trend line around 6474 area, flush and then recover a level in blue to continue higher."
After the initial pop from the PPI release, we opened up battled between 6545-6562, then grinded lower after many attempts to lose 6545. I said, yesterday in my 10:29am Note:
"Price can still go higher, but any loss of 6545 would not be good and could flush lower. See my updates above on places I like for us to flush and reclaim at lower levels. 6526 being first for some points, maybe even getting as low as 6517 and reclaiming 6526."
At 3:20pm we touched the 6522 level and rallied up to 6543 into the close for a nice 20pt pop. While I was actually off my desk for this move, it shows you that with patience and waiting for the high-quality setups, you will be rewarded.
------------------------------------------------------------------------------------------------------------------
What is the plan for today? 8:30am, we have a big data report. I will not be trading before the report and will be waiting on price to settle out after the NYSE open. That is one of my rules on data & volatility events.
Overnight low is 6534 and high is 6551 as of writing. We have to remain bullish until proven otherwise, so the targets above at 6567, 6578 and if it really wants it can get to 6592. I have said that the white trend line is a magnet that we are heading towards. We just don't know what route price will take to achieve its targets. We focus on our process and edge to take points out of the market daily.
Key Support Levels - 6545, 6534, 6530, 6522, 6523, 6517, 6504-08, 6490, 6480
Key Resistance Levels - 6551, 6555, 6565, 6578, 6592
After the CPI release and by 9am, we should have a good sense for what price is looking to do. Any flush of 6534 or even better 6222 (maybe as low as 6517) and reclaim should be a good level for a move higher. We could see price sell off all the way down to the white trend line around 6480 area, flush and then recover a level in blue to continue higher.
IF, price does flush 6490 and we are accelerating into it, I would be patient and wait to see what it does. While yesterday we flushed, recovered for a nice 50 point move higher, we might get a nice bounce, but liquidity continues to be taken each time we visit this level and when we do lose the level, I anticipate a multi-level loss.
IF, price can flush and reclaim the red or blue levels, those are always my highest quality spots I am looking to ride higher. The yellow levels are very important support and resistance levels that you can get reclaims of and move higher. They can also be choppy and harder to enter without a short time frame edge for entry. It is all based on your strategy, goals and edge of getting points from ES.
Size down today, price could lose 100+pts or run 100+pts higher. Do not be a hero. Wait for your levels and edge to enter and make sure you take profits at the next level higher.
I will post updates after CPI and around 10am after NYSE has settled out.
-----------------------------------------------------------------------------------------------------------------
Couple of things about how I color code my levels.
1. Purple shows the weekly High/Low
2. Red shows the current overnight session High/Low (time of post)
3. Blue shows the previous day's session Low (also other previous day's lows)
4. Yellow Levels are levels that show support and resistance levels of interest.
5. White shows the trendline from the August lows.
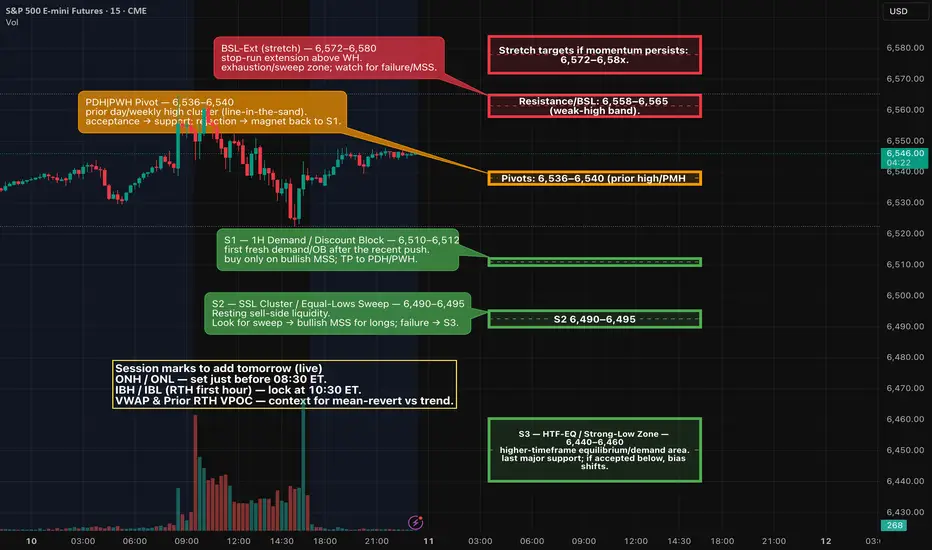
ES (SPX) Analyses for Thu, Sep 11 (CPI day)What matters tomorrow (fundamentals)
CPI (Aug) at 8:30 ET — the BLS schedule shows the August CPI release Thu Sep 11, 08:30 ET. This is the day’s primary driver.
Weekly Initial Jobless Claims at 8:30 ET — standard Thursday release; calendars show the event scheduled for Sep 11 at 08:30 ET.
Treasury 30-yr bond auction — $22B long-bond sale Thursday (typically 13:00 ET). This can move yields into the NY afternoon and spill into equities.
Context into the print: PPI (Aug) was released today (Sep 10); YoY +2.6% per data trackers/BLS release, keeping focus on CPI for confirmation. Markets are leaning toward a Fed cut at next week’s meeting.
I’m using your 1D / 4H / 1H.
Trend: Uptrend intact on 1D; price sits just beneath a “weak-high / premium” supply band. (1D shows fib extensions near ~6705 (1.272) and ~6799 (1.618) as far targets, not base-case for tomorrow.)
4H: Recent push into a red supply band then pullback; mid-range equilibrium roughly ~6,44x–6,45x.
1H: Resistance zone ~6,558–6,565 (your “Weak High” band). Prior highs around ~6,536–6,540 act as local pivot/PMH; below that, demand/discount blocks stack ~6,50x → 6,46x–6,44x.
Scenario A — Disinflationary/soft CPI (yields down)
Likely path: Early sell-side sweep into 6,51x → 6,49x discount → bullish MSS.
Entry: Buy the 1–5m PD-array in discount after displacement.
Targets: 6,536–6,540 → 6,558–6,565 (weak-high). Leave runner toward 6,57x–6,58x only if order-flow stays bid.
Invalidation: 1–5m structure loses 6,49x and cannot reclaim.
Scenario B — Hot CPI (yields up)
Likely path: Buy-side sweep through 6,558–6,565 → failure → bearish MSS back below the band.
Entry: Short premium PD-array after displacement down.
Targets: 6,536–6,540 → 6,51x, stretch 6,49x then 6,46x–6,44x if momentum accelerates.
Invalidation: Acceptance back above 6,565 with bullish structure.
Projections:
ES futures are anticipated to respond within a 5-15 minute window following the 8:30 AM release, with intraday movements likely intensified by algorithmic trading and stop-hunting activities. Historical analysis of the past 6 CPI events indicates an average end-of-day ES move of approximately +0.76% in response to ±0.1% deviations from forecasts. The prevailing volatility suggests that implied moves, derived from options data, are forecasting a swing of around 0.5-1% (equivalent to ±30-60 points from current levels), though actual market responses have been known to exceed these expectations in the event of surprises.
In the pre-release phase, spanning overnight to pre-market hours (approximately 4:00-9:30 AM ET), market participants are likely to observe a consolidation or mild upward bias within a range of 6480-6575, building upon today’s record highs. The light trading volume may lead to false breakouts around critical levels. Traders are currently positioning for a "failed breakdown" pattern, wherein an initial dip below recent lows could trigger stop-loss orders, followed by a swift reversal higher if market sentiment remains intact.
As the clock strikes 8:30 AM ET, high volatility is expected, with the potential for a 20-40 point gap open or sharp spike. A common occurrence is an initial downside flush aimed at testing liquidity (for instance, dipping below 6500) before a definitive market direction is established. Whipsaw action is likely as news headlines emerge, with particular focus on the core CPI data, which will be pivotal for determining sustained market trends.
Good Luck Everyone!
Day 27 — Trading Only S&P Futures | 20pt Win & Bottom CatchWelcome to Day 27 of Trading Only S&P Futures!
Started the day red due to overnight trades, but once the session opened, everything lined up perfectly. I waited for resistance after spotting multiple X7 sell signals, shorted the top, and caught a 20-point move down to MOB. From there, I flipped long, and later caught the market bottom with the help of Bia’s analysis.
The result? A smooth +385 day — clean reads, clean execution.
📰 News Highlights
S&P 500, NASDAQ eke out record closing highs after tame PPI inflation data
🔑 Key Levels for Tomorrow
Above 6515 = Remain Bullish
Below 6500 = Flip Bearish

Sep 10 MES Recap: Watching MAG7, Session Highs/Lows, and Higher MES Journal – September 10, 2025
Today I traded MES using supply and demand levels, while also tracking leadership from the MAG7 (with QQQ as my main proxy).
Track the MAG7 with me on TradingView using the MAG7
List .
I didn’t trade with this strategy until a few guys in my Discord recommended it. I had a bit of a learning curve, but I finished green on most accounts for the first time in a while.
Context I Tracked
Asian session high/low: 6,514 / 6,492
London session high/low: 6,528 / 6,506
Previous day high/low: 6,536.25 / 6,489.25
PPI report (Aug 2025): -0.1% vs forecast, shifted bias from bullish to bearish intraday
VWAP levels on both ES and QQQ
Wins
Stayed green overall on funded accounts with payout potential.
Saw the end-of-day pump confirmed by MAG7, even after an initial retrace.
Reinforced my supply/demand and VWAP process.
Losses and Lessons Learned
Entered one trade without higher timeframe confirmation, which cost me a FundingTicks eval account (treating this loss as tuition).
Learned that higher timeframes (1H/4H/Daily) must confirm intraday levels before entering.
Looking Forward
I’ll combine:
Supply/Demand + Session Highs/Lows
Leader ETF (QQQ/MGK/MAG7)
Higher Timeframes (1H/4H/Daily)
This approach gives me more conviction and fewer blind trades.
Indicators
Since I’m still learning how to mark levels properly, I’m starting out with indicators to help reinforce that I’m using potentially correct levels. I primarily used:
Asian
& London Sessions High/Lows
Previous
Highs & Lows
Supply
and Demand Visible Range
TradingView default VWAP indicator

ID: 2025 - 0158.1.2025
Trade #15 of 2025 executed.
Trade entry at 140 DTE (days to expiration).
Excellent fills this morning, well under mid. Created a GTC working order two days ago and let price come to me. No chasing. There are TONS of external liquidity voids resting below.
Target profit is 5% ROI
Happy Trading!
-kevin

ES Supply And demand Break-Out Buy SignalTrading News:
- PPI (Producer Price Manufacturing Index) came out -0.1% vs its 0.3% forecasted number, suggesting lower cost of manufacturing and inflation.
ES:
- Stocks caught a bid from this number as investors use this as a "lock" for FED rate cuts and a higher chance for a 2nd cut before the end of the year.
- Over the last 6 months, when the price is expected to open above yesterday's high, the price has a 74% chance of pulling back and hitting yesterday's high. This gives traders an idea for a possible open short OR wait for a pullback back into the previous ATH/Support level and wait for confirmation.
- Over the last 6 months, if the first 1hr of the NY session is "green" then 75% of the time price will close green for the day. The same is true for the first 1hr candle of the NY session is "red" then 75% chance of day being red.
- Over the last 6 months, Wednesdays have held the highest chance of a "green day", sitting at 69% chance.
- Overall, I remain bullish on this market and would not consider shorting this market at this point—aggressive RB break-out level around the 6540 level on the 5-minute TF. Traders can also wait for price to pullback to this level and wait for confirmation.

ID: 2025 - 0199.9.2025
Trade #19 of 2025
Entry at 164 DTE
Adding to the overall portfolio to help balance delta in anticipation of a market pullback.
Working GTC orders for take profit in 30-60 DIT.
Happy Trading!
-kevin

ES - September 10th - Daily Trade Plan September 10th - 5:45am EST -
Volatility should arrive with PPI & CPI today and tomorrow. I will not go into too much detail about my trade plan yesterday as you can read it under the (Related Publication Section). A couple of highlights, 6493 & 6505-08 have been 2 key levels so far this week. Why? Institutions have been buying at these levels and price has kept moving higher. As you know by now, my edge is buying after the Institutions and riding the wave higher. I do NOT short ES as I wait for short squeezes as a safer way to enter and ride the waves up in bull/bear markets. The past couple of days have been pretty boring price action. We have chopped retail investors up all week as price has ping ponged back and forth between my levels, but more importantly between 6493-6523. We finally broke out overnight and hit our first target of the week, which was also last week's high at 6544.
What is the plan for today? 8:30am, we have a big data report. I will not be trading before the report and will be waiting on price to settle out after the NYSE open. That is one of my rules on data & volatility events.
Overnight low was 6526 with the high being 6544. We have to remain bullish until proven otherwise, so the targets in green above are still in play this week. How do we get to those targets? Ideally, we get a big flush, scare retail traders, let them pile in short, flip the script, short squeeze and ride higher. If you have been trading ES for any length of time you know that if price is flushing, you get out the way. Do not be a hero and try to pick when price will reverse. Identify levels that have high probabilities, watch the reaction at that level, then enter based on your edge.
Key Support Levels - 6530, 6526, 6523, 6517, 6504-08, 6490
Key Resistance Levels - 6544, 6549, 6555, 6562, 6578+
The white trend line is the magnet above that I believe we are heading for at some point this week or into the Fed meeting next week.
After the PPI release and by 9am, we should have a good sense for what price is looking to do. Any flush of 6526 and reclaim should be a good level for a move higher. We could see price sell off all the way down to the white trend line around 6474 area, flush and then recover a level in blue to continue higher.
IF, price does flush 6490 and we are accelerating into it, I would be patient and wait to see what it does. While yesterday we flushed, recovered for a nice 50 point move higher, we might get a nice bounce, but liquidity continues to be taken each time we visit this level and when we do lose the level, I anticipate a multi-level loss.
IF, price can flush and reclaim the red or blue levels, those are always my highest quality spots I am looking to ride higher. The yellow levels are very important support and resistance levels that you can get reclaims of and move higher. They can also be choppy and harder to enter without a short time frame edge for entry. It is all based on your strategy, goals and edge of getting points from ES.
Size down today, price could lose 100+pts or run 100+pts higher. Do not be a hero. Wait for your levels and edge to enter and make sure you take profits at the next level higher.
I will post updates after PPI and around 10am after NYSE has settled out.
-----------------------------------------------------------------------------------------------------------------
Couple of things about how I color code my levels.
1. Purple shows the weekly High/Low
2. Red shows the current overnight session High/Low (time of post)
3. Blue shows the previous day's session Low (also other previous day's lows)
4. Yellow Levels are levels that show support and resistance levels of interest.
5. White shows the trendline from the August lows.

ESG Investing & Green FinancePart I: Understanding ESG Investing
1. What is ESG?
ESG stands for Environmental, Social, and Governance. It is a framework used by investors to evaluate companies not just on financial performance, but also on how they manage sustainability, ethics, and accountability.
Environmental (E): Measures a company’s impact on the planet—carbon emissions, energy use, waste management, renewable energy adoption, water conservation, pollution control, etc.
Social (S): Assesses how a company treats people—its employees, customers, suppliers, and communities. Issues like labor rights, workplace diversity, data privacy, and community engagement fall here.
Governance (G): Evaluates how a company is managed—board diversity, executive pay, shareholder rights, transparency, anti-corruption policies, etc.
2. Origins of ESG Investing
The roots of ESG investing can be traced back to:
1960s–1970s: Socially Responsible Investing (SRI) emerged. Religious groups and ethical investors avoided companies linked to alcohol, tobacco, gambling, and weapons.
1980s–1990s: Activist investors started pressuring firms on issues like apartheid in South Africa. Many divested from companies operating there.
2000s: Climate change awareness grew, leading to greater focus on corporate environmental performance.
2015 onwards: The Paris Agreement, UN Sustainable Development Goals (SDGs), and growing public concern about climate change propelled ESG to mainstream finance.
3. ESG Investing vs. Traditional Investing
Aspect Traditional Investing ESG Investing
Focus Profit, ROI, growth Profit + sustainability + ethics
Metrics EPS, P/E ratio, ROE ESG scores + financial metrics
Time Horizon Short-to-medium term Long-term resilience
Risk Market risk, credit risk Market + climate + reputational risks
Part II: Key Drivers of ESG Investing
Climate Change and Sustainability Concerns
Rising global temperatures, extreme weather, and natural disasters highlight the risks of ignoring climate change.
Companies that fail to adapt may face legal, regulatory, and reputational risks.
Investor Demand
Millennials and Gen Z, who are more socially conscious, prefer investing in sustainable companies.
ESG-focused mutual funds and ETFs have seen record inflows.
Regulatory Pressure
Governments are mandating climate disclosures. For example, the EU’s Sustainable Finance Disclosure Regulation (SFDR) requires funds to disclose ESG risks.
Corporate Performance Data
Studies show that ESG-aligned companies often outperform peers in the long run due to lower risks, better brand image, and operational efficiency.
Part III: ESG Metrics and Ratings
1. ESG Rating Agencies
Several organizations provide ESG scores to companies, including:
MSCI ESG Ratings
Sustainalytics
Refinitiv
Bloomberg ESG Scores
Each agency uses different criteria, making ESG ratings inconsistent at times. For example, Tesla scores high on environment due to EV leadership, but lower on governance issues.
2. Key Metrics
Carbon emissions (CO2e per unit revenue)
Percentage of renewable energy use
Diversity of board and management
Employee turnover and satisfaction
Transparency in financial reporting
Part IV: Green Finance
1. What is Green Finance?
Green finance refers to financial activities, investments, and instruments specifically designed to support environmentally sustainable projects. Unlike ESG, which is broad, green finance is narrower and directly focused on environmental impact.
Examples include:
Green Bonds (funds raised for renewable energy, clean transport, or sustainable water projects).
Climate Funds (investments in climate change mitigation/adaptation).
Sustainable Loans (corporate loans linked to sustainability targets).
2. Evolution of Green Finance
2007: The European Investment Bank issued the first green bond.
2015: The Paris Climate Agreement boosted funding for green projects.
Today: Green finance is a $2 trillion+ market, with rapid growth in Asia, Europe, and North America.
3. Green Finance vs. ESG Investing
Aspect Green Finance ESG Investing
Scope Narrow (environmental projects only) Broad (environment, social, governance)
Instruments Green bonds, loans, climate funds ESG funds, ETFs, stocks
Purpose Financing climate-friendly initiatives Screening and investing in sustainable companies
Part V: Examples and Case Studies
1. Tesla Inc. (Environment & Social Impact)
Pros: Market leader in EVs, promotes clean energy, reduces carbon dependency.
Cons: Criticism on governance (CEO dominance, workplace safety, and labor issues).
2. Unilever (ESG Leader)
Pioneered Sustainable Living Brands initiative.
Invested heavily in eco-friendly packaging, supply chain ethics, and community programs.
3. Apple Inc.
Committed to becoming carbon neutral by 2030.
Invests in renewable energy for data centers and supply chain sustainability.
4. Green Bonds by Governments
India: Issued sovereign green bonds to finance solar and wind energy.
China: One of the largest issuers of green bonds globally.
EU: Launched “NextGenerationEU” recovery fund with a strong green finance focus.
Part VI: Benefits of ESG & Green Finance
Risk Mitigation – Companies with strong ESG practices face fewer legal and reputational risks.
Long-Term Value Creation – Sustainable companies build resilience against climate and market shocks.
Better Investor Returns – ESG funds often outperform benchmarks over long horizons.
Positive Brand Image – Firms adopting ESG gain consumer trust and loyalty.
Access to Capital – Green finance instruments often come with lower borrowing costs.
Conclusion
ESG investing and green finance are not just trends—they are reshaping global financial markets. By embedding environmental, social, and governance considerations into investment decisions, stakeholders can drive capital towards sustainable and ethical businesses.
While challenges like greenwashing and lack of standardization remain, the direction is clear: the future of finance will be green, responsible, and impact-driven.
Investors, policymakers, and companies who embrace this shift early are likely to reap long-term benefits—not just in profits, but in contributing to a more sustainable planet.

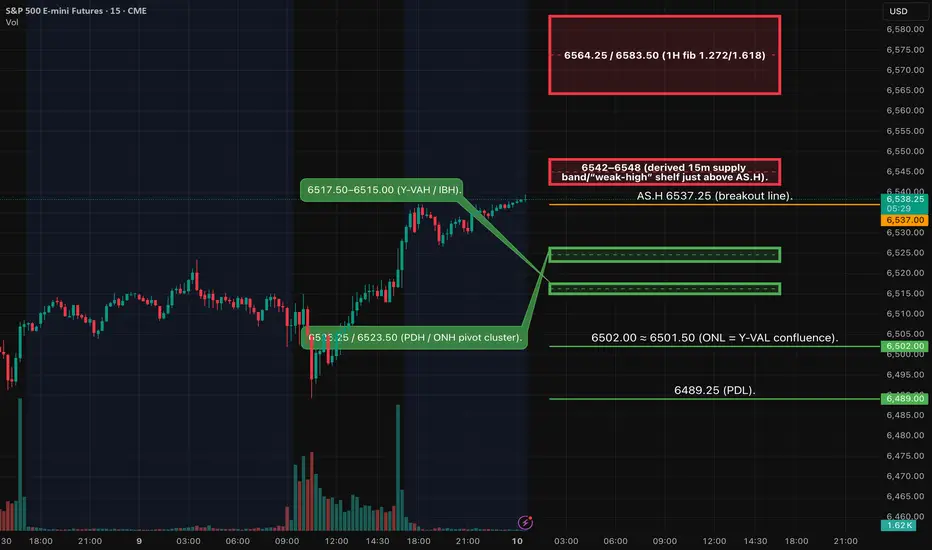
ES1! — Analyses (Sep 10) - Key Zones SeyupsHTF remains bullish into a labeled weak‑high cluster. Tomorrow’s path likely pivots around 6523–6527 (ONH/PDH cluster). Two A++ plays only after event‑led volatility prints structure:
Two possibilities:
Continuation LONG on acceptance > 6537 → 6564/6583.
Fade SHORT on sweep into 6542–6548 + 5m and 15m bearish confirmation → 6526/6510/6502.
SMT check with NQ is required.
Continuation LONG (A++) — “Acceptance > 6537”
Sweep → 5m MSS up → 5m close above 6537 → retest 6531–6533 (derived 5m OB/FVG at prior close shelf) for entry.
Entry: 6532 ±1.
SL: 6524 (structure; back inside PDH/ONH cluster).
• TP1: 6564.25 (1H 1.272) → ~+32.3 pts ≈ 4.0R.
• TP2: 6583.50 (1H 1.618) → ~+51.5 pts ≈ 6.4R.
• TP3: 6668+ (4H fib region) — runner; trail by 15m/30m closes.
Management: Scale ½ at TP1; move to BE only after a 5m close through TP1 or new structure; time‑stop 45–60 min if no progress in a kill zone.
Fade SHORT (A++) — “Sweep 6542–6548”
This is counter‑HTF; require 5m MSS down + 15m bearish close before entry (your rule).
Entry: 6545 ±2 after confirmations.
SL: 6552 (above sweep high/5m OB).
• TP1: 6526.25 (PDH/ONH) → ~19 pts ≈ 2.7R.
• TP2: 6510 (derived 15m demand near VWAP band) → ~35 pts ≈ 5.0R.
• TP3: 6502 (ONL=VAL) → ~43 pts ≈ 6.1R.
• TP4: 6489.25 (PDL) → ~56 pts ≈ 8.0R.
Management: Scale ½ at TP1; move to BE only after a 5m close < 6526 and fresh LTF structure; trail above last 5m swing/VWAP.
Fundamentals (tomorrow — Eastern Time)
• 08:30 — PPI (Aug). BLS schedule confirms Sep 10 @ 08:30.
• 10:30 — EIA Weekly Petroleum Status (energy vol shock risk). Standard release Wednesdays 10:30; PDF posts after 1:00 pm.
• 13:00 — UST 10‑yr (reopening). Treasury’s tentative auction schedule shows Wed Sep 10; competitive close customarily 1:00 pm ET.
• Heads‑up (Thu): 08:30 — CPI (Aug) next day.
• FOMC next week: Sep 16–17.
Day 26 — Trading Only S&P Futures | BLS Revision TradeToday’s session lined up perfectly with the news. I came in prepared, knowing the BLS jobs revision was coming, and expected the number to print bigger than forecast.
As the market opened, structure flipped bearish and we started trending down. I shorted resistance levels and traded the 1-min MOB for easy profits once the data came out — which confirmed the trade idea. Ended the day with +300.02.
📰 News Highlights
US 2025 BLS Payrolls revision: -911K jobs, biggest downward revision on record
🔑 Key Levels for Tomorrow
Above 6480 = Remain Bullish
Below 6465 = Flip Bearish
This is also one of the first weeks i am testing copytrading apps that allow me to trade 5-10 accounts at once and it just follows the first account.
But I set my other accounts with bigger drawdowns to trade 3x the leader account test test how things work and i have 1 account that locks out after $150s because based on my study, if i lock out after $150, i will have a high success rate for the month.
All of this is only possible after i tested run myself and my strategy where I am trading like a turtle and making sure I can trade for a full month with 70% + win rate and achieve consistency without blowing up the account.
Once that was achieve, I can use any copy trading app to multiple my $200/day trades into 1000 by having all my other account follow my leader account.
But don't rush to do this until you are successful.
Remember to WALK, before you run.

Continued movement to the upsideThe daily structure of the S&P 500 implies continued movement to the upside. The next objective would be 6540.

Head and shoulders formation?Possible head and shoulders forming, could make a break to the downside.

How to Use Moving Averages in TradingViewMaster moving averages using TradingView's charting tools in this comprehensive tutorial from Optimus Futures.
Moving averages are among the most versatile technical analysis tools available, helping traders analyze trends, identify overbought/oversold conditions, and create tradeable support and resistance levels.
What You'll Learn:
Understanding moving averages: lagging indicators with multiple applications
Simple moving average basics: calculating price averages over set periods
Key configuration choices: lookback periods, price inputs, and timeframes
How to select optimal lookback periods (like 200-day) for different trading styles
Using different price inputs: close, open, high, or low prices
Applying moving averages across all timeframes from daily to 5-minute charts
Analyzing price relative to moving averages for trend identification
Using 50-day and 200-day moving averages for trend analysis on E-Mini S&P 500
Mean reversion trading: how price tends to return to moving averages
Trend direction analysis using moving average slopes
Famous crossover signals: "Death Cross" and "Golden Cross" explained
Trading moving averages as dynamic support and resistance levels
Advanced moving average types: weighted and exponential moving averages
Applying moving averages to other indicators like MACD and Stochastics
Balancing sensitivity vs. noise when choosing periods
This tutorial may benefit futures traders, swing traders, and technical analysts who want to incorporate moving averages into their trading strategies.
The concepts covered could help you identify trend direction, potential reversal points, and dynamic trading levels across multiple timeframes.
Learn more about futures trading with TradingView:
optimusfutures.com
Disclaimer:
There is a substantial risk of loss in futures trading. Past performance is not indicative of future results. Please trade only with risk capital. We are not responsible for any third-party links, comments, or content shared on TradingView. Any opinions, links, or messages posted by users on TradingView do not represent our views or recommendations. Please exercise your own judgment and due diligence when engaging with any external content or user commentary.
This video represents the opinion of Optimus Futures and is intended for educational purposes only. Chart interpretations are presented solely to illustrate objective technical concepts and should not be viewed as predictive of future market behavior. In our opinion, charts are analytical tools—not forecasting

ES - Week 37a small 1hr distribution trend is forming and price is lingering under last months high.
lets see which levels form this week and practice procedural analysis.
What is on the chart is comparative analysis. Comparing what has happened in the past with current price structures.
T.A - Technical Analysis in 4 parts
M.A. - Mental Analysis
C.A. - Comparative Analysis
R.A - Risk Analysis
P.A. - Procedural Analysis

ES - September 9th - Daily Trade PlanSeptember 9th - 5:45am EST - Daily Trade Plan
Yesterday, I did not make a trade. I was waiting on price to flush a lower level and all we got in the afternoon was the 6493 level that was the 2am low and produced a low-quality setup based on my edge. When we are trading in such narrow ranges, it can be difficult to not get chopped around and my edge is focused on flushing high quality levels, reclaim and then enter after and ride up with the institutions. You can see that Institutions were buying yesterday and holding the 6493 level all day. I stated in my updated note at 11am - "Price broke above the overnight high and is testing the 6517 resistance." (We never got a back test that I could enter long) Any pullback needs to hold the 6508 level." Price didn't hold but also didn't flush lower than 6493.
I only mention this because this is what patient, disciplined trading looks like. FOMO is what will end your trading career. Do I want to trade and make money each day? Of course, but I have to be disciplined to wait for the best entries and not gamble all day long.
Now onto today! The overnight low was 6504 and high is 6523. We have been grinding higher since the Friday low. Any pullback will be health for this structure to continue higher. It cannot keep grinding higher and I am anticipating a pull back to keep us moving up the levels. Which levels should we be looking to engage in?
Key Support Levels - 6504-08, 6493, 6480, 6474, 6464, 6453 - Below Friday's low, I would wait for a level below to build a base around and reclaim.
Key Resistance Levels - 6517, 6523, 6531, 6542
The overnight low of 6504 is first level down to flush and recover and grab some points. Since the 6493 level has tested 3x yesterday, I don't think we will have much left in the tank, and I would expect price to flush a couple of levels. Waiting on 6493 to be reclaimed is the safest spot to enter. Everything between 6506-6516 is pure chop and will fake you out both directions. Be patient and wait for a flush of a level in red or blue and then the reclaim of that immediate level.
I will post an update around 10am EST.

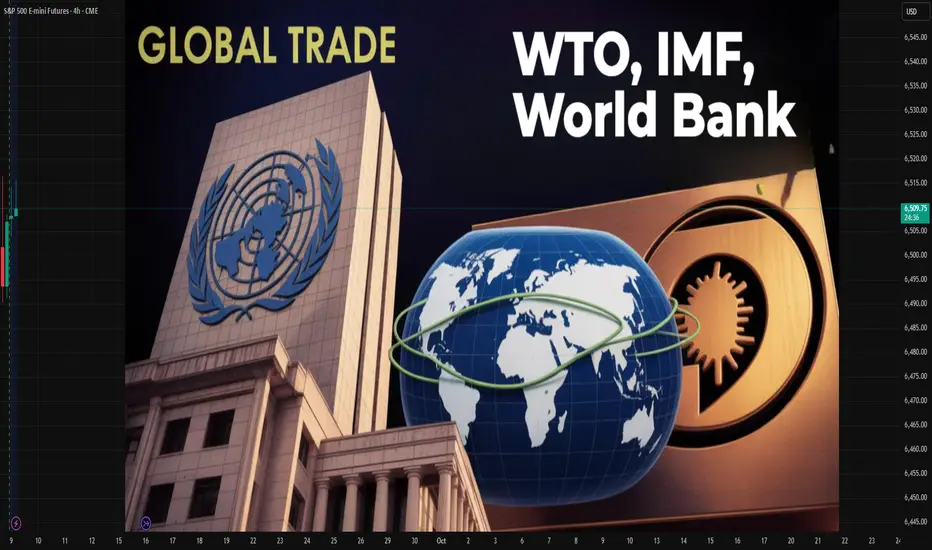
WTO, IMF, and World Bank in Global Trading1. Historical Background of Global Trade Institutions
1.1 The Bretton Woods Conference (1944)
In the aftermath of World War II, world leaders recognized the need for a stable international economic order.
The Bretton Woods Conference, held in New Hampshire, USA, in 1944, gave birth to two major institutions: the IMF and the World Bank.
Their purpose was to rebuild war-torn economies, stabilize currencies, and finance reconstruction.
1.2 The General Agreement on Tariffs and Trade (GATT) and WTO
In 1947, the General Agreement on Tariffs and Trade (GATT) was established to reduce tariffs and encourage trade liberalization.
GATT evolved over decades and was eventually replaced by the World Trade Organization (WTO) in 1995, which took on broader responsibilities in managing international trade rules.
Thus, the global economic framework today rests on three pillars: WTO (trade rules), IMF (financial stability), and World Bank (development financing).
2. World Trade Organization (WTO)
2.1 What is the WTO?
The WTO is the only global organization dealing with the rules of trade between nations. With over 160 member countries, it regulates trade agreements, monitors compliance, and settles disputes.
2.2 Core Objectives
Trade Liberalization – Reduce tariffs, quotas, and other barriers.
Predictability – Ensure stable trade policies through binding commitments.
Non-Discrimination – “Most-Favored Nation” (MFN) treatment, ensuring countries don’t discriminate among trade partners.
Fair Competition – Prevent unfair practices like dumping or subsidies.
Development – Provide special provisions for developing and least-developed countries.
2.3 WTO Functions in Global Trade
Negotiation Forum: Members negotiate trade deals (e.g., Doha Round).
Implementation and Monitoring: Ensures countries comply with trade agreements.
Dispute Settlement: Provides a legal framework to resolve trade conflicts.
Capacity Building: Assists developing nations with trade knowledge.
2.4 Impact of WTO on Global Trade
Dramatic reduction in average tariffs (from >30% in 1947 to <5% today).
Expansion of world trade, allowing developing countries like China, India, and Brazil to emerge as major players.
Legal dispute resolution prevents trade wars and supports stability.
2.5 Criticisms of WTO
Seen as favoring developed nations with stronger bargaining power.
Negotiation rounds often stall due to conflicting interests.
Critics argue WTO undermines national sovereignty by enforcing global rules.
3. International Monetary Fund (IMF)
3.1 What is the IMF?
The IMF is a global financial institution headquartered in Washington, D.C., with 190+ member countries. It ensures the stability of the international monetary system—exchange rates, payments, and cross-border capital flows.
3.2 Objectives of IMF
Exchange Rate Stability – Prevent currency crises and competitive devaluations.
Balance of Payments Assistance – Provide short-term loans to countries in crisis.
Policy Surveillance – Monitor global economic trends and provide policy advice.
Capacity Development – Offer training to strengthen economic institutions.
3.3 Functions in Global Trade
Financing Trade Deficits: Countries with shortages of foreign currency can borrow from IMF to finance imports.
Crisis Management: Provides emergency support during global shocks (e.g., Asian Financial Crisis 1997, Eurozone crisis, COVID-19 pandemic).
Exchange Rate Stability: Prevents destabilizing fluctuations that could disrupt trade.
Confidence Building: By backing countries with funds, IMF assures trading partners of stability.
3.4 IMF Tools
Lending Programs: Stand-By Arrangements, Extended Fund Facility, and Rapid Financing Instrument.
Special Drawing Rights (SDRs): International reserve asset to boost global liquidity.
Surveillance Reports: The World Economic Outlook and Global Financial Stability Report.
3.5 Impact of IMF on Global Trade
Prevents collapse of trade flows by ensuring liquidity.
Encourages trade-oriented reforms in developing countries.
Enhances investor confidence by stabilizing economies.
3.6 Criticisms of IMF
Conditionality: Loans often come with austerity measures, criticized for worsening poverty.
Western Dominance: Voting rights favor developed nations, especially the U.S. and Europe.
One-Size-Fits-All Policies: Structural adjustment programs have been criticized for imposing uniform economic models.
4. World Bank
4.1 What is the World Bank?
The World Bank Group (WBG) is a collection of five institutions, the most prominent being the International Bank for Reconstruction and Development (IBRD) and the International Development Association (IDA). Its primary mission is poverty reduction and long-term development.
4.2 Objectives
Reconstruction & Development – Initially focused on post-war rebuilding, now on infrastructure and growth.
Poverty Reduction – Promote inclusive and sustainable development.
Financing Trade Infrastructure – Ports, roads, digital connectivity, and energy supply that enable trade.
Knowledge Sharing – Research and technical expertise.
4.3 Functions in Global Trade
Financing Development Projects: Infrastructure, education, health, energy.
Trade Facilitation: Improves logistics, reduces transaction costs.
Capacity Building: Helps developing nations integrate into global trade.
Risk Mitigation: Provides guarantees to encourage private investment.
4.4 Impact of World Bank on Trade
Building infrastructure that directly supports trade flows (e.g., transport corridors, ports).
Reducing bottlenecks and making exports competitive.
Encouraging private investment and entrepreneurship in developing markets.
4.5 Criticisms of World Bank
Projects sometimes cause displacement or environmental harm.
Critics argue the Bank pushes neoliberal reforms (privatization, deregulation).
Dependence on debt financing can burden poor countries.
5. Interrelationship Between WTO, IMF, and World Bank
These three institutions are often referred to as the “Bretton Woods Twins + WTO” or the pillars of global economic governance.
WTO → Creates the rules of trade.
IMF → Provides monetary stability for trade.
World Bank → Finances development to enable trade participation.
5.1 Coordination
WTO, IMF, and World Bank hold joint meetings to harmonize policies.
During crises (e.g., 2008 financial crash, COVID-19), they collaborated on stimulus and debt relief.
5.2 Complementary Roles
IMF stabilizes economies so they can continue trade.
World Bank builds the infrastructure that enables countries to trade.
WTO provides the legal framework that governs trade relations.
6. Case Studies
6.1 Asian Financial Crisis (1997)
IMF provided emergency loans to South Korea, Thailand, and Indonesia.
WTO prevented protectionist measures that could have worsened the crisis.
World Bank financed structural reforms in affected economies.
6.2 Global Financial Crisis (2008)
IMF expanded lending and increased SDR allocations.
World Bank financed countercyclical projects in developing countries.
WTO helped prevent a rise in tariffs and trade wars.
6.3 COVID-19 Pandemic (2020–2021)
IMF mobilized trillions in emergency support.
World Bank financed health programs, vaccine distribution, and digital infrastructure.
WTO monitored export restrictions on medical supplies and promoted trade facilitation.
7. Criticism of Global Economic Governance
Despite their contributions, these institutions face criticism:
Power Imbalance: Rich nations have more influence.
Conditionality and Sovereignty: Loans often reduce national autonomy.
Unequal Benefits: Global trade benefits are not equally distributed.
Environmental Concerns: Development projects sometimes harm ecosystems.
8. The Future of WTO, IMF, and World Bank in Global Trade
8.1 Challenges Ahead
Rise of protectionism and trade wars (e.g., U.S.–China tensions).
Global inequality and debt crises in developing countries.
Climate change and sustainable development needs.
Digital trade and financial technology disrupting traditional models.
8.2 Possible Reforms
WTO: Reform dispute settlement system and include digital trade rules.
IMF: Greater representation for emerging economies, flexible conditionality.
World Bank: Stronger focus on climate resilience and sustainable infrastructure.
8.3 Long-Term Role
Together, these institutions will remain crucial in shaping the global trade system—balancing stability, growth, and inclusivity.
Conclusion
Global trade is the lifeblood of the interconnected world economy, but it requires strong institutions to ensure fairness, stability, and sustainability. The WTO provides the rules, the IMF ensures monetary stability, and the World Bank finances development that enables participation in trade.
Though criticized for inequities and structural biases, these institutions have prevented major global trade breakdowns, facilitated economic growth, and enabled developing nations to integrate into the global economy.
In the future, reforms are needed to make them more inclusive, transparent, and responsive to new challenges such as digital trade, climate change, and inequality. Yet, their centrality in global trading remains undisputed—without them, the world economy would be far more unstable, fragmented, and vulnerable to crisis.