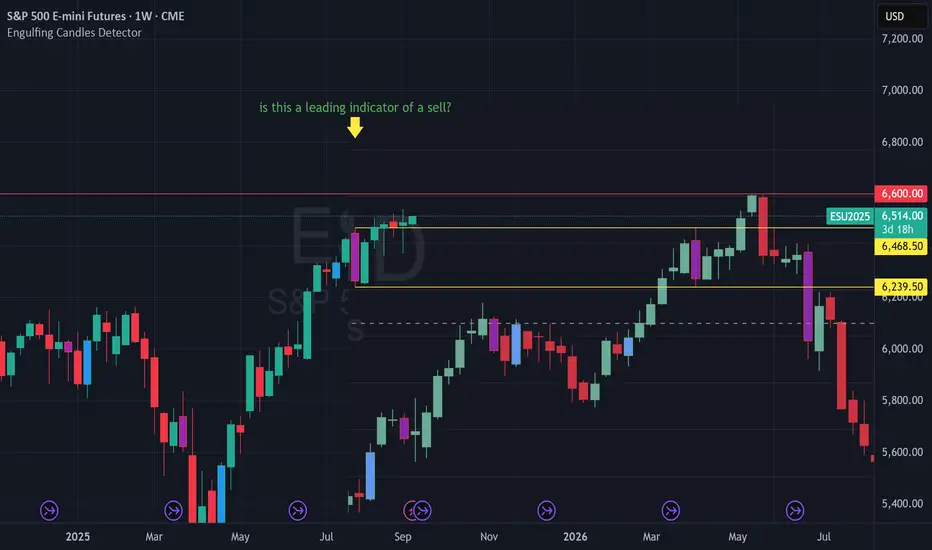
Is the Risk about to be a sell? Put an old pattern of gold from last fall up next to ES. Both have a striking similarity with a Bearish Engulfing pattern and price struggling to move past. Is that bearish engulfing weekly a leading indicator of a pretty sizable dumpster fire coming?
SPX500H2026 trade ideas
Day 25 — Trading Only S&P Futures | Gold’s Rally Raises FlagsWelcome to Day 25 of Trading Only S&P Futures!
Today started strong with an overnight short and continued by taking longs at major support levels. With the FOMC blackout period in effect, I leaned bullish but stayed selective, waiting for the 5-min MOB to hit before entering. That trade paid off and I wrapped the day at +264.83.
Still, there’s a cautionary note: gold just hit a record high above $3,633/oz, and that could be signaling underlying stress in the markets. Something to keep an eye on as we move forward.
🔑 Key Levels for Tomorrow
Above 6480 = Remain Bullish
Below 6465 = Flip Bearish
📰 News Highlights
SPOT GOLD EXTENDS GAINS, LAST UP 1.3% TO HIT A RECORD HIGH OF $3,633.65/OZ

Buyers have returned.Buyers have returned on the daily chart in the S&P 500. The challenge will be can they follow through the next objective to the upside is 6530.

ES - September 8th - Daily Trade PlanSeptember 8th - 8:50am - Update
In my post last night I stated, " Tonight's evening session, I think we can continue to build a base and work higher above the immediate 6492 resistance to 6505-6510 area. I could see us then setting up for a leg lower to flush the 6452 level (Friday's Low) maybe even get below the white trend line to the 6444, 6438 levels and then reclaim the 6452 level. IF not we might need to flush down to 6426 or just under and then reclaim that level to keep price moving higher."
The overnight low was 6479.50 and high is 6508. We have immediate support at 6493.50. While price can rally from here and we have tested the 6508 level 3x so far overnight. I think it needs a pull back to clear the 6508 resistance and overnight high. IF, price can flush 6592 (maybe down to 6488-90) then reclaim and rally, we could retest the 6508 resistances. Ideally, we flush the overnight low (6479.50) and use that level to reclaim and move higher.
IF, price is selling off pretty good and can't reclaim the overnight session low, the 6464, 6452 are key levels I will wait for a reaction, reclaim, and then follow up the levels.
Key Support Levels - 6493, 6479, 6464, 6453 - Below Friday's low, I would wait for a level below to build a base around and reclaim.
Key Resistance Levels - 6508, 6517, 6531, 6542
Since the 6508 level has tested 3x, IF, it does break out the back test of that level, should provide a good entry.
I will see how price is acting in the first 30 mins and will provide an update.

Follow-Up: Non-Farm Moves from FridayHi All,
Following up on the range (size of the move) after non-farm on Friday to see how close our range expectation estimates were (see the earlier video post linked here for that).
The actual number came in pretty poor and worse than expected at 22k (vs 75k expected).
The move on the Non-farm release itself was actually quite muted with roughly a 20pt move on both sides of our VWAP starting point. But the real move came around 30 minutes into the US open where we saw a quick decline down to our lower boundary (50pts lower at 6470) and then briefly over-ran to 6450. But we settled and that 6470 became support for most of the session before reverting back to that declining VWAP to finish the day around 6490.
So, what's the lesson here: a bit of time pre-framing the possibilities for moves in either direction using a combination of stats (ATR, standard deviation of range), other technical analysis tools (support/resistance, VWAP, vol profile) along with experience can help frame the day and the important levels. Use this to start to decide what tools to pull out of the toolbox (trading strategies) and where to initiate trades.
If you find this helpful and would like to see more please let me know.
Happy Trading!

ES (SPX) Weekly: Levels & Setups - Sep 8-12, 2025Price is camped under a higher-timeframe supply/“weak-high” band. Trend remains constructive on the Weekly/Daily, but 4H/1H are coiling beneath resistance. I’m neutral into mid-week inflation data and will only engage on clean acceptance above the prior-high band or a rejection back into range.
Event stance: Two inflation releases hit 08:30 ET mid-week. I’ll be flat into the prints and wait for the first qualifying 15-minute close before arming anything
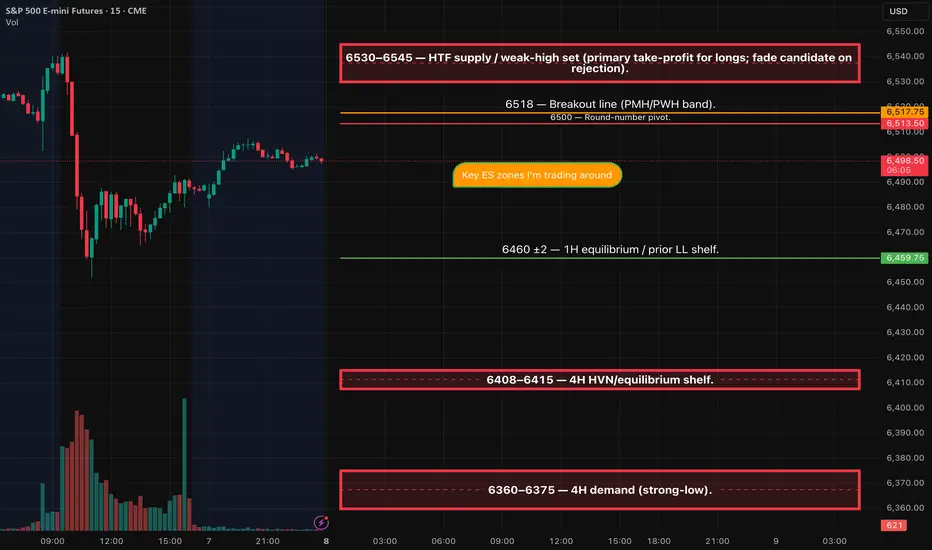
Key ES zones I’m trading around
6530–6545 — HTF supply / weak-high packet (primary take-profit for longs; fade candidate on rejection)
6518 — Breakout line (PMH/PWH band)
6500 — Round-number pivot
6460 ±2 — 1H equilibrium / prior LL shelf
6408–6415 — 4H HVN / equilibrium shelf
6360–6375 — 4H demand (strong-low)
Setup 1 — Breakout-Acceptance LONG
Trigger: 15m close > 6518, then two 5m bodies hold above.
Entry: 6520.5–6523.0 on the retest or break of bar-2 high.
Stop: tighter of (i) below the 15m trigger candle low, or (ii) below the last confirmed 5m swing; cap ≤ 6–8 pts.
• If neither option fits ≤ 8 pts from your fill, pass and wait for a cleaner micro HL.
TP1 (dynamic): first hard band (e.g., any workable print inside 6530–6545) that yields ≥ max(15, 2.5×SL) from your fill (front-run 0.25–0.5 pt if 2.5R is tight).
TP2/TP3: 6550, then 6570; trail by 15m/30m closes.
• Disqualifiers: any 5m body back ≤ 6518 before TP1; visible liquidity wall ≤ 5 pts beyond trigger; news window.
Setup 2 — SRR Rejection SHORT (Sweep → Recapture → Reversal)
Trigger: Sweep 6518–6530, fail, then 15m bearish close < 6518.
Entry: 6515.0–6518.0 on the retest from below.
Stop: tighter of (i) above the 15m trigger candle high, or (ii) above the last confirmed 5m LH; cap ≤ 6–8 pts.
• I f the correct structural stop is > 8 pts from your fill, skip until a micro LH tightens risk.
TP1 (dynamic): first hard band below that gives ≥ max(15, 2.5×SL) from your fill—usually 6500; if 2.5R isn’t met to 6500, promote to 6482, then 6460.
TP2/TP3: 6482, then 6460 (extend toward 6410 if momentum).
• Disqualifiers: no 15m bearish confirmation; any 5m body ≥ 6518–6522 after entry (use your exact line); news window.
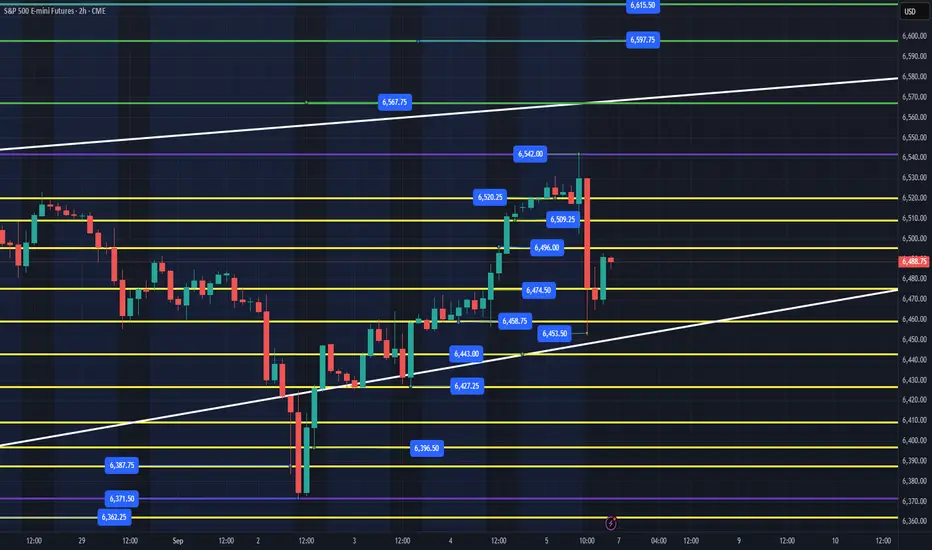
ES - September 8th - Daily Trade Plan - Evening SessionSeptember 7th - 5:50pm - Evening Update
Before you read my plan for September 8th. Please read my Weekly Trade Plan that is found in the related publication section. Those are the key levels that are very important from a big picture. On the daily trade plan, I want to drill into a 15 min time frame to show you the levels from the micro perspective. You can also read the Friday - September 5th plan for further details into what we were looking for. Friday sold off to Thursday's low, recovered and rallied into the late afternoon.
Tonight's evening session, I think we can continue to build a base and work higher above the immediate 6492 resistance to 6505-6510 area. I could see us then setting up for a leg lower to flush the 6452 level (Friday's Low) maybe even get below the white trend line to the 6444, 6438 levels and then reclaim the 6452 level. IF, not we might need to flush down to 6426 or just under and then reclaim that level to keep price moving higher.
Key Support Levels - 6453-58, 6443, 6427, 6370
Key Resistance Levels - 6492-96, 6507-09, 6520, 6542
I will post an update by 6am EST with an update based on the overnight session. We are in a weird spot here and ideally flushing Fridays low and reclaim would be high quality. Everything is level to level reclaims.
Couple of things about how I color code my levels.
1. Purple shows the weekly High/Low
2. Red shows the current overnight session High/Low (New chart out in am)
3. Blue shows the previous day's session Low
4. Yellow Levels are levels that show support and resistance levels of interest.
5. White shows the trendline from the August lows.

ES Futures Long Setup! Ride the Bullish Momentum!
🚀 **ES Futures Long Setup! Ride the Bullish Momentum!** 🚀
📊 **TRADE IDEA – E-mini S\&P 500 (ES)**
**💡 Direction:** LONG
**🎯 Entry Price:** 6489.75 (Market Open)
**🛑 Stop Loss:** 6440.60 (ATR-based, \~49 pts)
**📈 Take Profit:** 6588.06 (2:1 R\:R)
**📏 Position Size:** 1 contract (scale per risk tolerance)
**💪 Confidence:** 62%
**🔥 Trade Rationale:**
* Price above 10/20/50/200 SMAs & EMA9/21 → bullish alignment ✅
* ATR-aware stop protects against volatility ⚡
* Reward-to-risk ratio 2:1 for controlled upside 💹
* Cautiously bullish: MACD short-term mixed, but overall trend supports a long
**⚠️ Key Risks:**
* Negative MACD histogram → possible short-term pullback
* ATR high → dollar risk per contract larger
* Price near 20-day high → monitor for resistance
* Economic data releases can increase volatility
**📌 Execution Notes:**
* Enter at market open at 6489.75
* ATR-based stop below 6440.6
* Target 6588.06, consider scaling out or partial profit taking
💥 **Don’t miss this ES long trade with defined risk & high upside potential!**

ES - Weekly Trading Plan - September 8th-12thSeptember 7th - 11:40am EST - Weekly Post
Recap of last week's plan - I stated on Saturday August 30th - "I do believe we can still rally up to 6547, 6563+ this week, but IF, we lose the 6369 level, that would be a big blow to bulls, and it would need to be sharp reclaim back inside the white trendline to keep momentum." (See Related Publications section)
We had a low volume Labor Day holiday, but when institutions came back on Tuesday around 10am EST we set the weekly low at 6371.75, reclaimed the white trend line and we climbed all week into our first target of 6547 and made a high of the week of 6542 on Friday and sold off.
(I post a more detailed daily plan - follow me so you don't miss my daily updates).
-----------------------------------------------------------------------------------------------------------------
What is the plan for this week? Remember, Institutions hunt for levels to run stops and then take that level higher or lower. You can review my daily trade plan from Friday and see that I was anticipating a potential sell off after the open. Retail traders were bullish, got caught offsides, Institutions start to sell, all the retail long stops got taken out and Institutions stepped in on Friday afternoon and flushed Thursday's low of 6458 while everyone thought we were going much lower, created a short squeeze and we ended Friday around the 6490 level.
Our weekly low was 6371.75 with a high of 6542 put in on Friday. The white trend line continues to be sold below and then taken higher. I anticipate trapping this week as we look towards the FOMC on 17th and Quarterly Window Dressing by Institutions with the following economic events this week:
Wednesday - September 10th - PPI
Thursday - September 11th - CPI
We have to stay bullish until proven otherwise, last week 6369 was the key level to hold and we did. This week 6410-6425 really needs to hold. I could see us pulling back into the 6425-6435 zone, trapping and moving us higher. The first big level I will be looking for a flush and reclaim is 6453-6458 area, that was last Thursday and Friday's levels. Since we have produced some nice rallies from this area, we could bounce, flush down to 6430-35, catch everyone offsides and then rally higher. (I will go into more detail on Monday Daily Trade Plan)
Key Support Levels - 6370, 6427, 6443, 6453-58
Key Resistance Levels - 6496, 6507-09, 6520, 6542
Target Levels for Week - 6567, IF, price wants it we could go higher to 6597, 6615 but those are not my main targets for the week as the white trendline around 6567 should be a strong resistance.
We could see a similar cycle to last week, drop Monday down to one of the key support levels, flush and take us higher to the white trendline (6567) area and then sell of Friday like we did this week.
Follow to read my daily trade plan - I will send out tonight's Sunday Session Open Trade Plan by 5pm EST.
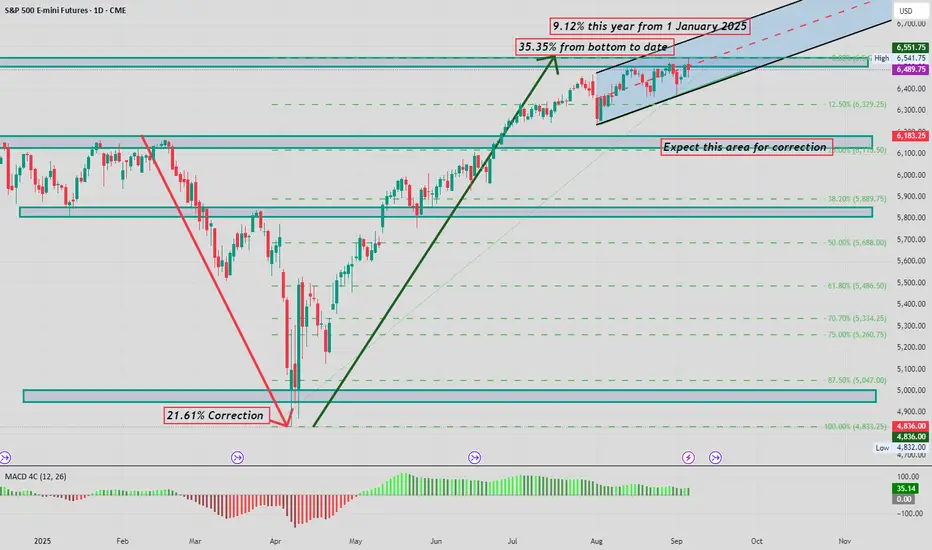
S&P moves this year and potential correction target i Have mapped out the moves we have had this year and show key areas and a potential correction pullback area.
MES1! WEEK 37 SEPT 7TH Looking for MON. TUE, WED HIGH of the week trading above $6500. LOOK TO TAKE SELLS FROM THE PREMIUM END OF THE CURRENT DEALING RANGE.
THERE ARE RELATIVE EQUAL LOWS AT $6430 AND $6365.
IF -- PRICE CAN NOT GET BLOW THE DISCOUNT RANGE THEN YOU ARE OFF SIDE AND SHOULD LOOK TO BUY FOR HIGHER PRICES.
CALANDER EVENT
TUES
-10AM - PMI (HIGH)
- 2PM - TRUMP SPEAKS
WED
-10AM - JOLT's JOB OPENING (HIGH)
THUR
-8:30AM - NF- EMPLOYMENT CHANGE (HIGH)
-10AM - PMI (HIGH)
FRIDAY
-8:30AM - NFP / UNEMPLOYMENT RATE (HIGH)
- UNEMPLOYMENT CHANGE (HIGH)
-4PM - TRUMP SPEAKES
Note - find 6pm=6am dealing range.
- note any smaller ranges within the DR that we can trade form on the 15m.5m.or 1m
FED Rate Cuts Aren’t the Blessing You Think — History Proves ItIn this video I ll take you thru historical macro events and we will see how it all rhymes with current markets conditions.
Here is link to my initial article with the data
Remember: Macro takes time to play and price can be going for months before the crash happens watch charts Im mentioning and whole picture will starts to show to you.
Stay safe and protect your wealth and family. Next 5 years of the 4th Turning can be violent not only on the markets.
David Perk

Stock Index: The AI Bubble That Will Burst!ES
S&P 500 futures finishes up 0.23% as economic slowdown worries cloud rate-cut optimism. From a technical perspective, this week marks the third consecutive where ES has been trading inside of 11 Aug 25 bullish spinning top candle indicating weakness of bulls after reaching uncharted territory of $6,541.75 all-time highs.
Such signs point to a short-term retracement down into discount arrays but I am not here trying to guess the top. If it does occur, $6,355.00 is an area of interest but on an overall basis, I want to be neutral until Sunday’s opening price / opening gap.
NQ
Nasdaq follows with a 0.93% gain but with the same issue of price trading within a range, in this case, since the 4th Aug 25 weekly bullish marabozu was printed, I would not want to put my money on a continued run as of yet. Preeing short-term retracements with a discount array @ $22,781.75 is being watched closely and for the time being, I want to be neutral
YM
Dow Jones closes -0.37% lower this week with the intermediate highs of $45,887 still in tact. Will the monthly buyside liquidity pool be used to suck in unexpected bull traders before repricing to HTF discount arrays?
If I am to see a decline in the 3 stock index pairs, YM will be the pair to lookout for as the front-running market.

Automating TradingView Alerts to Tradovate (Step 1: Webhook + JSWelcome to the first video on my channel, Quant by Boji.
In this series, I’m walking you through how to build a complete end-to-end automation pipeline that takes alerts from TradingView and turns them into real trades on Tradovate, with confirmations sent to Telegram.
In this first episode, I cover the foundation:
Creating an indicator in TradingView using Pine Script
Adding the alertcondition() function so alerts know when to fire
Setting up an alert in TradingView with the Webhook URL
Writing a JSON message in the alert so your server has all the data it needs
By the end of this video, you’ll understand how TradingView can send structured alerts directly to your server, which is the first step in connecting it all to Tradovate.
⚠️ Disclaimer: This content is for educational purposes only. I’m not providing financial advice. Futures trading carries substantial risk, so always start in paper trading and do your own due diligence.
🔔 Subscribe and follow along — in the next episode, I’ll show you how to capture these alerts on AWS and move closer to live automation.

Day 24 — Trading Only S&P Futures | +$264 Overnight WinWelcome to Day 24 of Trading Only S&P Futures!
Today was all about patience and levels. I noticed the market had already made a huge move yesterday, so I bet it couldn’t push much further overnight. I shorted at 6525 and woke up to a $250+ profit by market open.
That was enough for me — the plan worked perfectly, so I stayed mostly on the sidelines for the rest of the day. Both our overnight level and yesterday’s level played out exactly as expected, which made this a clean session.
Closed the day at +264.83.
📰 News Highlights
U.S. ADDS FEWER-THAN-EXPECTED 22,000 JOBS IN AUGUST, BOOSTING ODDS OF 50BPS CUT
🔑 Key Levels for Tomorrow
Above 6470 = Remain Bullish
Below 6450 = Flip Bearish

Monday is expected to be an inside dayThe daily structure in the S&P 500 chart implies an inside day for Monday which means Monday would trade within the range of Friday.

price returns to proven buyers providing cheap entry 1->3 : proven buyers at number 2
3->4 : return to proven buyers
next ?
* hidden bull rsi and mfi +oversold
* vpoc
*vwap 1st standard deviation

return to support during uptrend presents a cheap entry 1->3 : push up marking 2
as proven buyers
3->4 : return to proven buyers
next?
* hidden bull divergence
* behind vpoc 1->3 swing(s)
*uptrend continuation
*bullish bar entry at support
*zone trading 75% probability follow through to profit, though the invalid is below our stop as the zones are too big to align stop with zone stop also

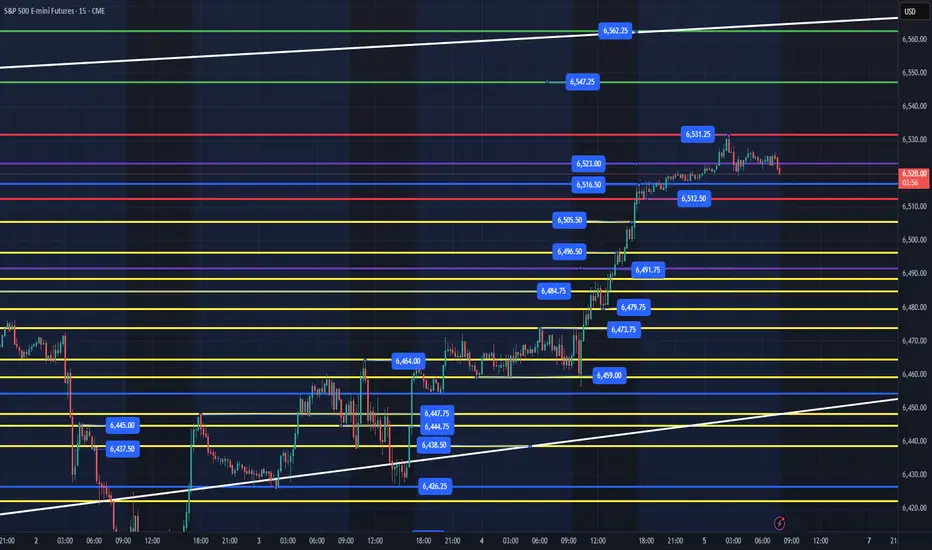
ES - September 5th - Daily Trade PlanSeptember 5th - 7:55am
Last night session I stated - "My lean is we grind sideways and up into the 6523 level overnight and then we will need to wait for the employment report and NYSE to try and get some level losses and reclaims to finish the week at our targets of 6547, 6563+."
Our overnight session has been rangebound between 6512 - 6531. Employment report and NYSE open will determine which direction we move. I will be waiting for price to settle down after initial reactions and look for the best levels that I will be looking for a flush and reclaim would be the 6491 level as it was the high of this week during the Sunday evening session. We could dip down to 6473/79 levels and then rally.
I will update around after employment report and around 10am.
-------------------------------------------------------------------------------------------------------------------
Couple of things about how I color code my levels.
1. Purple shows the weekly High/Low
2. Red shows the current overnight session High/Low (New chart out in am)
3. Blue shows the previous day's session High/Low
4. Yellow Levels are levels that show support and resistance levels of interest.
5. White shows the trendline from the August lows.
Non Farm Payrolls 0830 EST Non Farm Payrolls (NFP) main event is tomorrow. Big show down between Bulls vs Bears. ADP was a market miss today, will NFP be a market miss?
If jobs report is no bueno will markets blast a roo up because they like the potential for Fed Rate cuts confirmed or will risk markets do a dumpster fire? Only time will tell. 0730 CST is the time to sit by the ringside to find out who wins.
#nonfarmpayrolls
#volitilemarkets

Its Non-Farm: How much will ES Move?Hi all - Happy Non-Farm Friday!
I haven't done this in a while and thought it might be helpful to share my process for estimating the size of the move that we may get on ES after the Non-Farm Payrolls data is released.
I'm not trying to make a prediction on direction here - but more understand where the boundaries could be so I can determine how to trade this (what trading tool I can pull out of my box) once the announcement comes out.
Hope it helps and please let me know if you find it useful and I'll create more posts .
Cheers,
Jeff

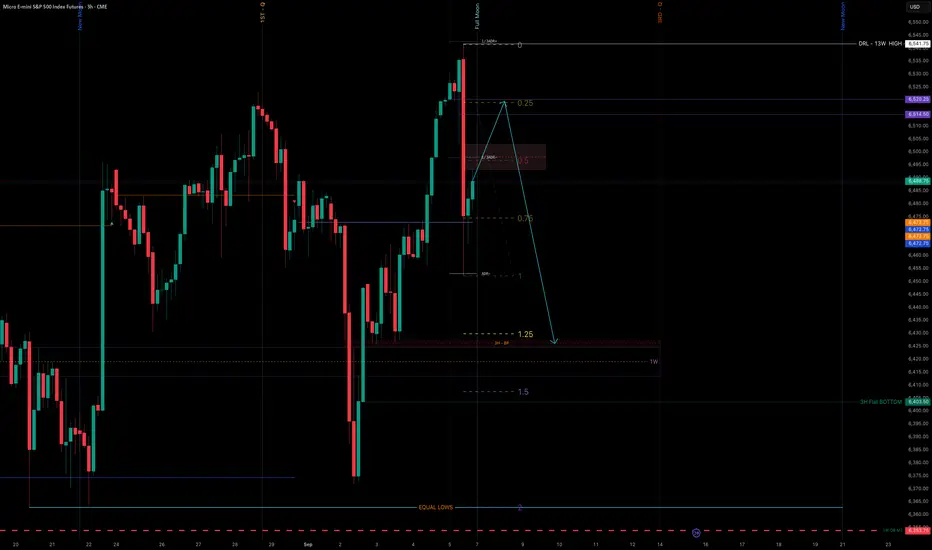
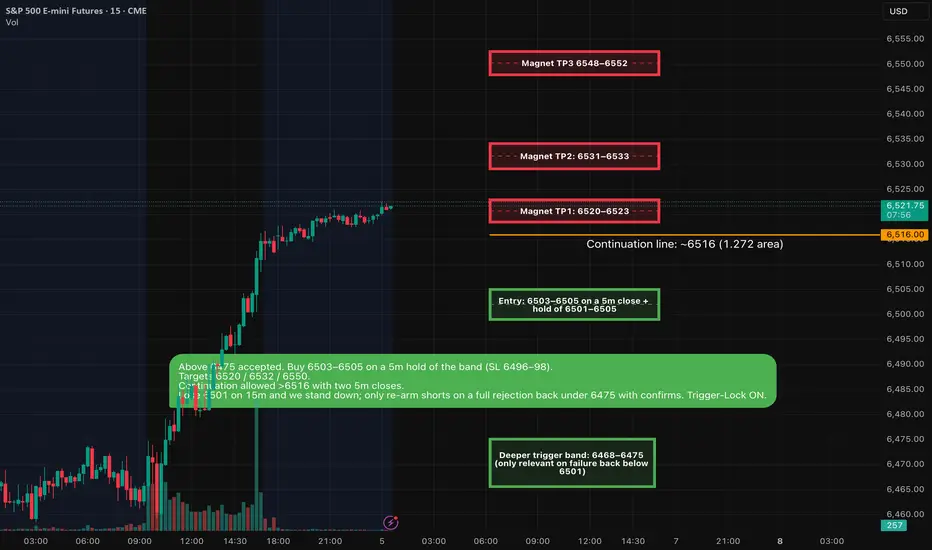
ES — Intraday Analyses & A++ Setups (Fri Sep 5, 2025) • Demand (reclaim): 6501–6505 — now support; Trigger-Lock ON
• Continuation line: ~6516 (1.272 area)
• Upside magnets: 6520–6523, 6531–6533, 6548–6552
• Deeper trigger band: 6468–6475 (only relevant on failure back below 6501)
A++ Long Setup
Retest-Hold LONG
• Entry: 6503–6505 on a 5m close + hold of 6501–6505
• SL: 6496–6498 (≤ 6–8 pts)
• TP1: 6520–6523
• TP2: 6531–6533
• TP3: 6548–6552
Invalidation: Any 15m close < 6501 after acceptance.
Failure / Flip path
• If 6501–6505 fails on a 15m close, expect a deeper probe toward 6475.
• Shorts are not active unless we get the full sequence: rejection of 6468–6475 → 15m bearish < 6466 → 5m failed retest 6447–6451 (then use 6432/6422/6413 TP ladder).
Positive attitudeThe daily price action on Thursday in the S&P 500 indicates a positive attitude of the market going into Friday's labor numbers. It will be interesting to see if buyers follow through with a positive close going into the weekend.
