Global FX Trends: Policy Divergence and a Resilient DollarThe foreign exchange market is currently being shaped by two dominant forces: diverging central bank policies and the surprising resilience of the U.S. Dollar despite expectations for further rate cuts. As we move into the final quarter of the year, macro fundamentals are increasingly outweighing earlier trade headlines to guide currency direction.
The U.S. Dollar Finds a Floor
After an aggressive sell-off earlier in the year, the U.S. Dollar has staged a significant rebound and is now stabilizing. This turnaround is largely due to resilient U.S. economic data, which has led the Federal Reserve to adopt a more cautious stance on future interest rate cuts. While the market had priced in an aggressive easing cycle, the Fed's reluctance to commit to a rapid pace of cuts has revived the dollar's appeal. Additionally, the USD retains its status as the world's primary safe-haven currency, providing it with inherent support amid global geopolitical and financial market uncertainties. Traders are now focusing more on real economic data than on speculative Fed expectations.
Key Divergences in Major Pairs
The stabilization of the USD is driving volatility and clear trends in major currency pairs:
EUR/USD : The Euro initially surged to multi-year highs earlier in 2025 but has since retreated against the stronger dollar. The European Central Bank (ECB) is seen as being closer to ending its easing cycle and the Eurozone economy is showing signs of moderate momentum, which provides underlying support for the Euro. However, any sustained rally requires the market to price in more definitive Fed cuts than the Fed is currently signaling.
USD/JPY: The pair remains volatile, with the Yen facing pressure from the persistent large interest rate differential between the U.S. and Japan. While the Yen is a traditional safe-haven asset, it is being weakened by the ultra-low interest rates maintained by the Bank of Japan (BoJ). Speculation about a possible BoJ rate hike is keeping the Yen from weakening further, but the pair’s direction is currently dominated by USD strength and the rate gap.
Commodity Currencies: Currencies like the Australian Dollar (AUD) and Canadian Dollar (CAD) have been stabilizing, benefiting from a perceived improvement in global risk sentiment and stabilization in commodity markets. However, these currencies remain highly sensitive to news regarding U.S.-China trade relations, often acting as a proxy for global growth and demand.
The overarching theme for the rest of the year remains monetary policy divergence. While most G10 central banks have already begun cutting rates, the U.S. Fed's slower pace is keeping the dollar comparatively firm, creating sharp movements and opportunities in the major currency crosses.
*CME Group futures are not suitable for all investors and involve the risk of loss. Copyright © 2023 CME Group Inc.
**All examples in this report are hypothetical interpretations of situations and are used for explanation purposes only. The views in this report reflect solely those of the author and not necessarily those of CME Group or its affiliated institutions. This report and the information herein should not be considered investment advice or the results of actual market experience.
Trade ideas

Psychology of Execution — The Discipline Behind ProfitabilityThe trader’s work is not to predict, but to identify and repeat statistical edges.
We are not paid for time or effort — trading is not a conventional job where more work means more income.
We are compensated for analytical precision and disciplined execution.
Every trading system lives or dies by its risk management.
Capital protection is not defensive; it is strategic — because only preserved capital can compound.
Patience is not passivity; it is the highest expression of confidence in one’s own method.
There is no consistent profit outside of a system with proven positive expectancy.
The Stop Loss is not a punishment, but the technical boundary where an idea loses validity — respecting it preserves both capital and clarity.
The Take Profit is not greed; it is discipline in harvesting the statistical payoff that maintains long-term profitability.
Risk–Reward asymmetry is one of the most important principles of professional trading.
However, it must be calibrated: win rate and R:R are inversely correlated in most systems.
High R:R setups can be profitable even with low accuracy,
but the real question is whether the trader’s psychology can endure long sequences of losses without emotional erosion.
Market rumors and sentimental analysis are traps — they feed volatility, not precision.
Professional traders operate from objective data, structure, and impartial interpretation,
letting probability — not emotion — dictate the outcome.
Trading is a craft of asymmetry, probability, and restraint.
Profit is the by-product of method — not the reward for effort.

Euro Eyes Breakout Ahead of Rate DecisionFenzoFx—EUR/USD is trading lower today, below the descending trendline. The price has been reacting to the ascending trendline multiple times as shown on the chart. There is a double bottom formed at $1.1584, which could limit the upside momentum as liquidity rests below them. As we approach the US interest rate decision, we expect Euro to trade higher against the U.S. dollar and break above the descending trendline.
In this scenario, Euro could rally to 1.1766, followed by 1.1830. On the flip side, if Euro remains below the descending trendline, the price could target the double bottom at 1.1584, as sell-side liquidity is resting below this level.

Wait for price to SHOW ME WHERE TO MAKE MONEY!Hey Squad,
Im going to keep this short and sweet but I want you to PEEP......lol the possible setups that are coming. This week we can not tell exactly what to look for since the market is giving us opposing call outs. For example, The Weekly looks like a double top has formed showing bears/selling favor but the 4/8h shows respecting of a low and shows the forming of a double bottom!
so what does this mean? We are waiting for price to show us who to follow!! But if you were to ask me....I believe the USD will suffer this week due to shutdown and uncertainty so I believe we will be trending low! Good for gold and silver traders and those that see weakness in the $!
If we can break below the 1.163 area and hold I think its clear we are moving down until we hit a high time frame FVG.
Tell me your thoughts and comments on this Analysis!
and like always! Gd look out there and TAKE PROFIT!

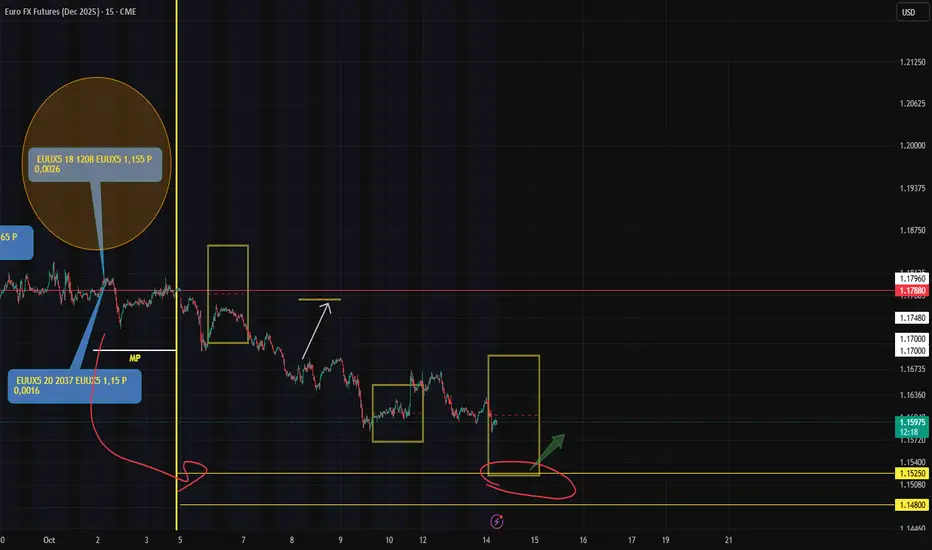
ER + Option Break-Even = Hidden Support Zone in EURA quick look at my slightly crazy trading chart for the Euro futures — here’s what matters today:
🔸 A naked put at 1.55 (circled) has seen outflows of nearly 1,300 contracts, with roughly 3,000 still open — though not all may be "naked" (some could be part of structured positions).
Important context:
This option is still out of the money (obviously), but holders have already made ~2x their initial premium and are now taking profits.
👉 So the right question is:
Why take profits now instead of waiting for further downside?
🔸 Second key point:
Today’s lower ER boundary aligns almost perfectly with the break-even level of this 1.55 put — where some open interest remains.
Now, if these are indeed naked puts (not complex hedged portfolios), then as price approaches this zone, traders will likely start buying futures to build up synthetic portfolio
📌 Result?
Potential bounce or short-term rally from this level.
Not because of bullish sentiment — but speculative logic
$EURO - LONGThe EURO looks good for a short-term correction. Let's see if we can respect this POI and push further high, targeting a 2R Trade from here.

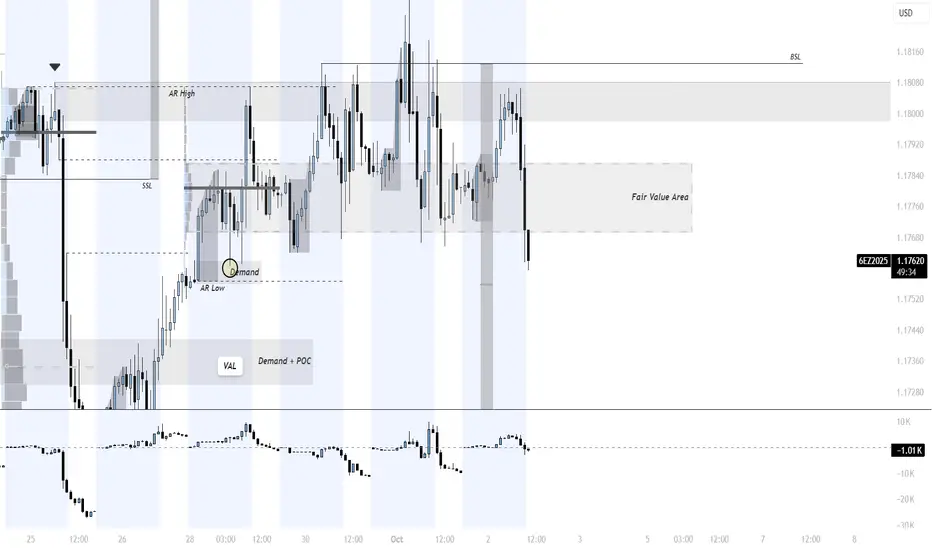
6E EURUSD - SHORT SETUPTechnical Context
The market confirmed acceptance below the previous H1 dealing range, extending the current bearish efficiency phase.
The supply zone (1.1653–1.1665) sits slightly above the Value Area Low, where aggressive sellers could defend the return to the macro VA, indicating renewed intent for redistribution.
Despite this local bearish continuation, the daily dealing range remains intact and technically bullish, suggesting we are approaching the lower boundary of a higher-timeframe demand zone.
Upcoming setups in this area carry increased short-side risk as price nears potential higher-timeframe absorption zones.
The release of the next COT report will be crucial to assess net positioning and the prevailing directional pressure among institutional participants.
Execution Plan
Bias: Short
Entry Zone: 1.1653 – 1.1665 (Aggressive Sellers + Supply Zone above VAL)
Stop Loss: 1.1690
Take Profit 1: 1.1588
Take Profit 2: Projection (continuation of redistribution phase)
Trigger: Price compression and redistribution inside the supply zone
Technical Note
Sellers maintain control below value after defending the premium area.
Failure to regain acceptance above 1.1665 confirms ongoing redistribution, with potential expansion toward the lower low or deeper continuation.

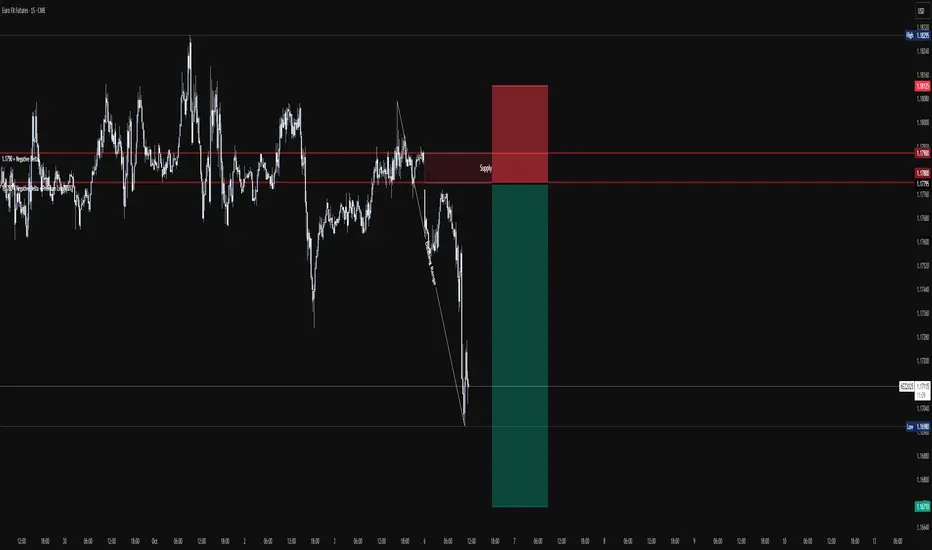
6E - EUR/USD FX - SHORT SETUPTechnical Context
We are waiting for price to approach the 75 % premium zone (1.1785–1.1800), where prior negative delta clusters align with the POC of the local value area — the origin of efficient selling.
Above this range, the 1.1811 level represents the macro value area of the long-term consolidation (since June 25, 2025), reinforcing this zone as a critical supply boundary.
VWAP remains sloping downward, confirming bearish efficiency and continuation of the broader distribution phase.
If price revisits this region, we will look for signs of rejection or compression, confirming continuation of the current macro breakdown.
Execution Plan
Bias: Short
Entry Zone: 1.1785 – 1.1800 (Local VA POC + 75 % premium + supply cluster)
Stop Loss: 1.1830
Take Profit 1: 1.1650
Take Profit 2: 1.1600
Trigger: Compression and redistribution inside the supply zone

6E - SHORT SETUPTechnical Context
The market broke down from the previous dealing range, showing full acceptance below the prior value area.
We are now waiting for price to reach the upper boundary of the new distribution zone, where a prior negative delta at 1.1750 (75% premium line) confirms the origin of efficient selling activity.
If price revisits this zone, I will look for signs of redistribution, confirming continuation of the current selling phase.
Execution Plan
Bias: Short
Entry Zone: 1.1750 (75% premium + negative delta + prior supply)
Trigger: Redistribution inside the zone
Target: Extension of the previous breakdown range
Invalidation: Acceptance above 1.1770

Euro May Drop Toward $1.1656FenzoFx—Euro traded higher today, up by 0.33%; however, the uptrend eased after the price reached the equal highs at $1.1807. However, the volume profile formed lower lows, meaning the current uptick in momentum could be fake.
The immediate support rests at $1.1761. From a technical perspective, a close below this level can trigger the downtrend. If this scenario unfolds, Euro could target the lows at $1.1656.

6E - SHORT SETUPTechnical Context
The market broke down from the previous dealing range, showing clear acceptance below the last value area. Price is now retracing toward a supply zone aligned with the 75% premium line, where prior negative delta confirms seller efficiency.
If price revisits this zone, a short opportunity may emerge as the market seeks to rebalance liquidity inefficiencies left behind during the breakdown.
Execution Plan
Bias: Short
Entry Zone: 1.1780–1.1790 (supply + negative delta + premium + round number)
Confirmation: Lower timeframe distribution on the zone
Target: Projection of the previous swing (-25% range)
Invalidation: Acceptance above 1.18
EUR Supply-Demand Short SignalSee Chart For Analysis.
for sure a lower edge type of trade small risk.

Institutional Absence & Retail-Driven Liquiditywww.forexfactory.com
The current market environment reflects an absence of strong institutional conviction, with price rotating inside overlapping value areas as uncertainty from the government shutdown limits directional discovery. Without key economic data to anchor narratives, orderflow is dominated by retail participation, where stop-losses and emotional reactions provide the primary source of liquidity. This creates volatility spikes and false auctions that lack sustained follow-through, making the market prone to choppy, stop-driven moves rather than genuine intent. In such conditions, caution is essential, with asymmetric opportunities found only at extremes of value areas or in response to major liquidity events that can reintroduce institutional activity and restore directional flow.
EURUSD Supply-Demand ShortSee Chart For Analysis.
1 issue I have with selling the EUR is that long-term fundamentals I'm bullish EUR
and bearish the DXY so this would be against my long-term bias.

Euro Slow Rise HigherSince the market found a near term bottom back in January, the Euro has seen strong gains to the upside. There are many factors that have helped not only boost the Euro, but also other currencies globally, and one of which has been broad weakness in the Dollar. There are a lot of concerns looming that are still unpredictable, including potential interest rate cuts for the remainder of the year, tariff decisions, and global tensions. It is also important to understand the price compared to historic prices, and even though the price has been rising, the market has been in a downtrend for some time looking back to the early 2000s.
Fresh from the Trading Room: As path changes
Looking more at the technical levels can tell a similar story as well. The Euro traded out above the 200-day moving average back in March, and since then the market has not dipped down below that level and has also respected the 50-day moving average as a sort of "support" level where prices have rebounded back out above it after testing it to the downside. Along with that, the 1.16 level acted as resistance and has now flipped to a level the market has bounced off of and is now acting as support. There are a lot of factors that can change the trajectory of this market, but seeing prices moving slowly higher while relative strength remains in neutral territory shows a lot of strength.
If you have futures in your trading portfolio, you can check out on CME Group data plans available that suit your trading needs tradingview.com/cme/
*CME Group futures are not suitable for all investors and involve the risk of loss. Copyright © 2023 CME Group Inc.
**All examples in this report are hypothetical interpretations of situations and are used for explanation purposes only. The views in this report reflect solely those of the author and not necessarily those of CME Group or its affiliated institutions. This report and the information herein should not be considered investment advice or the results of actual market experience.

EUR/USD Eyes Liquidity Gap at $1.1788 SupportFenzoFx—Euro is trading bearish in the short term, currently lingering around the fair value gap with support at $1.1788. Looking at the 4-hour chart, we notice the price respected the bearish FVG with resistance at $1.1903, and the price failed to close above it and engulfed below it.
From a technical perspective, the sell-side liquidity has not been taken yet. That's the gap area with support at $1.1788. We expect the short-term bearish bias to resume by filling the gap. The cumulative volume profile also indicates the recent higher lows are valid, and there is no bullish divergence.
The bearish outlook should be invalidated if the price closes above $1.1903.

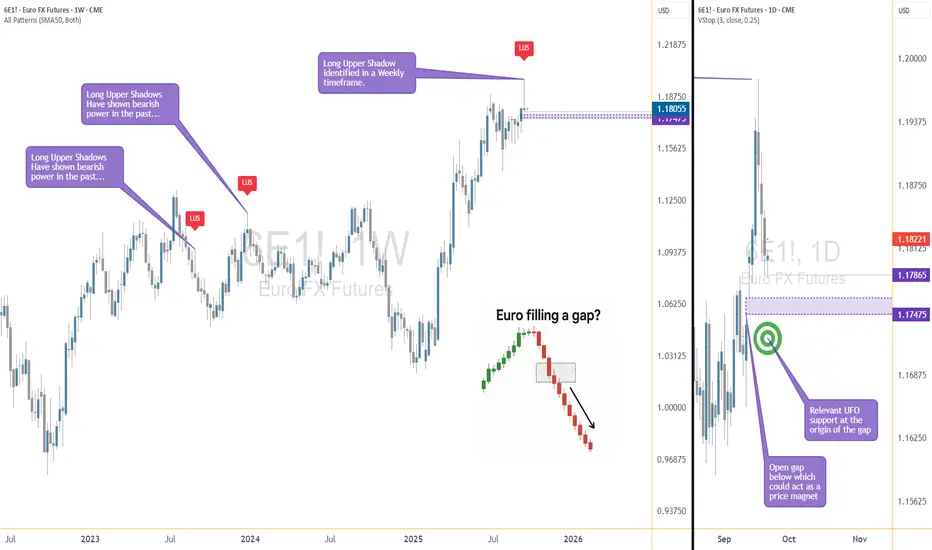
Mind the Gap! The Euro's Waiting GameShadows and Gaps: The Market’s Inside Joke
Euro FX Futures (6E, M6E) are doing that thing again… you know, when the chart leaves a Long Upper Shadow (LUS) on the weekly candle and basically whispers, “Don’t get too comfortable up here, bulls.”
Shadows this long usually mean buyers tried to party at higher levels, but sellers crashed the event and sent everyone home early. And just to make life interesting, the daily chart left an open gap below — like an unfinished side quest in a video game. Gaps are notorious for pulling price back, sooner or later, because the market hates leaving things undone.
The Setup: Simple but Sweet
Here’s how the trade idea shapes up:
Trigger: Wait for a break below 1.17865 (prior low).
Target: 1.17475 — the “gap magnet” zone.
Stop: 1.18090, based on volatility so it isn’t just a random guess.
Reward-to-Risk: Around 2:1. Clean, balanced, and not too shabby.
⚠️ Quick heads-up: right under that gap sits a support zone. Translation? Don’t overstay your welcome. Get in, fill the gap, and don’t go fishing for extra ticks where a bounce might kick you out.
Why This Combo Works
This setup is a little like peanut butter and jelly — two different flavors that just click.
Weekly chart = a big ol’ rejection shadow.
Daily chart = a gap that’s basically screaming, “Fill me!”
Put them together, and you’ve got multi-timeframe confluence — a fancy way of saying “both charts agree.” And when charts agree, traders pay attention.
Big vs. Mini: Futures Contract Fun
6E (Euro FX Futures): Big contract, €125,000. Each tick = $6.25. Great for heavy hitters.
M6E (Micro Euro FX Futures): Mini-me version, 1/10th the size. Each tick = $0.625. Perfect if you’d rather test the waters than dive headfirst.
Micros make scaling in and out a breeze, and honestly, they’re underrated for learning without risking the farm.
The Takeaway
The Euro is caught between rejection above and a magnet below. No downside break yet, but once 1.17865 goes, the path to 1.17475 could be quick.
Moral of the story? Candlestick shadows troll the highs, gaps tempt the lows, and patience is the secret sauce.
Want More Depth?
If you’d like to go deeper into the building blocks of trading, check out our From Mystery to Mastery trilogy, three cornerstone articles that complement this one:
🔗
🔗
🔗
When charting futures, the data provided could be delayed. Traders working with the ticker symbols discussed in this idea may prefer to use CME Group real-time data plan on TradingView: www.tradingview.com - This consideration is particularly important for shorter-term traders, whereas it may be less critical for those focused on longer-term trading strategies.
General Disclaimer:
The trade ideas presented herein are solely for illustrative purposes forming a part of a case study intended to demonstrate key principles in risk management within the context of the specific market scenarios discussed. These ideas are not to be interpreted as investment recommendations or financial advice. They do not endorse or promote any specific trading strategies, financial products, or services. The information provided is based on data believed to be reliable; however, its accuracy or completeness cannot be guaranteed. Trading in financial markets involves risks, including the potential loss of principal. Each individual should conduct their own research and consult with professional financial advisors before making any investment decisions. The author or publisher of this content bears no responsibility for any actions taken based on the information provided or for any resultant financial or other losses.

EUR Futures likely to hit 1.2 this month or next. The round number level of 1.2 for EUR Futures seems pretty close at this point to be targeted at some point the rest of the month or next month.

Gap-Fill Watch: Euro FX Futures React to Weekly RejectionIntroduction
When analyzing futures markets, one of the most compelling signals arises when higher timeframe candlestick rejection aligns with lower timeframe price imbalances. That is exactly what we see in Euro FX Futures (6E, M6E). On the weekly chart, long upper shadows (LUS) have historically marked turning points, reflecting exhaustion of bullish pressure. On the daily chart, an open gap below current price offers a potential magnetic pull. Together, these elements provide a textbook technical case study of how price can align across timeframes.
This article explores the educational insights behind candlestick rejection and gap mechanics, then applies them to a concrete trading scenario in 6E and its micro equivalent, M6E.
Weekly Chart: The Long Upper Shadow (LUS)
Long Upper Shadows appear when a market tests higher levels but fails to sustain them, leaving sellers in control by the close. They are one of the clearest visual expressions of rejection.
In Euro FX Futures, past long upper shadows have preceded significant bearish moves. Each instance reflects an imbalance where buyers were unable to absorb selling pressure at higher prices. The most recent weekly candlestick shows another long upper shadow forming near resistance. For technically minded traders, this is an early warning sign of potential downside ahead.
Daily Chart: The Open Gap Below Price
Price gaps occur when markets open significantly away from the prior session’s close. In futures, gaps often act like magnets—price tends to revisit them over time as liquidity seeks balance.
Currently, Euro FX Futures show an unfilled gap just below the market. Historically, such gaps in 6E have attracted price action, especially when combined with bearish rejection signals from higher timeframes. The combination of a weekly LUS above and a daily gap below paints a picture of imbalance: rejection at the highs, unfinished business at the lows.
Trade Setup
A structured trade idea emerges from this technical alignment:
Entry condition: Short position if 6E breaks below the prior day’s low at 1.17865. This ensures price is moving in line with bearish continuation before entry.
Target: 1.17475, the origin of the open gap. This is where the “magnet effect” is expected to complete.
Stop-loss: 1.18090, derived from a 2-day ATR calculation and adjusted to 25%. This keeps risk tight but accounts for minor noise.
Reward-to-Risk Ratio: With entry near 1.17865, risk is around 22 ticks while potential reward is about 39 ticks, yielding a favorable R:R of almost 2:1.
Risk caveat: Right below the gap origin lies a UFO support area. This means price may stall or reverse after the gap is filled. Being conservative with the target is wise—seeking deeper downside could run into structural support.
Contract Specs and Margin Notes
Understanding the contract structure is vital when applying risk management.
o Euro FX Futures (6E):
Contract size = €125,000
Tick size = 0.00005 USD per euro = $6.25 per tick
Initial margin (approximate, varies daily): ~$2,500–$3,000
o Micro EUR/USD Futures (M6E):
Contract size = €12,500 (1/10th of 6E)
Tick size = 0.0001 USD per euro = $1.25 per tick
Initial margin (approximate, varies daily): ~$300–$400
Application: Traders with smaller accounts can use M6E to size positions more precisely, while larger participants may choose 6E for liquidity. Micros provide flexibility to scale in/out of trades while maintaining strict risk per trade.
Risk Management Essentials
Risk management is not about avoiding losses—it is about ensuring that any loss remains controlled relative to potential reward. This trade idea highlights three core principles:
Stop placement by ATR: Volatility-based stops adjust naturally to current market conditions. Using 25% of a 2-day ATR prevents overexposure while respecting noise.
Position sizing: Traders should calculate how many contracts (6E or M6E) align with their personal risk tolerance.
Target discipline: While tempting to aim lower than the gap origin, technical evidence suggests price may encounter support there. Conservative targeting avoids overstaying a move.
Educational Takeaway
This setup demonstrates the power of multi-timeframe confluence. A weekly rejection signal provides context, while a daily gap gives tactical direction. Traders often gain an edge when higher timeframe sentiment (bearish rejection) aligns with lower timeframe imbalances (gap fill).
For students of price action, this is a reminder that candlestick patterns should never be taken in isolation. Instead, they should be validated by market structure, liquidity imbalances, or other confirming signals.
Conclusion
Euro FX Futures present a case study in how weekly rejection and daily gaps can combine to create a structured opportunity. While no outcome is certain, the confluence of signals here underscores the educational value of analyzing shadows and gaps together.
Traders can study this setup not only as a potential trade but also as a lesson in disciplined multi-timeframe analysis.
When charting futures, the data provided could be delayed. Traders working with the ticker symbols discussed in this idea may prefer to use CME Group real-time data plan on TradingView: www.tradingview.com - This consideration is particularly important for shorter-term traders, whereas it may be less critical for those focused on longer-term trading strategies.
General Disclaimer:
The trade ideas presented herein are solely for illustrative purposes forming a part of a case study intended to demonstrate key principles in risk management within the context of the specific market scenarios discussed. These ideas are not to be interpreted as investment recommendations or financial advice. They do not endorse or promote any specific trading strategies, financial products, or services. The information provided is based on data believed to be reliable; however, its accuracy or completeness cannot be guaranteed. Trading in financial markets involves risks, including the potential loss of principal. Each individual should conduct their own research and consult with professional financial advisors before making any investment decisions. The author or publisher of this content bears no responsibility for any actions taken based on the information provided or for any resultant financial or other losses.
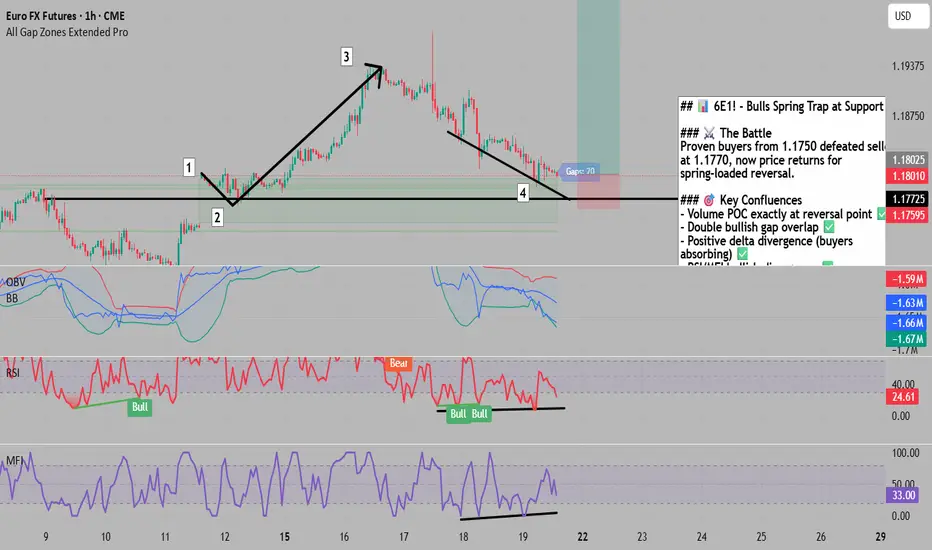
Bulls Trap Bears at Multi-Level Support - Coiled Spring📊 **To see my confluences and/or linework, step 1: grab chart, step 2: unhide Group 1 in object tree, step 3: hide and unhide specific confluences.** 😊
Title: 🎯 6E1!: Bulls Trap Bears at Multi-Level Support - Coiled Spring
The Market Participant Battle:
At point 4 (1.1770-1.1780 area), we're witnessing a critical moment where proven buyers from point 2 (1.1750) have successfully trapped aggressive sellers who pushed from point 1 (1.1850). These bulls defeated the bears during the initial test, and now with price returning to this battlefield, we expect a powerful upward reversion as trapped shorts are forced to cover and new buyers join the proven winners. The setup suggests a 150+ pip move back toward the 1.1920-1.1950 area.
Confluences:
Confluence 1: Proven Market Participants Structure
The numbered sequence (1→4) reveals a textbook market participant trap. When point 3 closed above point 1, the buyers at point 2 became proven winners. Point 4 represents our return to these victorious bulls' territory, creating a high-probability reversal zone where smart money accumulates.
Confluence 2: Double Bullish Gap Overlap
Using the gap indicator, two bullish gaps converge precisely at point 4, indicating this zone previously saw explosive buying interest. Gaps often act as magnets and support, making this overlap a powerful bullish signal.
Confluence 3: Volume Profile POC Alignment
The fixed range volume profile from point 0 to 3 shows the Point of Control (POC) falls exactly at point 4. This represents the price level with the most traded volume - institutional battleground. Value Area Low aligns with point 2, confirming strong buyer presence.
Confluence 4: VWAP Standard Deviation Extreme
Price has pushed outside the 2nd standard deviation from VWAP anchored at point 3, indicating an extreme oversold condition. The slow pullback upward suggests mean reversion beginning.
Confluence 5: Bullish Imbalance & Delta Divergence
The large bullish bar at point 4 contains a stacked bullish imbalance. The last three red bars showed positive delta despite red closes - classic absorption pattern where buyers overwhelm sellers.
Confluence 6: Multiple Oscillator Divergences
RSI and MFI both make higher lows while price makes lower lows - bullish divergence. OBV has touched its lower Bollinger Band, historically marking reversals in Euro futures.
Web Research Findings:
- Technical Analysis: EUR/USD showing mixed signals with daily buy rating but hourly showing strong sell - typical of major reversal points
- Recent News/Earnings: ECB cut rates 25bps on January 30th to 2.75%, continuing easing cycle - supportive for eventual EUR strength as economy stabilizes
- Analyst Sentiment: 2025 forecasts range from 1.14-1.18, with support building at current levels
- Data Releases & Economic Calendar: Eurozone PMIs due January 24th - improvement expected to relieve selling pressure
- Interest Rate Impact: ECB at 2.75% vs implied Fed funds around 4%, but gap narrowing as ECB approaches neutral rate
Layman's Summary:
Think of this like a tug-of-war where the bulls just proved they're stronger at the 1.1770 level. The bears tried to push lower but are running out of steam (shown by positive buying despite red candles). With the ECB done with aggressive cuts and technical indicators screaming oversold, it's like a spring being compressed - ready to snap back higher.
Machine Derived Information:
- Image 1: Volume Footprint showing absorption at 1.1801 level with Delta patterns - Significance: Major institutional buying zone confirmed - AGREES ✔
- Image 2: Hourly chart showing symmetrical triangle pattern from points 1-4 - Significance: Compression pattern ready for explosive move - AGREES ✔
Actionable Machine Summary:
The machine analysis confirms heavy institutional accumulation at these levels. The volume footprint reveals progressive buying absorption, while the price structure shows a textbook accumulation pattern. Combined with multiple technical divergences, the AI assessment strongly supports a bullish reversal scenario.
Conclusion:
Trade Prediction: SUCCESS
Confidence: High
The confluence of proven buyer support, volume profile POC, multiple divergences, and extreme oversold conditions creates a compelling long setup. Risk/reward favors bulls with 30 pip stop below 1.1740 targeting 150+ pips to 1.1920-1.1950.
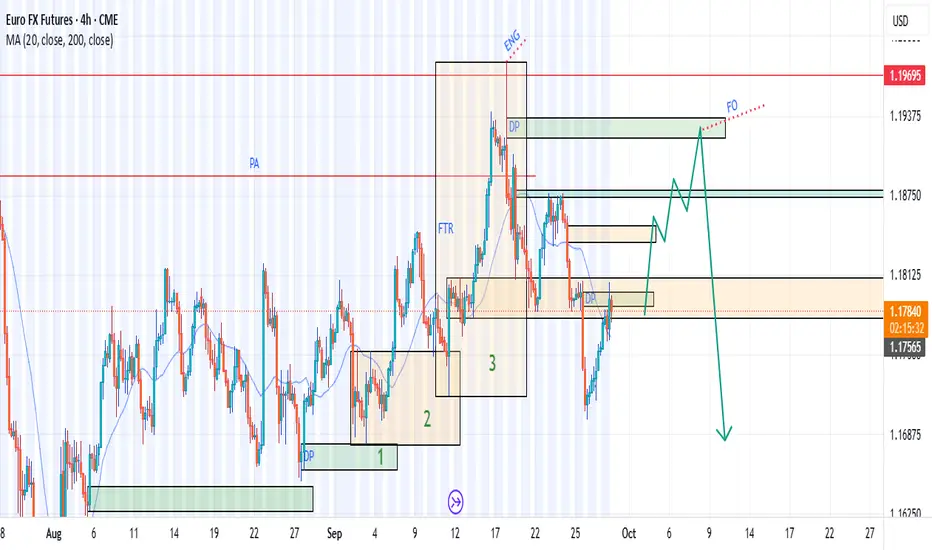
EURUSD These two scenariosThese two scenarios are possible: either go from here to target the ceiling, or correct to the beginning of the compression zone.

EUR Futures analysis I am looking for to continuing compression at EUR futures (EurUsd) chart
According to Engulf of the lower flag limit; i am waiting for continue drop.
This analysis could mean that US inflation could spike again on Thursday's news.
We'll just have to wait and see.
