Overextended Markets (Overbought And Oversold)1) Bollinger Bands:
Some traders will determine the market as "over-extended"
when the price is piercing above or below the Bollinger bands.
If above then the price is considered overbought and price may start to reverse.
If below then the price is considered oversold and the price may start to reverse.
2) Stochastic RSI:
some traders will determine the market as "over-extended" once the price is over the 70% line or below the 30% line.
The bottom 30% means the price might be oversold and buyers are projected to come in.
When the price is above the 70% line the market is considered overbought and sellers are projected to come in.
3) Supply And demand
When we have 3x continuation patterns in a row DBD or RBR in a row, we can draw a downward or upward aggressive trend line (momentum line).
When this happens, we consider the market overextended and call it the “elastic band effect”.
stretch out an elastic band to the breaking point and let go, the elastic band snaps back at a high-speed force and hurts.
This is the same for trading, When the market is overextended and breaks the downward or upward momentum line, we can assume the market will snap back and remove 2 if not 3 of the opposing zones that gave us the ability to draw the aggressive momentum line.
Buying or selling the pullback into the demand or supply is usually a good call if the criteria are met for a good trade.
6S1! trade ideas

CHF SWISS Futures Supply And Demand analysis-CHF very weak currency. I'm not about to go
and call the bottom of the and neither should anyone.
What I notice is price has created 4x DBD supply zones
in a row which allows us to consider the market overextended,
and we have the ability to draw an aggressive downward ML.
-Waiting for price to have the "elastic band effect"
and have price shoot up and break the aggressive downward ML +
remove an opposing zone.
-A quality DBR must be created from that and then
I will look for a potential swing trade.

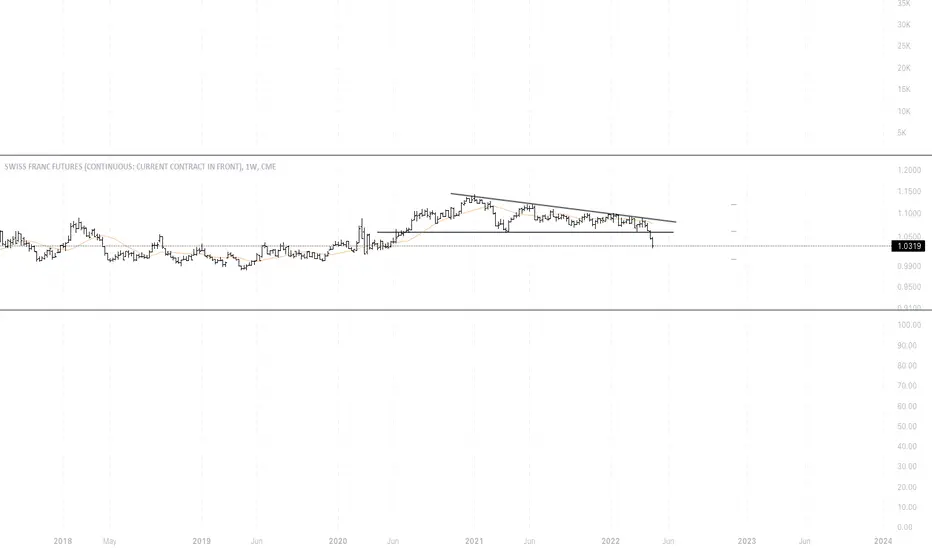
Swiss Franc Future: Descending TriangleMain Patter: Weekly Descending Triangle
Half target reached
Last target 1.0150
CHF LONG POSITIONABCDEFGHIJKLMNOP.....It's a leading indicator of economic health - businesses react quickly to market conditions, and their purchasing managers hold perhaps the most current and relevant insight into the company's view of the economy;
====> PLEASE IGNORE THE NOTES. I'm lazy when I have to write messes up in my brain.


6sWe notice that the Swiss Franc broke a very important price channel and came back and retested, which gives us a good opportunity to sell. The targets are clarified.

6S Daily at low priceThe 6S Daily time frame is in an up trend. The
market is making higher highs and higher lows.
The market is near a low price. It will be a good
idea to turn to the one hour time frame and look
for low prices in the buy zone. The daily is showing
a longer term bullish push towards 1.1563 about
+701 Ticks away.

Buy Swiss franc futures (JUN2021)Buy from current and 1.0462, stop 1.0372, target 1.1255
Purchases from weekly and monthly commercial interests.
The risk is 70% of the total.
Stop for a cluster of monthly volume .
I will close 50% of the position at 1.0889

Buy Swiss Fraanc futures (JUN 2021)Buy from current and 1.0660, stop 1.0571, target 1.1255
Shopping from weekly commercial interests.
The risk is 70% of the total.
Stop for a cluster of monthly volume.
I will close 50% of the position at 1.0965

Buy Swiss Franc (MAR 2021)Buy from current and 1.0830, stop 1.0772, target 1.1232
Purchase and additional position from monthly commercial interests.
The risk is 0.7% of the total.

Buy Swiss Franc futures (MAR2021)Buy from 1.0963 and 1.0930, stop 1.0898, target 1.1158
Limit purchases from the zone of monthly commercial interest for the purchase.

Buy Swiss Franc (MAR2021)Buy from current, and 1.0988, stop 1.0963, target 1.1135
Repeated buying from the local low on high volumes. Weekly commercial interest in buying.


Possible H&SSame story as DXY. Possible H&S pattern. it's a reversal pattern, but if fails, then price target are somewhere around 1,15.
and here you can choose to trade usdchf or eurusd. the choice is yours


The decline is not over yet. ExplainedSwiss Franc futures dropped as it was forecasted. I think the decline is not over yet. We can see a small rally followed by the next wave down. The 1.0700 range was strong resistance and there is a big chance it will be tested again. Commercials are still short this market, seasonal tendency is to the downside. However, Insider Accumulation is turning neutral from bearish. With that in mind and a bit more cautious, we want to look for and take sell signals. Besides, Wyckoff distribution is in the process and we still can make money shorting Swiss Franc futures.

swiss franc (6S) down for long !!!!we have a great breaking of the rectangle wich mean the market will go to the resistance (1) . so if the market breaks the first resistance (the target) it will go down to the resistance number (2) . So if you have a suggestion or advice leave it in the comments . and if you like my analysis break the 'Like' button s


Big move is coming. ExplainedIt has been a long time since my last analysis of the Swiss Franc. This market is set up for a decline. The COT report is very bearish, our valuation model shows CHF is way overvalued. Cycles and seasonal and Intermarket forecasts show a potential decline almost till the end of this year. Everything is very bearish. Sounds too good to be true. We have signs of Wyckoff distribution on a daily chart. The short-term oscillator is oversold. So, there is a possibility we will see a rally coming few sessions followed by the formation of a sell signal.

CONTRAT A TERME EN FRANCS SUISSES DAILY ANALYSISHi friends
the daily chart of this market will experience with a very high probability an uptrend in the next few days but at the same time it is better to be vigilant of the change towards the opposite direction of the market
please subscribe to receive new analyzes


Long AgainDISCLAIMER :
The content on my TRADINGVIEW profile is for informational and educational purposes only and is not and should not be construed as professional financial, investment, tax, or legal advice. Trading has large potential rewards but also large potential risk. Do not trade with money that you cannot afford to lose. The past performance of any trading idea is not indicative of future results.
