17/12/2025 $BTC - $DXY -$SPX - $NDX - $GOLD forecastGold and Bitcoin should be the sole indexes witnessing a correction tomorrow. overall bullish energy will keep accompaining Bitcoin until the next week, but for what concerns tomorrow the trend should be downwards oriented
Related futures

BTC1!Risked ~800 down for 4,000 - 8,000 up from high 85s yesterday, even from this current juncture it's an appealing R/R if risking 2,800 down (invalidated on new lows) for 7,000 (Yearly Open test) up. I believe 2025 closes very close to its open as that's probably the most ironic outcome despite the ro

Tokenization Push by US Government Will Unleash a Demand ShockCME: Micro Bitcoin Futures ( CME:MBT1! ) and Micro Ether Futures ( CME:MET1! )
On December 8th, U.S. Commodity Futures Trading Commission (CFTC) announced the launch of a digital assets pilot program for certain digital assets, including BTC, ETH, and USDC, to be used as collateral in derivatives

BTC CME GAP (4H)Bitcoin has a CME gap in the $89,805 – $89,425 range
These gaps are usually filled before the price makes its next move.
Let’s see what happens.
For risk management, please don't forget stop loss and capital management
Comment if you have any questions
Thank You

Bitcoin is waving a flag, but it's not the kind to saluteThe daily chart is indicating a textbook bear flag pattern breaking down.
A bear flag is a bearish continuation setup characterized by:
- Sharp sell-off (flagpole)
- Small upward/sideways consolidation (flag)
- Directional breakdown lower
This pattern often signals short-term downside momentum and

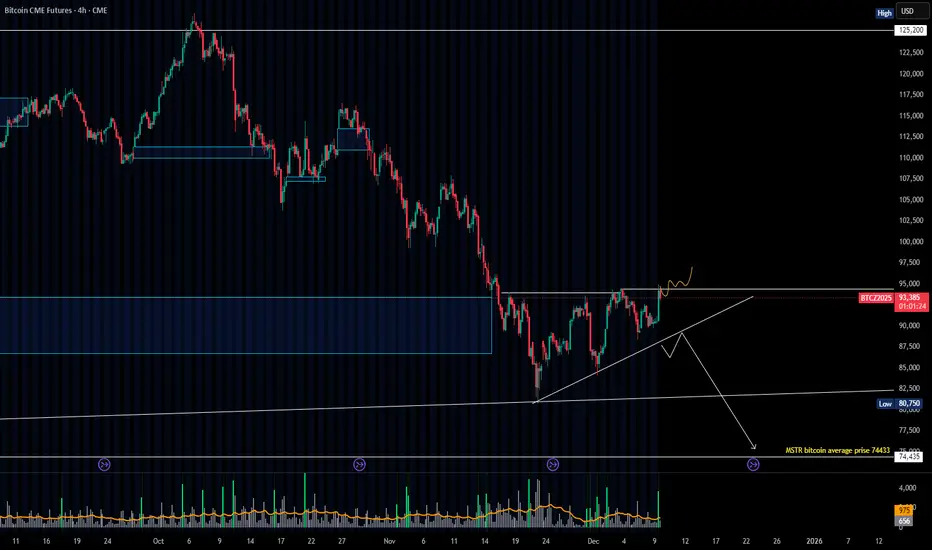
max pain in sight for the bullsgm,
i've been entertaining a few ideas on btc, and this one comes to mind today.
the possibility of 1 more leg down, to take the rest of the longs that fomoed into the rally this week, and the few who managed to survive the drop from ath by averaging down mindlessly.
---
the way we bounced is ve

BTC CME: Key Level Retest and Liquidity SweepBTC CME demonstrated strong growth today on increased volume, reaching last week’s highs and sweeping liquidity.
Currently, the asset is trading directly inside last week’s high zone. I’m waiting for today’s daily close to define the next direction.
Bullish scenario: Daily close above the level wi
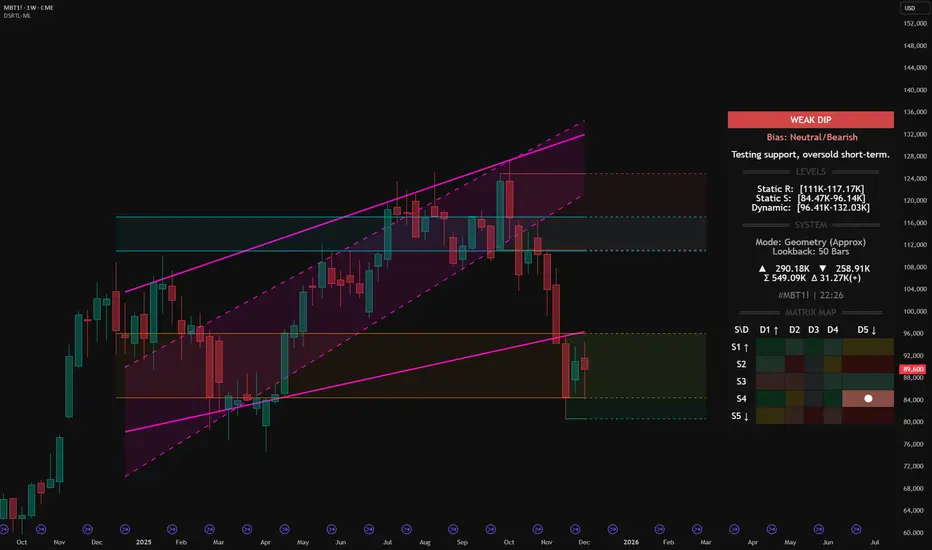
Micro Bitcoin Futures (MBT1!) – DSRTL‑ML Weak Dip at supportMicro Bitcoin Futures (MBT1!) – DSRTL‑ML Weak Dip at S4–D5 Support
We are analyzing the weekly structure of Micro Bitcoin Futures (MBT1!) using the institutional DSRTL‑ML support/resistance engine. On this bar the indicator classifies the state as WEAK DIP with a Neutral/Bearish bias and the syste
BTC CME Futures: The Capitulation Buy SetupSimply:
The logic here is simple.
Bitcoin has dropped too far and too fast.
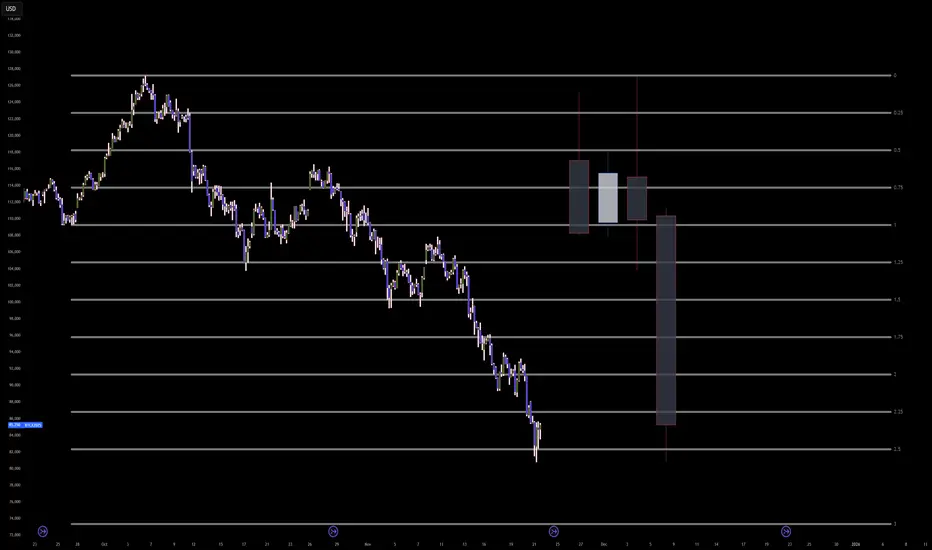
We are currently hitting a major mathematical exhaustion point (the 2.5 Standard Deviation line).
At the same time, we are entering that big blue support box between 78k and 82k where the massive rally started earlier th
BTC Update (3 hr)MFI oversold on 3 hr, RSI probably hits it too. Then we get another bounce, but daily MFI is getting close to overbought, so I didn't play it.
So far it looks like it;s just drifting sideways.

See all ideas
A representation of what an asset is worth today and what the market thinks it will be worth in the future.
Displays a symbol's price movements over previous years to identify recurring trends.
Frequently Asked Questions
The nearest expiration date for Micro Bitcoin Futures (Feb 2025) is Feb 28, 2025.
Traders prefer to sell futures contracts when they've already made money on the investment, but still have plenty of time left before the expiration date. Thus, many consider it a good option to sell Micro Bitcoin Futures (Feb 2025) before Feb 28, 2025.