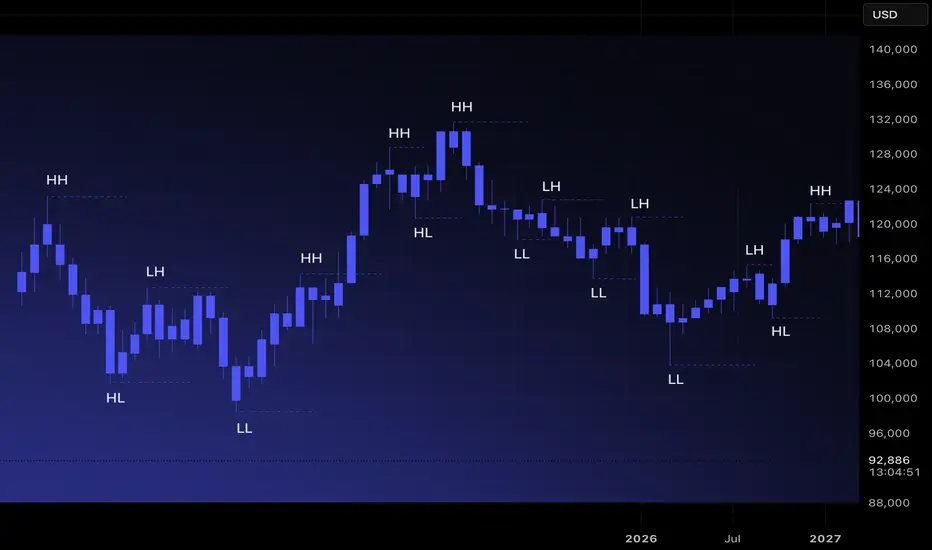
Market Structure 101: Navigating Price ActionMost traders jump directly into indicators, oscillators, or patterns. Yet every chart has a deeper foundation that determines direction long before any tool is applied. Market structure is that foundation. When you understand how price forms highs, lows, and transitions between them, you stop reacti
Related futures
BTC over view. I've been away from the charts for most of the year but I feel like it's time. price hasn't really done anything significant still tradaing around the yearly open. Theres a lot of potential in the market, BTC dominance dinamic could be about to change.
I don't know if I'm back, but I'm definitely i

BTC Death Cross and Filling CME GapHello traders,
Well BTC is in a pickle.. Its lost 100K and the death cross is about to occur by Sunday 11-16-2025. A deathcross is when the 50DMA crosses the 200DMA. Sounds ominous but for bitcoin many times it has market the bottom before it reverses higher. Whats even more crazy is Bitcoin always

Triple Gap and yearly BounceThere's quite a bundle of supports here and if we get a bounce the target will most likely be the unclosed CME gap at 117k. The price could still go a bit lower but I don't think by that much. I don't expect this rally to be as strong as the last BTC idea I had but I expect alts to go up if we get a

BTC (MBT) on the way ot 86'000Price reacted very well at the white and red fork lines (see arrows).
We have left the white centerline, and now price is hovering around the red one. If we get an open and close below it, we’ll have a new target: the WL1 of the white fork, which unsurprisingly, lines up with the red L-MLH.
Rough

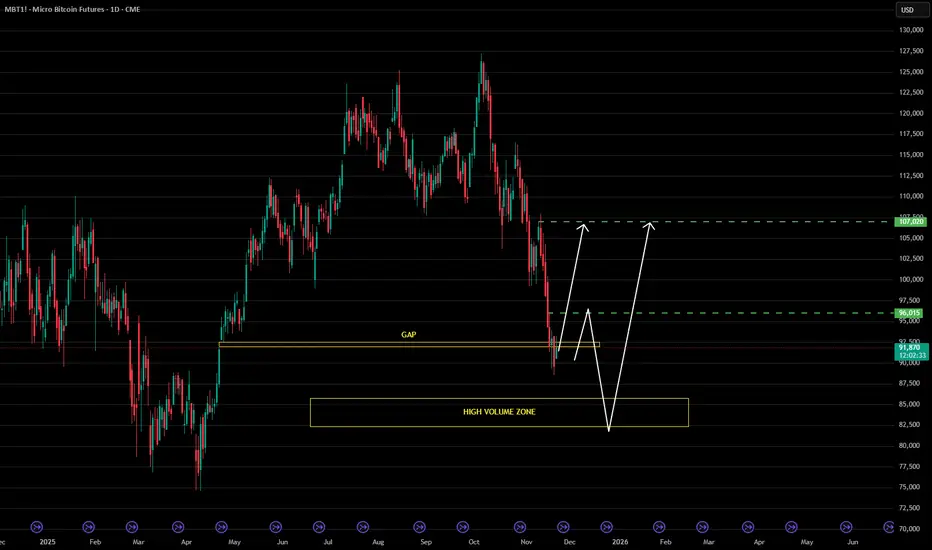
Bitcoin: Two Development Scenarios from Gap Closure ZoneCurrent Situation
Bitcoin has completed a sharp decline and is located in the critical gap closure zone. The chart shows two key technical elements: a resistance level in the upper part of the range and a high volume zone (HIGH VOLUME ZONE) significantly below current prices. Price has stopped preci
Bitcoin Holds 90k (For Now), 70k A Real PossibilityMy bearish bitcoin target outlined in the middle of October came to fruition this week. I update my levels and technical reasoning as to how it could still head for 70k after a potential bounce.
Matt Simpson, Market Analyst at City Index

BTC Analysis | CME GapHello friends
Bitcoin’s critical gap between $91,500 and $92,500 could serve as a short-term correction target if selling pressure continues.
A gap that closes could set the stage for a bottom and a continuation of the uptrend.
The price’s reaction to this area will determine the market’s next di

BTC’s Toxic Relationship with Support LevelsMarket Prophecy is back
Price made a rejection on the weekly timeframe and successfully broke through daily support at 98,920. Now, it looks like BTC might pull a classic move—retracing to the 50–61.8% Fibonacci zone, just like its previous wave—before continuing its dramatic dive toward the next s

_Bitcoin CME Gap Update
CME Gap is open and almost ready to fill ranging at 92,600 - 92,115 panda fam possible one reason why price aggressively drop in recent days, week, & months. 🚩
Same time panda fam yung main own strat natin na PBr1 also at 95,835 - 93,525 possible price will bounce same time but wag lang sana bounc

See all ideas
Summarizing what the indicators are suggesting.
Neutral
SellBuy
Strong sellStrong buy
Strong sellSellNeutralBuyStrong buy
Neutral
SellBuy
Strong sellStrong buy
Strong sellSellNeutralBuyStrong buy
Neutral
SellBuy
Strong sellStrong buy
Strong sellSellNeutralBuyStrong buy
A representation of what an asset is worth today and what the market thinks it will be worth in the future.
Frequently Asked Questions
The current price of Micro Bitcoin Futures (Sep 2026) is 89,425 USD — it has fallen −2.08% in the past 24 hours. Watch Micro Bitcoin Futures (Sep 2026) price in more detail on the chart.
Track more important stats on the Micro Bitcoin Futures (Sep 2026) chart.
The nearest expiration date for Micro Bitcoin Futures (Sep 2026) is Sep 25, 2026.
Traders prefer to sell futures contracts when they've already made money on the investment, but still have plenty of time left before the expiration date. Thus, many consider it a good option to sell Micro Bitcoin Futures (Sep 2026) before Sep 25, 2026.
Buying or selling futures contracts depends on many factors: season, underlying commodity, your own trading strategy. So mostly it's up to you, but if you look for some certain calculations to take into account, you can study technical analysis for Micro Bitcoin Futures (Sep 2026). Today its technical rating is strong sell, but remember that market conditions change all the time, so it's always crucial to do your own research. See more of Micro Bitcoin Futures (Sep 2026) technicals for a more comprehensive analysis.