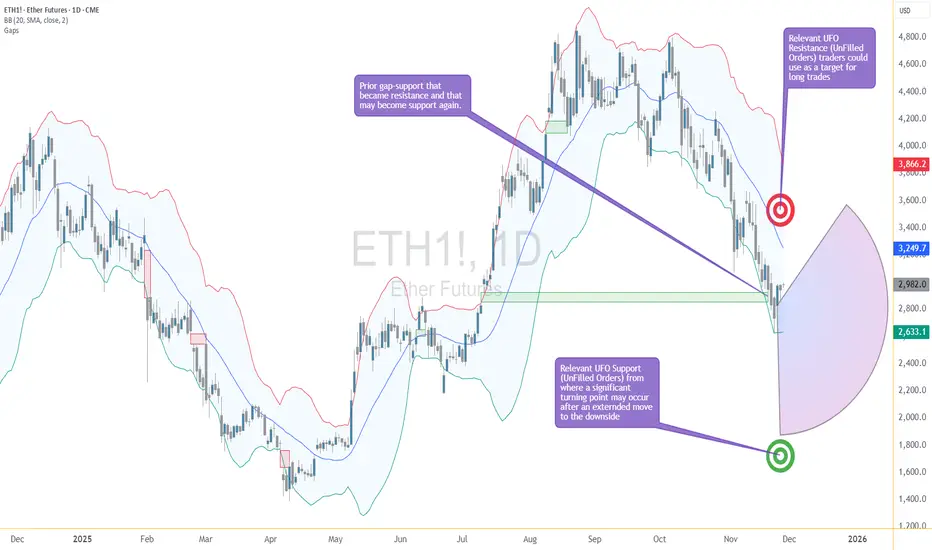
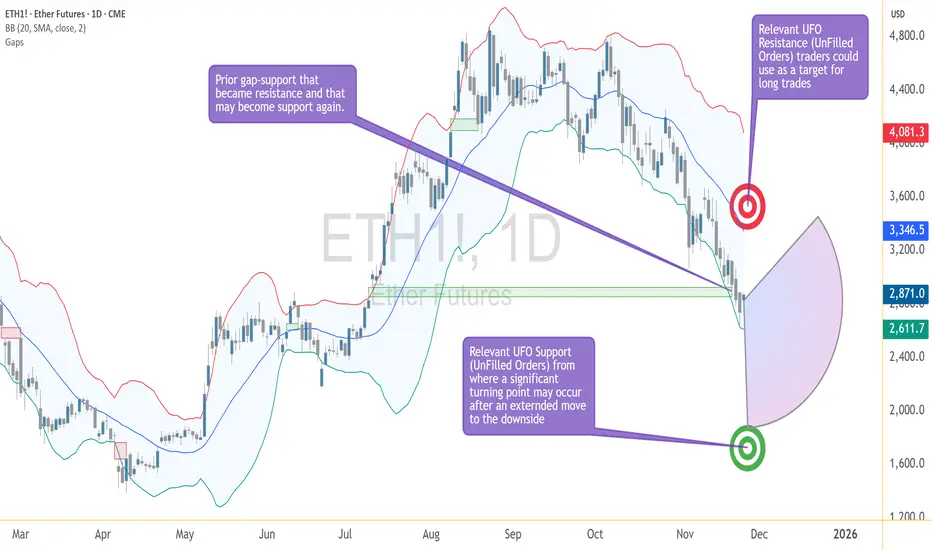
Ether Breaks the Ceiling: Is This the First Real Clue of a Turn?Ether Futures just pulled an interesting move — it finally pushed above the upper edge of the stubborn gap that has been capping price below 2853.5.
For a while, ETH was sliding down the lower Bollinger Band like a chilled skier who forgot how to turn. Now? It just jumped over the fence.
This changes things. A gap break doesn’t guarantee a trend reversal, but it’s the market’s way of saying:
“Hey, sellers… your seat might not be reserved anymore.”
The Old Barrier Is Now the New Test
That closed gap was acting like a reinforced ceiling. Buyers hitting their heads on it didn’t get far — until now. Trading above 2853.5 means the market is testing whether:
Sellers still have ammunition
Buyers can hold the reclaimed turf
Momentum is finally shifting gears
A close and hold above this zone is usually where early reversal logic starts to form.
Next Target: UFO Resistance at 3376.5
If buyers keep control, the next structural “magnet” is near 3376.5, where a cluster of unfilled sell orders waits. Markets love revisiting old unfinished business, and this is the next shelf of potential friction.
It’s not a prediction — it’s just where the roadmap naturally leads once the gap breaks.
Support Below: The New Battleground
What used to be resistance is now a potential support zone. If price pulls back toward the gap’s top edge and stabilizes, it would confirm that buyers have actually taken the wheel.
If price slips back into the gap, then this “break” was just a false alarm — the chart equivalent of stepping on a stair that wasn’t actually there.
Two Quick Read-Through Scenarios
Scenario 1 — Reversal Gains Traction
ETH stays above 2853.5
Buyers defend the reclaimed gap
Market may gravitate toward 3376.5
This would suggest the downtrend is losing its grip.
Scenario 2 — Rejection Back Into the Gap
ETH falls back below the gap ceiling
Sellers reclaim control
Market may return to prior support zones
This would keep Ether in a broader corrective environment.
The key here is not guessing — it’s waiting to see whether the breakout holds.
Futures Traders Have Two Contract Sizes to Play With
Ether Futures (ETH) are the big, fast movers.
Micro Ether Futures (MET) offer the same chart logic, but at 1/500th the size, which makes scaling more controlled.
Whether large or micro, the structure is the same — only the sizing changes.
Quick Specs (Fast & Simple)
ETH contract: 50 Ether
Tick: 0.25 per Ether = $12.50 per contract
Margin: ≈ $44,000 (varies)
MET contract: 1/500th of ETH (good for precision adjustments)
Bottom Line — The Story Just Got Interesting
For the first time in a while, Ether has stopped drifting and started acting. Breaking above the upper gap is the market’s first real sign of a potential power shift.
Now the question becomes simple:
Can buyers hold the line they just captured?
If yes → the path toward 3376.5 opens.
If no → the market falls back into its old bearish rhythm.
Either way, the quiet slide is over — this is where things get lively.
Want More Depth?
If you’d like to go deeper into the building blocks of trading, check out our From Mystery to Mastery trilogy, three cornerstone articles that complement this one:
🔗 From Mystery to Mastery: Trading Essentials
🔗 From Mystery to Mastery: Futures Explained
🔗 From Mystery to Mastery: Options Explained
When charting futures, the data provided could be delayed. Traders working with the ticker symbols discussed in this idea may prefer to use CME Group real-time data plan on TradingView: www.tradingview.com - This consideration is particularly important for shorter-term traders, whereas it may be less critical for those focused on longer-term trading strategies.
General Disclaimer:
The trade ideas presented herein are solely for illustrative purposes forming a part of a case study intended to demonstrate key principles in risk management within the context of the specific market scenarios discussed. These ideas are not to be interpreted as investment recommendations or financial advice. They do not endorse or promote any specific trading strategies, financial products, or services. The information provided is based on data believed to be reliable; however, its accuracy or completeness cannot be guaranteed. Trading in financial markets involves risks, including the potential loss of principal. Each individual should conduct their own research and consult with professional financial advisors before making any investment decisions. The author or publisher of this content bears no responsibility for any actions taken based on the information provided or for any resultant financial or other losses.
Trade ideas
Crypto Walking the Edge: Will the Band Snap or Stretch Lower?Ether Futures (ETH) continue to tell a story of controlled pressure — one that traders have seen before across many markets, but rarely with this level of composure. The selling has been persistent, yet measured, and despite the depth of the decline, Ether has remained remarkably disciplined within its volatility structure. In short, price is walking the lower Bollinger Band — and doing it with intent.
The Market’s Controlled Descent
When an asset walks the lower Bollinger Band, it signals a market under steady directional momentum. The band represents volatility boundaries built around a moving average; hugging its lower edge reflects consistent downside force without capitulation. In Ether’s case, the message is clear — bears are in charge, but not panicking.
This pattern of orderly decline can be deceptive. It often convinces traders that “it can’t go lower” simply because volatility seems contained. Yet, in technical behavior, containment isn’t comfort — it’s momentum management. Until the market detaches from the band and closes above the midline, downside potential remains valid.
The Downside Magnet — UFO Support at 1883.0
Beneath the current price structure lies a level of particular interest: 1883.0. This is not just another number on the chart; it marks a UFO (UnFilled Orders) zone — an area where unexecuted buy orders from prior trading sessions may still be sitting.
Such levels often act as demand magnets. Price gravitates toward them as liquidity seeks to rebalance. If ETH continues its gradual descent, 1883.0 could act as a “final test” of demand strength. Traders currently short may view this area as a logical place to take profits or reduce exposure, while contrarian participants might monitor it for early signs of stabilization.
Walking the Edge — Bollinger Band Dynamics
The Bollinger Band is more than a volatility envelope; it’s a behavioral tool. Price hugging the lower band isn’t a reversal signal on its own. It shows persistent imbalance — sellers are comfortable pressing until they meet true counterflow demand.
The key observation isn’t where Ether trades, but how it interacts with the band:
If the band widens while Ether stays glued to its edge, volatility expansion favors continuation.
If the band narrows and Ether starts oscillating away from it, compression signals the potential for reversal.
At present, Ether remains on the outer lane — still walking the edge, with no confirmed volatility squeeze yet in play.
The Reversal Trigger — The Gap Between 2853.5–2769.0
Ether’s chart carries memory — and that memory is marked by the closure of a previously open gap between 2853.5 and 2769.0. Gaps represent unbalanced zones where the market skipped transactions, often leaving behind psychological resistance.
As long as ETH remains below 2769.0, bearish pressure dominates. A decisive close through the 2853.5 boundary would, however, suggest sellers have lost control. That event could flip the zone from resistance to support — the technical definition of a reversal confirmation.
Until that happens, Ether continues to operate in a bearish environment within its Bollinger framework, respecting lower boundaries and testing demand without capitulation.
The Upside Magnet — UFO Resistance at 3376.5
If the market does achieve a confirmed reversal through the gap zone, the next structural target stands near 3376.5. This region contains a UFO resistance cluster, where unfilled sell orders may wait to re-engage.
This becomes the “upside magnet” in the event of a bullish shift. Not as a forecast, but as a conditional marker — if price proves it can break through 2853.5, the 3376.5 zone becomes the next logical test for momentum sustainability.
Case Study: Risk Structure and Trade Framing
The beauty of futures markets lies in flexibility. Traders can define clear structural zones, build conditional scenarios, and design reward-to-risk ratios before any entry occurs. Ether’s chart currently offers two educational case studies:
Scenario 1 — Continuation Setup
If ETH continues trading below 2769.0, the bearish structure remains intact. Traders could study how price behaves as it approaches 1883.0 to understand profit-taking dynamics or potential trend exhaustion.
Scenario 2 — Reversal Setup
If ETH breaks and closes above 2853.5, the tone changes. It implies the market has absorbed overhead supply, opening the path toward 3376.5. In this case, risk would typically be defined below the reclaimed gap zone, maintaining a controlled risk ratio.
Whichever scenario unfolds, the discipline lies not in prediction but in preparation — in defining “if this, then that” logic.
Contract Specifications
To understand how traders express these views, it helps to revisit how Ether Futures work on CME.
Ether Futures (ETH)
Contract size: 50 Ether with a minimum tick: 0.25 per Ether = $25 per contract
Trading hours: Nearly 24 hours a day, Sunday to Friday, on CME Globex
Margin requirement: approximately $44,000 per contract (subject to changes)
For traders seeking smaller capital exposure, CME also lists Micro Ether Futures (MET) — 1/500th the size of the standard contract. This smaller format offers precision for testing setups, scaling positions, or managing margin during high volatility periods. Importantly, both ETH and MET track the same underlying price behavior, allowing consistent technical interpretation across sizes.
Managing Risk — Beyond Price Targets
Regardless of contract size, effective futures trading is a balance between conviction and constraint. Every trade requires three coordinates before execution:
Entry — based on objective price structure or confirmation.
Exit — determined by invalidation, not emotion.
Size — calibrated to volatility and margin.
A well-structured plan incorporates all three. For instance, a trader eyeing ETH’s move toward 1883.0 should define exit conditions before entry — not after volatility spikes. The same logic applies if Ether were to reclaim 2853.5 and aim higher; stop placement must be systematic, not spontaneous.
Ether Futures in Market Context
Ether’s futures market has become one of the clearest barometers of institutional sentiment in crypto. It reflects not retail enthusiasm but structured positioning, hedging, and liquidity management. The current price behavior — a slow, calculated descent — signals strategic repositioning rather than panic liquidation.
This distinction matters. Markets driven by liquidation collapse violently and rebound sharply. Markets driven by reallocation, like the current Ether environment, tend to evolve gradually — a series of tests, pauses, and measured reactions. Recognizing this tempo helps traders align their strategies with the rhythm of institutional order flow.
Summary — The Market Still Walking the Edge
Ether’s structure can be summarized in three key technical zones:
1883.0: Demand magnet and potential exhaustion level.
2853.5–2769.0: The gap resistance band — critical reversal gate.
3376.5: Major resistance cluster and next test if reversal unfolds.
As long as Ether remains below the gap zone, momentum remains under bearish control. If it trades through and holds above, a structural shift may begin. Until then, the market keeps “walking the edge” — respecting volatility, testing support, and waiting for conviction.
When charting futures, the data provided could be delayed. Traders working with the ticker symbols discussed in this idea may prefer to use CME Group real-time data plan on TradingView: www.tradingview.com - This consideration is particularly important for shorter-term traders, whereas it may be less critical for those focused on longer-term trading strategies.
General Disclaimer:
The trade ideas presented herein are solely for illustrative purposes forming a part of a case study intended to demonstrate key principles in risk management within the context of the specific market scenarios discussed. These ideas are not to be interpreted as investment recommendations or financial advice. They do not endorse or promote any specific trading strategies, financial products, or services. The information provided is based on data believed to be reliable; however, its accuracy or completeness cannot be guaranteed. Trading in financial markets involves risks, including the potential loss of principal. Each individual should conduct their own research and consult with professional financial advisors before making any investment decisions. The author or publisher of this content bears no responsibility for any actions taken based on the information provided or for any resultant financial or other losses.
Eth's CME Gaps: Don't bet against themThis chart plots all of Eth's CME gaps historically (filled and unfulfilled), and calculates the probability of a gap being filled across various time frames (see the chart on the top-right). Currently unfilled gaps are plotted as thick-dotted lines continuing up to the current time. Filled gaps are represented by thin solid lines, terminating at the point where they were filled. The color of the line matches the color of the time frame defined in the legend.

ETH1!GAP AND 0.61 FIBBO INTERESTING POINT REMEMBER GAP CLOSE ALWAYS gap´always close all chart is similar . review by backtesting.

Price moves in a very specific way...In this short video I go through a bit of lower timeframe price action on the ETH futures chart.
Yeah, it is pretty straight forward and is just another example of price moving in terms of liquidity, efficiency, and fair value on a fractal nature.
R2F Trading

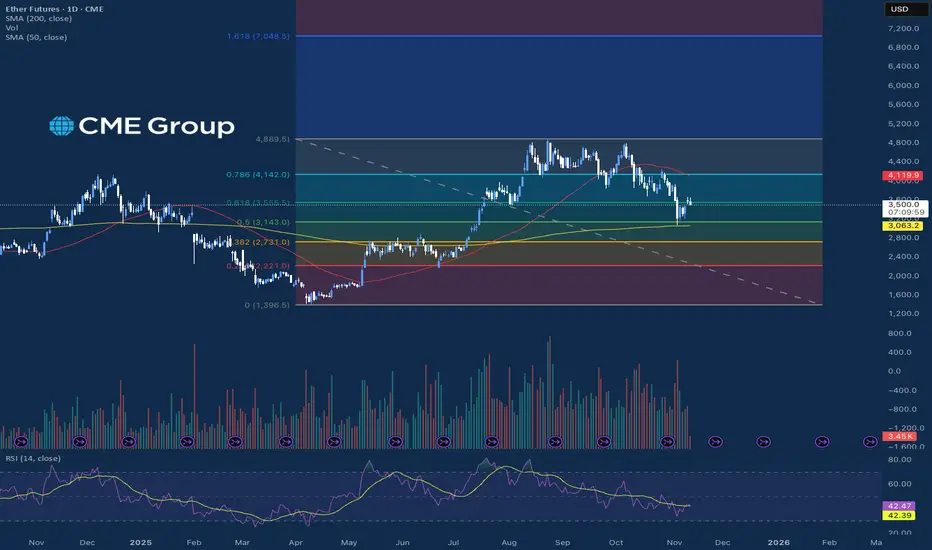
Ether Futures On The MoveEther futures experienced a highly volatile start to November, characterized by a sharp mid-month sell-off that erased strong gains made in late October. After peaking above the $4,700 level, the price quickly reversed, plunging toward 3,800 as global market risk sentiment deteriorated following cautious guidance from the U.S. Federal Reserve. The correlation with major tech indices remained a significant factor, leading to amplified selling when the broader equity market pulled back. Despite this volatility, Ether futures stabilized near the $4,000, suggesting that fundamental institutional support prevented a full trend collapse.
Ether futures selling pressure This sustained institutional presence remains the most critical factor in the market. Ether futures volume saw massive growth in October, showing increasing demand from professional and retail traders for regulated products. As shown in the chart, the 50% retracement level and the 200-day moving average are very close to each other and have acted as a support pocket since the breakout above the 200-day moving average in July.
*CME Group futures are not suitable for all investors and involve the risk of loss. Copyright © 2023 CME Group Inc.
**All examples in this report are hypothetical interpretations of situations and are used for explanation purposes only. The views in this report reflect solely those of the author and not necessarily those of CME Group or its affiliated institutions. This report and the information herein should not be considered investment advice or the results of actual market experience.
SP500, Euro, GOLD & Ether H1 - Daily Trade SetupsIn this update we review the recent price action in the SP500, Euro, Ether & Gold futures markets and identify the next high-probability trading opportunities and price objectives to target. To review today's video analysis, click here!

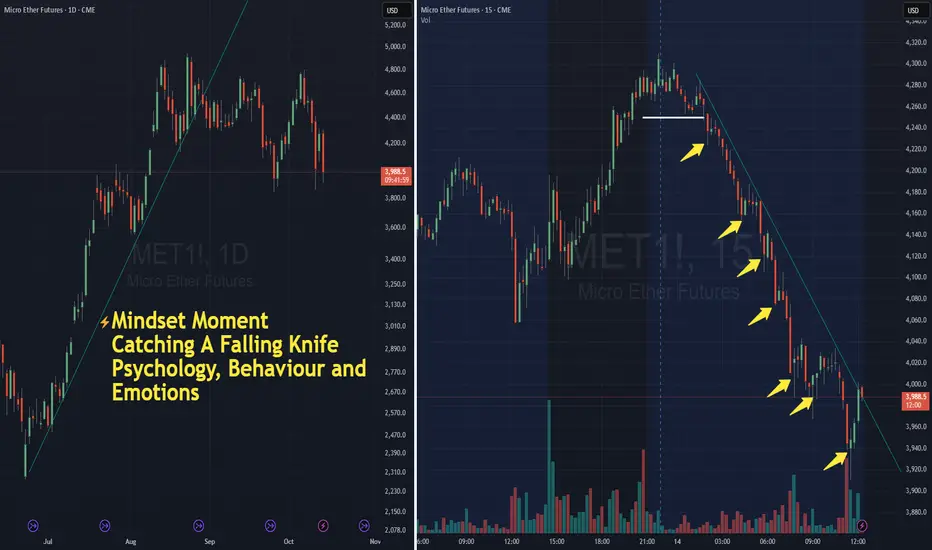
Catching a Falling Knife - The Illusion of OpportunityNOTE – This is a post on mindset and emotion. It is NOT a trade idea or system designed to make you money. My intention is to help you preserve capital, energy, and focus — so you can execute your own trading system with calm and confidence.
A sharp selloff.
Price is plunging.
The chart looks like it’s gone too far .
Your eye zooms in on that last swing low - “It has to bounce here.”
You tell yourself you’re being brave… opportunistic… disciplined even.
Beneath the surface, something else is driving the impulse.
A need to get involved and capitalize on opportunity
A need to relieve tension and fomo
A belief that there’s value here.
A sense of excitement. Things are moving.
A chance to make back all that I’ve lost before - plus more.
When markets fall fast, the nervous system reacts.
Adrenaline spikes.
The body wants to do something - to turn impulse into action.
To buy the bottom feels like you’ve beaten the market. That you’ve proven that you can do this and that you’re really really clever.
But every time you step in too soon, the same pattern repeats:
You’re not trading your process
You’re trading your emotions, your sense of self worth and lets be honest
Face it. You’ve been hijacked.
Body cues:
Eyes darting across screens, scanning for reversal signals.
Shoulders tense, leaning closer to the monitor.
A restless tapping of fingers or bouncing knee as you wait for confirmation.
Breath shortening, shallow and quick.
Underlying belief:
“If I can catch this, I’ll prove that I’m right”
How to shift it:
When you feel that urge to step in early, force a pause.
Name what’s really happening: “My mind wants action, and it wants to be right ”. Ask the question
“Do I want to be right or do I want to make money?”
Then redirect that energy toward process - not action.
Waiting doesn’t make you passive.
It’s an act of discipline and power.
Remember Eddie Murphy and Dan Ackroyd in Trading Places.
The art of waiting for the moment, and then engaging is the mark of a disciplined professional trader.
Stay safe out there and live to trade another day
For another related post, check out this one on buying the dip
ETHUSD Fractal Inverse H&S H1/D1 - Daily Trade SetupsIn this update we review the potential for a fractal inverse head & shoulders scenario looking at the Daily & Intraday price action and identifying the next high probability trading opportunity and price objectives to target. To review today's video analysis click here!

BTC1 & ETH1 Daily Trade Setups 1/10/25in this update we review ht ercent price action inBitcoin & Ether futures and identfy the next high probability trade setups and price objectives to target. To review todays video analysis click below!

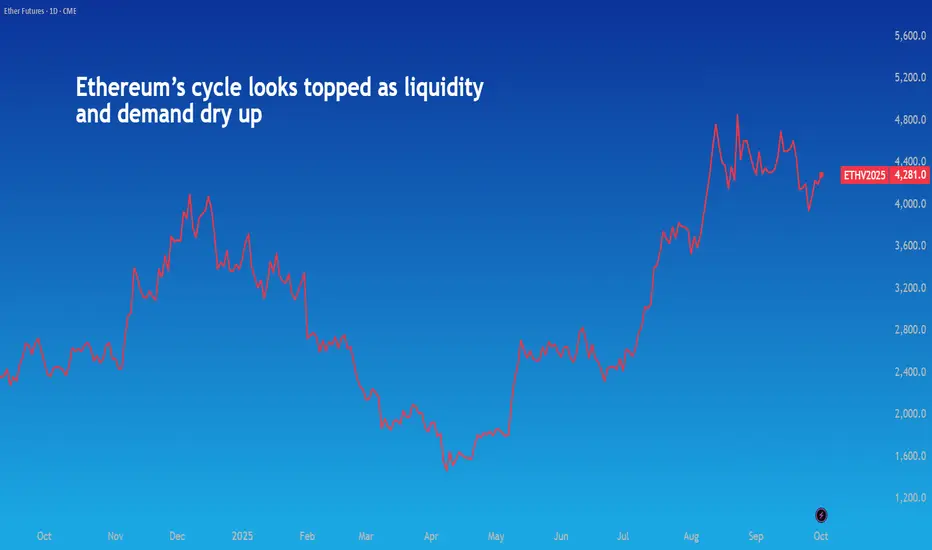
Ethereum’s cycle looks topped as liquidity and demand dry upCrypto bull markets tend to follow a script: Bitcoin outperforms Ethereum, the latter catches up along with altcoins, eventually ending its bull rally after hitting an all-time high.
In 2025, that pattern repeated, and Ethereum now looks caught at the end of its run. The network’s liquidity is vanishing, institutional positioning is turning cautious, and the mechanics of its own design are pushing it back into inflation.
Ethereum’s Fee Mechanics Reverse the Burn
Daily transactions on Layer-1 are holding near 1.6 million. The number of active Ethereum wallets has climbed to 127 million, marking a 22% increase over the past year, indicating sticky user activity.
Despite this, Ethereum has shifted back into a net inflationary phase, with ETH burns falling below issuance. The main driver for this is the historically low gas fees, which reduce the burn levels even when transaction volumes remain steady.
In February 2025, Ethereum expanded the network’s daily capacity by increasing its block gas limit, allowing more transactions in each block. Hence, while the number of transactions stayed roughly the same until May 2025, the total gas used per block rose significantly.
However, each unit of gas still cost less, which led to lower transaction fees and, crucially, less ETH being burnt. This shift tipped Ethereum back into net inflation; respite came starting in May until September with an increase in transaction volume, but we’re back to seeing on-network transactions decline since then.
Institutions Expressing Caution
CME has quietly become Ethereum’s second home. By mid-2025, over 70% of all fixed-expiry ETH futures OI were sitting on CME.
That’s a reflection of how hedge funds, asset managers, and ETF issuers are choosing to express ETH exposure through margin-efficient mechanisms.
In Q2 alone, average daily volume on CME’s ETH futures surged past 16,000 contracts, nearly $1.8 billion in notional value per day, at a time when ETH was down 25% YTD.
Today, though, with ETH up 25% YTD, CME futures posted consecutive record-breaking months. July saw $118 billion in volume, a then all-time high, followed by $173.9 billion in August that marked the highest monthly volume in CME’s history.
OI also spiked, rising from $2.97 billion in June to $7.94 billion in August, reflecting surging institutional demand.
Over the past month, institutional investors have cut long positions and increased shorts. Asset manager net positioning has historically been a reliable signal of price declines, with major reversals in net longs often lagging sharp futures selloffs over the last five years. The latest reversal shows a pattern similar to those past episodes.
The thesis of altcoin rallying after BTC did prove itself right, but that cycle has now run its course.
Institutions are increasingly using ETFs as an investment tool. While ETFs have grown structurally, recent outflows have mirrored price declines. Given their larger influence on the ETH market, sustained outflows or weaker inflows could trigger a slowdown similar to last year, when prices also fell sharply.
A Familiar Pattern
Historically, Ethereum underperforms Bitcoin and then outpaces it. Year-to-date, bitcoin is up 22%, with Ethereum currently outperforming by over 3%.
The ETH/BTC ratio is often the best early indicator of that shift. After hitting a painful low of 0.018 in April, it started to climb again, up 130% over four months, peaking at over 0.043 in August.
But this altcoin cycle carries new weight. ETH stakers have withdrawal access and an incentive to take profit, especially as yields compress and prices plateau. Meanwhile, a deeper derivatives market means speculative blowoffs are harder to sustain, as hedging accelerates mean reversion.
Conclusions and Lessons From History
Institutions are increasingly driving Ethereum’s price action. With ETFs and CME futures gaining dominance, tracking institutional positioning is critical. Current data shows caution: asset managers have cut net long positions since the rally peak, and ETF outflows are accelerating.
After reaching a new all-time high, ETH’s performance mirrors the 2021 peak. Many recent ETF buyers entered at elevated prices, leaving a significant share of holdings unprofitable. If prices fall back to March levels, more than half of ETF inflows from the past year would be at risk of losses.
With profit-taking in full swing, prices echo the peak during the 2021 bull run. A short position from present levels has the potential for massive upside according to historical trends.
Historically, after profit-taking at key price levels—measured by a drop in MVRV—ETH has averaged a 36% decline over two months. Currently, just 18 days past the last all-time high and only 5% lower, historical patterns suggest the potential for a sharper downturn.
With prices already trading at the 23.6% fibonacci level, continued decline could push prices lower to the 38.2% level at 3600.
A relevant case study is the decline following profit-taking after ETH’s all-time high in 2021. A simulated position under similar conditions to today shows a compelling return profile, highlighting how traders can benefit from profit-taking–driven downturns. Please note that historical trends are not indicative of future performance.
The strategy was not universally successful. A comparable position in September 2021, when ETH retested its prior ATH, would have resulted in losses. This underscores the importance of monitoring multiple signals that confirm slowing momentum and active profit-taking before entering such trades. Entering too early, before the bull run has fully played out, poses a significant risk.
This content is sponsored.
MARKET DATA
CME Real-time Market Data helps identify trading set-ups and express market views better. If you have futures in your trading portfolio, you can check out on CME Group data plans available that suit your trading needs tradingview.com/cme.
DISCLAIMER
This case study is for educational purposes only and does not constitute investment recommendations or advice. Nor are they used to promote any specific products, or services.
Trading or investment ideas cited here are for illustration only, as an integral part of a case study to demonstrate the fundamental concepts in risk management or trading under the market scenarios being discussed. Please read the FULL DISCLAIMER the link to which is provided in our profile description.
ETHUSD - Expect a bounce ... now? lets go above ATHLong time no see !
I was in vacations with the cult of the CME Gap that I joined
Soooo, Eth took some logic profits, it was a quasi straight line from 2400 to 4800 (not mentionning that its coming before from under 1500), a 10% correction is totally ok
we are actually in the middle of the last CME GAP, its filling daddy
Dec 2024 high
100 MA 4H
0.5 fib resistance from last low
0.236 is 4K so we still have room to be in denial if it dips more
as you can see thats a lot of convergences, not even talking about BTC, BTC.D, USDT.D, GOLD and all the other tickers aligning perfectly for the big ritual of the big last leg of the big bull run (B.R.B.L.L.B.B.R.) (I know how to make it since those vacations)
Sooo SL is slightly under first bullish Order Block that u can see in this chart @ around 3440, yes sry I can't mess with the levs even with this perfect entry opportunity
TP1 : 7000
TP2 : 9000
TP3 : 11000 (0.618 fib extension)
Will update the TPs if momentum changes
XX
not advise

From Strength to Weakness: ETH Validates a Key Bearish PatternIntroduction (Market Context)
Ether Futures (ETH) and Micro Ether Futures (MET) have been at the center of market attention since April 2025, when prices staged a remarkable rally of more than +250%. This surge was not just a technical phenomenon—it came in the wake of major macro events such as Liberation Day and the reemergence of U.S. tariff policies under Donald Trump’s administration. Those developments sparked speculative flows into digital assets, with Ether acting as one of the prime beneficiaries of capital rotation.
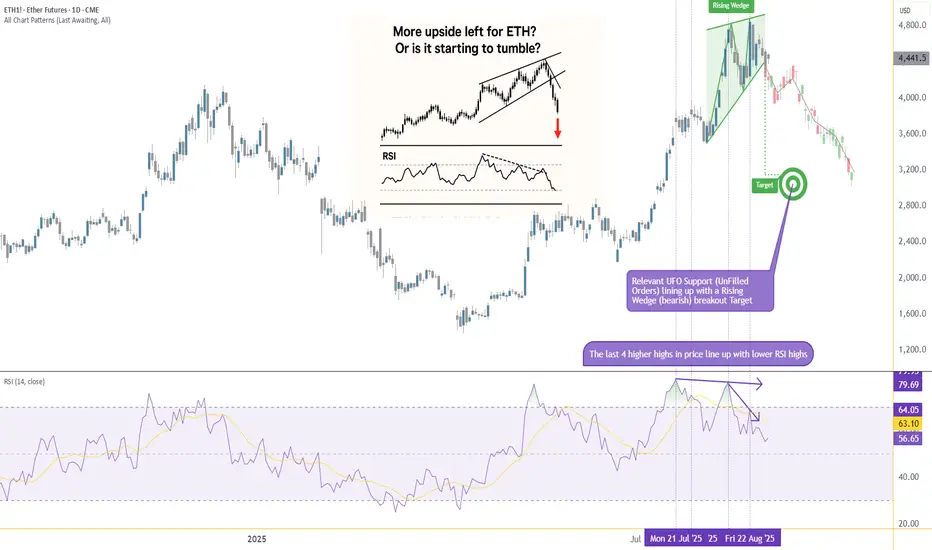
Yet markets rarely move in one direction forever. After such a sharp rise, technical exhaustion often follows, and signs of that exhaustion are beginning to surface on ETH’s daily chart. Traders who enjoyed the rally now face a critical juncture: whether to protect gains or to consider new opportunities in the opposite direction. The key lies in a pattern that has appeared many times in history, often marking important reversals—the Rising Wedge.
What is a Rising Wedge?
A Rising Wedge is one of the most recognizable bearish reversal formations in technical analysis. It typically develops after a strong uptrend, where price continues to push higher but does so with diminishing momentum. On the chart, the highs and lows still point upward, but the slope of the highs is shallower than the slope of the lows, creating a narrowing upward channel.
The psychology behind the wedge is critical: buyers are still in control, but they are running out of strength with every push higher. Sellers begin to absorb demand more aggressively, and eventually, price breaks through the lower boundary of the wedge. This breakdown often accelerates as trapped buyers unwind positions.
From a measurement perspective, technicians project the maximum width of the wedge at its start, and then apply that distance downward from the point of breakdown. This projection offers a technical target for where price may gravitate in the following weeks. In the case of Ether Futures, that target points toward the 3,200 area, a level of strong technical interest and a logical area for traders to watch closely.
RSI and Bearish Divergence
Alongside the wedge, momentum indicators add further weight to the bearish case. The Relative Strength Index (RSI) is a widely used oscillator that measures momentum on a scale of 0 to 100. Values above 70 are generally interpreted as “overbought,” while values below 30 suggest “oversold.”
The most powerful signals often emerge not when RSI is at an extreme, but when it diverges from price action. A bearish divergence occurs when price sets higher highs while RSI forms lower highs. This is an indication that upward momentum is weakening even as price appears to climb.
Ether Futures have displayed this phenomenon clearly over the past few weeks. The daily chart shows four successive higher highs in price, yet RSI failed to confirm these moves, instead tracing a series of lower peaks. Notably, RSI pierced the overbought zone above 70 twice during this period, but momentum faded quickly after each attempt. This divergence is a classic early warning sign that a bullish run is running out of steam.
Forward-Looking Trade Idea
With the Rising Wedge breakdown and RSI divergence in place, a structured trade plan emerges. Futures traders can express this view through either the standard Ether Futures contract (ETH) or its smaller counterpart, the Micro Ether Futures contract (MET).
Contract Specs & Margins
Ether Futures (ETH): Notional = 50 Ether, Tick size = 0.50, Tick value = $25.00, Initial margin ≈ $68,800 (subject to CME updates).
Micro Ether Futures (MET): Notional = 0.1 Ether, Tick size = 0.50, Tick value = $0.05, Initial margin ≈ $140 (subject to CME updates).
Trade Plan (Bearish Setup)
Direction: Short
Entry: 4,360
Target: 3,200
Stop Loss: 4,702 (coinciding with a minor resistance level)
Reward-to-Risk Ratio: ≈ 3.39 : 1
The projected wedge target around 3,200 is not only a measured move from the pattern but also sits close to a previously established UFO support zone. While anecdotal, this confluence reinforces the credibility of the level as a potential magnet for price.
Risk Management
Regardless of how compelling a technical setup may appear, the most decisive factor in trading remains risk management. Defining risk in advance ensures that losses are limited if the market behaves unexpectedly. In this case, placing the stop at 4,702 not only keeps risk under control but also aligns with a minor resistance level, making the trade plan technically coherent.
Position sizing also plays a crucial role. The availability of Micro Ether Futures (MET) allows traders to participate with significantly reduced capital requirements compared to the full-sized ETH contract. This flexibility makes it easier to fine-tune exposure and manage account risk more precisely.
Equally important is the discipline of adhering to precise entries and exits. Chasing a trade or ignoring pre-defined stop levels can erode the edge provided by technical analysis. Markets often deliver multiple opportunities, but without sound risk management, traders may not survive long enough to benefit from them. Ultimately, capital preservation is the foundation on which consistent performance is built.
Closing
Ether’s spectacular rally since April 2025 is a reminder of the asset’s ability to deliver explosive moves under the right conditions. Yet history shows that parabolic advances rarely continue uninterrupted. The combination of a Rising Wedge breakdown and a confirmed RSI divergence provides strong evidence that the current uptrend is losing momentum, and the market may be entering a corrective phase.
For traders, this is less about predicting the future and more about recognizing when probabilities align in favor of a defined setup. With clear entry, target, and stop levels, the ETH and MET contracts offer a structured opportunity for those willing to take a bearish stance while managing their risk appropriately.
When charting futures, the data provided could be delayed. Traders working with the ticker symbols discussed in this idea may prefer to use CME Group real-time data plan on TradingView: www.tradingview.com - This consideration is particularly important for shorter-term traders, whereas it may be less critical for those focused on longer-term trading strategies.
General Disclaimer:
The trade ideas presented herein are solely for illustrative purposes forming a part of a case study intended to demonstrate key principles in risk management within the context of the specific market scenarios discussed. These ideas are not to be interpreted as investment recommendations or financial advice. They do not endorse or promote any specific trading strategies, financial products, or services. The information provided is based on data believed to be reliable; however, its accuracy or completeness cannot be guaranteed. Trading in financial markets involves risks, including the potential loss of principal. Each individual should conduct their own research and consult with professional financial advisors before making any investment decisions. The author or publisher of this content bears no responsibility for any actions taken based on the information provided or for any resultant financial or other losses.
GC1, SI1, BTC1 & ETH1 Daily Trade SetupsGC1, SI1, BTC1 & ETH1 Daily Trade Setups
In this update we review the recent price action in Gold, Silver, Bitcoin & Ether futures and identify the next high probability trade setups and price objectives to target. To review todays video analysis click below!

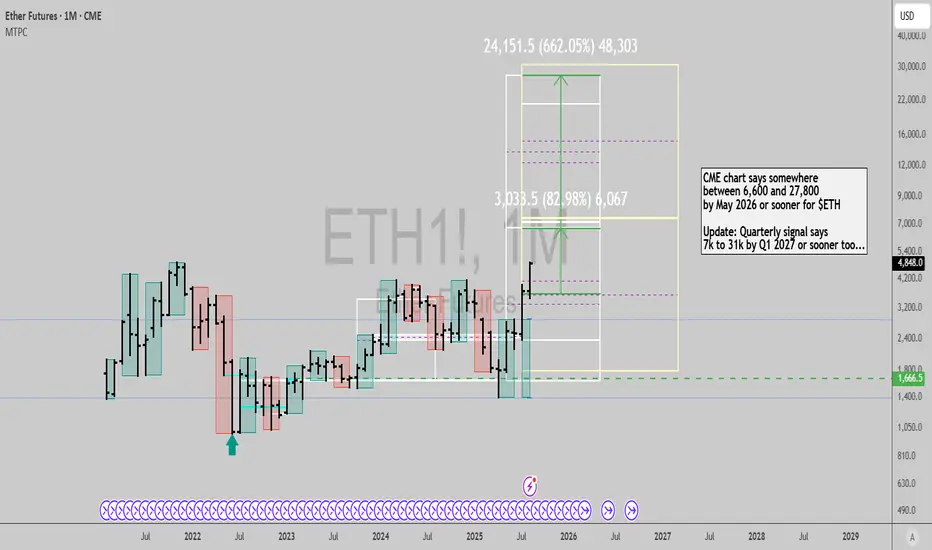
Ether futures: Quarterly signal and new ATH...GN gents,
As you know, I've been bullish ETH for a while now, although I had hedged partially in the last few days ahead of the correction we had, but now started deploying cash I raised again. Ether futures chart from CME shows more conservative targets than stop given that it has more limited data, but it is interesting to be aware of what tradfi whales see when operating in this market.
With some luck, macro data doesn't derail the train here, and things move steadily higher for the rest of the year and into early to half 2026 at least, before significant corrections or "bear markets" unfold.
Best of luck!
Cheers,
Ivan Labrie.
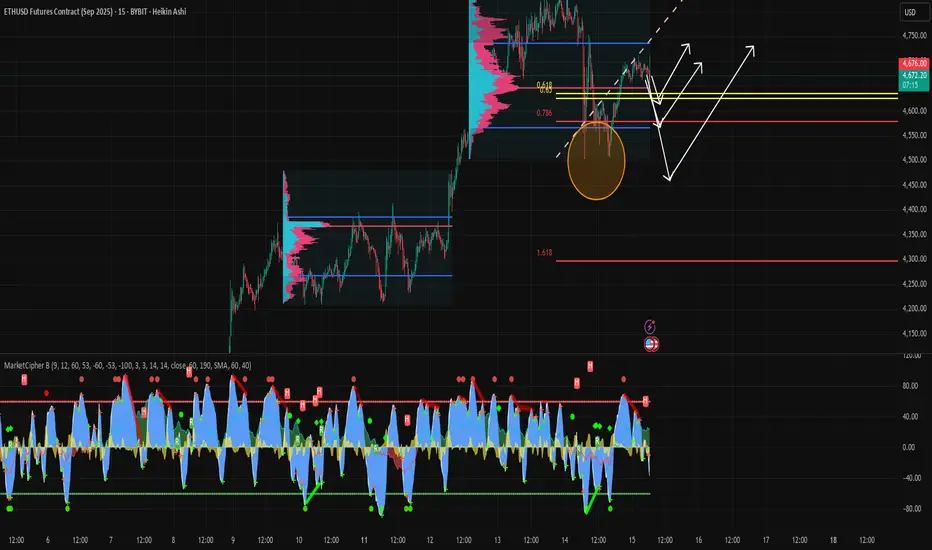
minor pullback with deceptive volitility brings high RR for=SELL1->3 : we make lower lows , number 2 is confirmed as the current dominant power in this micro structure,
3->4 : we push back upto number 2 with a large burst of volitility, these large bursts can be decieving, manytimes they don't have sustaining power and can be thought of a sprinters 'final push' , not the start of somehting signiciant.
* What do I think will happen ?
* after we reach number 2 , there is no significant volitile movement, this leads me to believe that the large wick from 3->4 is not super significant in our analysis, if it was we should be seeing more of that buyer activity, yet we see a controlled selloff with not much resistance
* looking at the Chaos Theory indicatior, we can see that over the past 2,500 bars , if price closes below a zone, we have a 65% chance of it reaching the next low, with this in mind we can see that we have indeed had the bar close but not reach , so an entry just below the border of the zone with an expected follow through, and a stop loss at the proven buyers number 2 seems like a logical trade that would work more often than not
* we have hidden bearish for RSI, MFI and ACC/Dist which is helpful for a sell

ETH1!How I see it playing out (it will seem so obvious in hindsight):
4,070 holds as ETH bottom
Tom Lee's quant praised praised for accurately forecasting ETH bottom using *checks notes* elliott waves and ichimoku (they were probably gunning for the CME gap at 4087.50, now filled)
CME ETH "record" shorts used as fuel; their unwind sends ETH through ATH

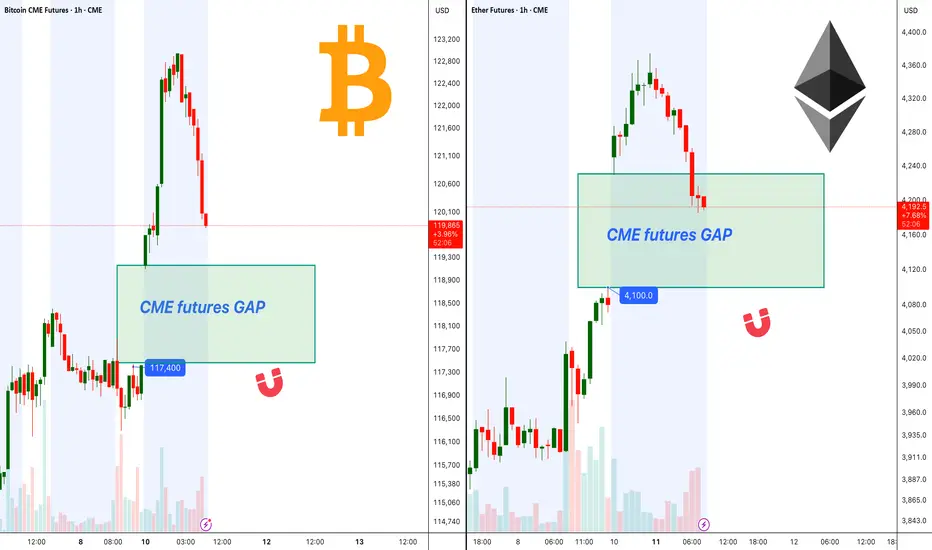
BTC, ETH CME Gaps Could Fill Before Bullish Continuation!Ethereum CME futures currently show a visible gap around $4,100 . Price is approaching this level, and based on historical behavior, CME gaps often act as magnets, drawing price in to fill them before a continuation in trend.
Bitcoin CME futures also have a gap sitting near $117,400. The recent rally has brought BTC close to this zone, increasing the probability of a short-term retracement to fill the gap before any significant breakout attempts.
Both gaps are key areas to watch, as a clean fill followed by strong buying pressure could set the stage for the next bullish wave in BTC and ETH.
Cheers
Hexa
3 possible ETH level for a bounce. I am currently long on ETH from $4200.
These are the 3 level I'm looking for a bounce.
I rather long a sweep of the lows at $4500.
If ETH loses this volume profile I will be simply looking at the next volume profile IMO. Im bullish on eth IMO I don't think it will pull back to hard.
Nasdaq Hits New All Time HighThe big news of the session today was the CPI report, which rose by a less than expected amount in July. Initially, equity markets jumped off of the report and were able to close the day higher after some back and forth price action. THe Russell was the leader which traded up near 3% on the day while the S&P and Nasdaq traded to their all time high prices. While the Nasdaq was at an all time high, the Russell is looking to cross a critical level that traders have not seen since February of this year.
Outside of the equities, the significant jump in the Crypto markets continued today which was led by Ether futures and Solana futures which both traded up about 8% on the day. Ether futures have been on an incredible stretch to the upside and have now reached a level not seen since December of 2021, showing strong continued momentum. Bitcoin has also continued to slowly climb higher and will be looking to re-test its all time high price which is right near $123,615.
If you have futures in your trading portfolio, you can check out on CME Group data plans available that suit your trading needs tradingview.com/cme/
*CME Group futures are not suitable for all investors and involve the risk of loss. Copyright © 2023 CME Group Inc.
**All examples in this report are hypothetical interpretations of situations and are used for explanation purposes only. The views in this report reflect solely those of the author and not necessarily those of CME Group or its affiliated institutions. This report and the information herein should not be considered investment advice or the results of actual market experience.
Quantum Solutions BTC Rises Amid Yen Weakness Strategic BITDPSAs Japan’s yen continues to slide against the U.S. dollar, Quantum Solutions, a Japanese technology firm, is doubling down on Bitcoin exposure — a move that reflects a broader trend among Asian firms seeking digital assets as a hedge. For companies like BITDPS, these market shifts present a unique opportunity to profit from both macro and crypto volatility.
Yen Weakness and Bitcoin Exposure
The Japanese yen has depreciated over 10% year-to-date, hitting multi-decade lows. With the Bank of Japan maintaining ultra-low interest rates while the U.S. continues its hawkish stance, the yen’s weakness seems far from over.
Quantum Solutions' decision to increase its Bitcoin holdings reflects:
Hedging against currency devaluation
Diversification of balance sheet assets
Speculative positioning on crypto upside
Their latest filings show millions allocated to Bitcoin, signaling increasing institutional acceptance of crypto in Japan — a market historically cautious about digital assets.
Why It Matters for Global Markets
Quantum Solutions is not alone. Across Asia, especially in inflation-sensitive economies, corporations are reassessing fiat stability and exploring crypto for capital preservation and yield.
This emerging demand can push Bitcoin’s price upward in regional cycles, increase demand for crypto infrastructure, and elevate trading volume — all creating an environment ripe for arbitrage, hedging, and structured crypto-financial products.
How BITDPS Capitalizes on This Trend
BITDPS is uniquely positioned to profit from macro-driven crypto moves thanks to its:
Cross-border trading infrastructure — enabling arbitrage between Asian and Western exchanges
Currency-volatility hedging systems — profiting from forex-crypto interdependencies
Dynamic algorithmic trading models — adjusting exposure as macro signals shift
As institutional players like Quantum Solutions increase their Bitcoin holdings, price reactions across spot, futures, and derivatives markets become predictable and exploitable — with the right tools.
At BITDPS, we monitor macro shifts like yen devaluation in real-time, plug that data into our crypto-trading systems, and execute precision trades that extract value from currency-crypto correlations. We profit when price inefficiencies appear — regardless of direction.
Conclusion
The growing institutional Bitcoin interest in Japan, driven by yen weakness, marks a new era of macro-crypto integration. For Quantum Solutions, it’s a hedge. For BITDPS, it’s a profit machine. As volatility persists, we stand ready — using smart AI systems and global liquidity access — to turn every macro ripple into actionable alpha.

Gold, Silver, Bitcoin & Ethereum Daily Trade SetupsIn this update we review the recent price action in Gold, Silver Bitcoin & Ethereum futures and identify the next high-probability trade setups and price objectives to target. To review today's video analysis, click here!

MEV Bot Exploit by MIT-Educated Brothers Leads to $25M CryptoIn the dynamic world of crypto trading, where cutting-edge innovation meets finance, abuses are inevitable. One of the most prominent cases of the year involves brothers Anton and James Peraire-Bueno, MIT graduates accused of exploiting Maximal Extractable Value (MEV) strategies to siphon off $25 million from the Ethereum ecosystem within seconds. The case may set a precedent for how automated behavior in decentralized systems is judged under traditional legal frameworks.
What Happened?
According to the prosecution, the brothers deployed several Ethereum validators and used specialized algorithms to reorder transactions within blocks. This allowed them to front-run other MEV bots and redirect transaction flows in their favor—a textbook mempool attack. In just 12 seconds, they allegedly drained $25 million in ETH and other digital assets.
Why Is This Case Unique?
First major MEV case involving such significant financial losses
Criminal charges despite actions operating within protocol rules
Academic background of the defendants adds to the public intrigue
This case raises a key legal question: Can actions that are technically “legal” under protocol rules still constitute fraud if they are knowingly harmful to other participants?
Implications for the Crypto Industry
The trial could redefine ethical and legal standards in the DeFi and automated trading sectors. If convicted, this could trigger a broader review of front-running bots, sandwich attacks, and other MEV strategies that, until now, have existed in a legal gray area.
As the regulatory landscape evolves, this trial may become a cornerstone in shaping how future MEV tactics are governed—and how automated trading fits into the legal definition of financial manipulation.