nikk225 futures. unified gartleya potential bear unified gartley is setting up. look for sell within the sell zone.
Trade ideas


Nikkei 225 - Exaggerated Bullish Divergence On SupportVolume divergences play very cleanly on weekly indices.
CME's NY1! tracks the Nikkei chart to a tee, with an added bonus of volume.
Regular bearish played out strongly and landed right on McGinley as support with an exaggerated bullish divergence to pop it back up. Although the author does not agree on using any moving average as a signal, this looks like a great spot to buy with a tight stop and minimal chance of reversal if it does break down here.
Watching the aqua line ($23005 area) for resistance and for any correlation between U.S. equities and cryptocurrencies.

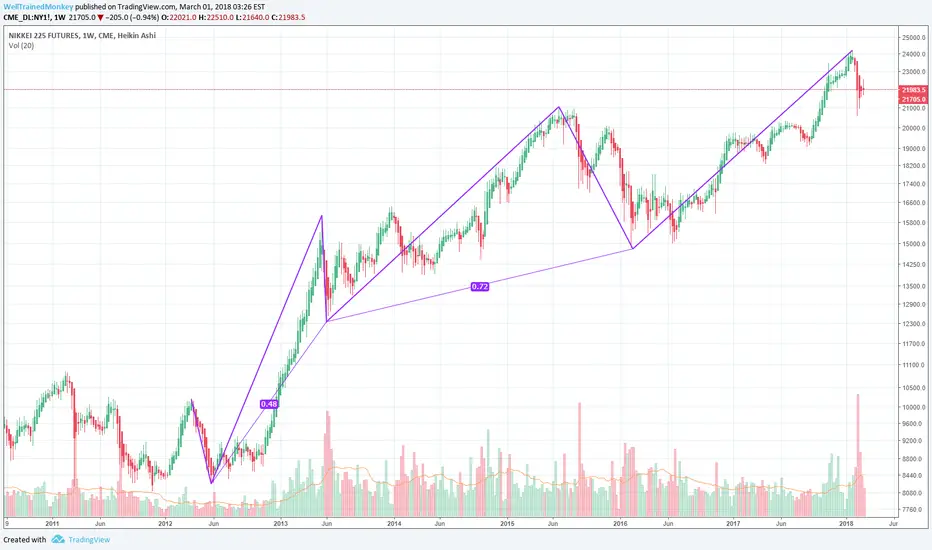
The preponderance of evidence: NKY This is part of a series of charts which I will posting for the reader to make up his/her mind based on the weight of the evidence.
Do note, these are weekly charts which means the implications of which will occur over the next 12, 18, 24, 36 months.


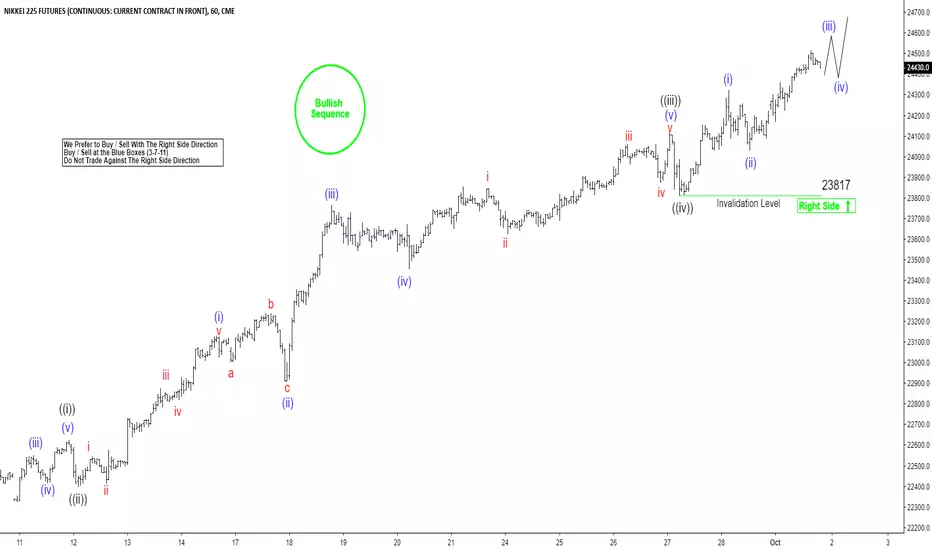
Nikkei Elliott Wave Right Side Calling HigherHello Traders,
Nikkei short-term Elliott wave view suggests that the decline to 22161 on 9/06/2018 low ended red wave 2. Above from there, red wave 3 remain in progress, nesting higher in an impulse structure. With lesser degree cycles showing sub-division of 5 waves structure in each leg higher i.e black wave ((i)), ((iii)) & ((v)) expected to unfold in 5 waves structure. Also, it’s important to note that the right side is up & instrument is having a bullish sequence tag available in below chart. This suggests that the selling is not recommended.
Up from 22161 low, the initial rally to 22750 high black wave ((i)) in 5 waves. The decline to 22535 low ended black wave ((ii)) pullback.
Then the rally higher from there ended black wave ((iii)) at 24120 high. The pullback to 23817 low ended black wave ((iv)). Above from there black wave ((v)) of 3 remain in progress, looking to extend higher as long as the pivot at 23817 stays intact.
Afterwards, the index is expected to do a wave 4 pullback in 3, 7 or 11 swings before further upside is seen. We don’t like selling it & expect buyers to appear in 3, 7 or 11 swings against 23817 low.
Nikkei large time frame breakoutNikkei looks to be on it's way to January's highs. Buying dips on shorter timeframe charts

Nikkei 225 bull runNikkei with a lot of upside potential. Room for a larger timeframe downward rotation in the near future, until that time i'll be fading dips at marked zones dependent on approach. Context is everything. Happy trading

NY1!: CD leg down to 21.6k, -3.5%NY1! has been trading in an expanding wedge aka megaphone pattern since May. Having peaked in late Aug, NY1! is starting a CD leg down with an indicative price objective of 21.6k, -3.5%. If you take a look at the USDJPY, it has been mopping around the upper boundary of a wedge. With friends like Trump, a current account surplus, trade wars and slowing ETF purchases by the BoJ, the risk is on the downside.

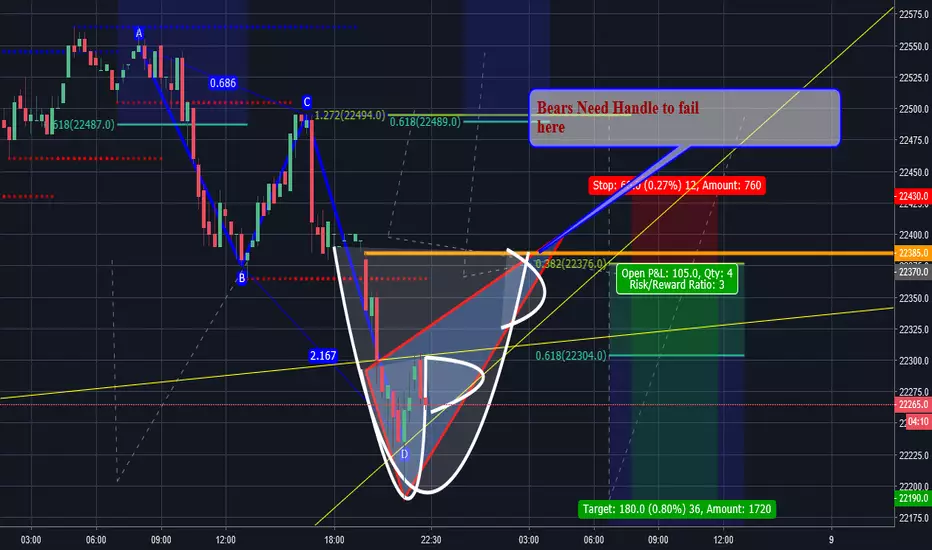
$spy bears need to watch for a failed handle $djia $ndx $qqqdetails on chart potential short set up my forecast

Short Trade Nikkei 225 - Trendline break to cause sell off!See attached a trade I have entered short on the Nikkei 225.
Price has now reacted twice to the ascending trend line and failed to hold its advance. I suspect a 3rd retest would cause a break.
Bulls have failed to form a new high over the past couple of months leaving the bears in control here.
Trades troubles between the US and china have caused doubt in Asian equities. Let see if this plays out!


Nikkei/Yen future NYU2018 D1Trading Signal
Short Position (EP) : 22676
Stop Loss (SL) : 22783
Take Profit (TP) : 22405, 22273
Description
NYU2018 formed Double Repo Sell at 1d time frame. Trade setup with Sell Limit at 0.382 Level (22676) and place stop after 0.618 level (22783). Once the position was hit, place take profit before an agreement (22405) and 22273
Money Management
Money in portfolio : $48486
Risk Management (1%) : $484.86
Position Sizing
$5 = +-$5 (MINI)
Commission fee = -$1.82/contract (Mini)
EP to SL = $107 = -$107/contract (Mini)
Contract size to open = 4 standard contracts
EP to TP#1 = $271 = +$271 (MINI)
EP to TP#2 = $403 = +$403 (MINI)
Expected Result
Commission Fee = -$14.56
Loss = -$428
Gain#1 = +$542
Gain#2 = +$806
Total Gain = +$1348
Risk/Reward Ratio = 3.05


NIKKEI - Formation of Lower High, Weakness AboundLaburlah Technical Coverage (30-MAY, Wednesday):
NIKKEI 225 Futures
Technical Analysis Breakdown
1. Trend: Sign of further retracement
2. RSI & Stochastic: Reversing downward
3. MACD: Bearish cross
4. Bollinger band: Sign of going down
5. Support level: 20,780 - 20,910
Disclaimer: The abovementioned is purely for sharing purpose, you should seek advice from relevant personnel and do your own analysis before making your move.

Nikkei moment of truthLooks like the aggressive shorts might have have their way here. NB: I didn't short it. Range of High Volume Node was too wide for me as I'm not a swing trader

NIkkei Key LevelsStill plodding along, break of balance last night looking more like range expansion for now. Imagine we have a test of range lows and potentially look to touch upon previous highs & HVN's before any major push up. Top of range grey box looks like a low risk short if we push inside, end of day red likely as longs get paid.


Nikkei at a crossroadTiming. #Study. Long setup at the break of horizontal trendline. Stop according to the timeframe driving your trade.

NKY Futures: Potential short term bounce to test 23.4I had previously posted my longer term short bias in the USDJPY and NKY but we all need to be aware price action is full of ebbs and flows; it is almost never a straight line up or down. The near term charts of the NY1 (240M) suggests the index is trying to stay north of a 19-month long uptrend with the potential for a CD leg to test 23.4k. Watch out for the double witching in OSE futures and options this Friday, should be interesting.

NY1!: Weekly 135 completion A 135 completion in the NK1! weekly chart coinciding with an ABCD completion in the ES1! weekly. The NKY is finally closing the gap with the USDJPY which looks like it is going to test the 100 handle again.