NQ Range (08-25-25)Going back to Range play this week. We are in the middle of a long lasting trend of a Friday-Monday Long Play, this has been the redirect of any drop going back a year or two. Total guess this week, Blue Arrows are Key Levels to watch for hit/reversals. The Shaded Zone above is a Turn Zone that will/may reject and send the NAZ 23,486 or 486 1st then TZ try. Go Fed, BTD & FOMO for another Decade. The Buy The Dip Strategy seems to TRUMP all strategies and Wash Street is banking on that. Still feel we go lower prior to any new ATH. Look sideways to lower and stay long in any O/N Session.
NQX1! trade ideas

MNQ Futures 29 AUGBullish to start off NY session. Possible drop in the hours leading to market close.

A good set up for Nasdaq100Nasdaq graphic shows a clear set up for either long or short. Its already in the resistance are that might be a new support or not, Just wait a confirmation candle. Watchout your risk by putting stop loss tightly. Be prepared for profit !! Good luck


NASDAQ 100: Bullish, But There Is a Headwind.....Welcome back to the Weekly Forex Forecast for the week of Aug 25 - 29th.
In this video, we will analyze the following FX market: NASDAQ (NQ1!) NAS100
The NASDAQ has a bearish FVG on the Daily TF. Should it fail, buy the pullback to it, as it will invert to a iFVG and support higher prices.
Should it fail, and we will know Monday/Tuesday, sells become valid, down to the Weekly bullish FVG.
Let the market unfold Monday, then look for valid entries.
Enjoy!
May profits be upon you.
Leave any questions or comments in the comment section.
I appreciate any feedback from my viewers!
Like and/or subscribe if you want more accurate analysis.
Thank you so much!
Disclaimer:
I do not provide personal investment advice and I am not a qualified licensed investment advisor.
All information found here, including any ideas, opinions, views, predictions, forecasts, commentaries, suggestions, expressed or implied herein, are for informational, entertainment or educational purposes only and should not be construed as personal investment advice. While the information provided is believed to be accurate, it may include errors or inaccuracies.
I will not and cannot be held liable for any actions you take as a result of anything you read here.
Conduct your own due diligence, or consult a licensed financial advisor or broker before making any and all investment decisions. Any investments, trades, speculations, or decisions made on the basis of any information found on this channel, expressed or implied herein, are committed at your own risk, financial or otherwise.

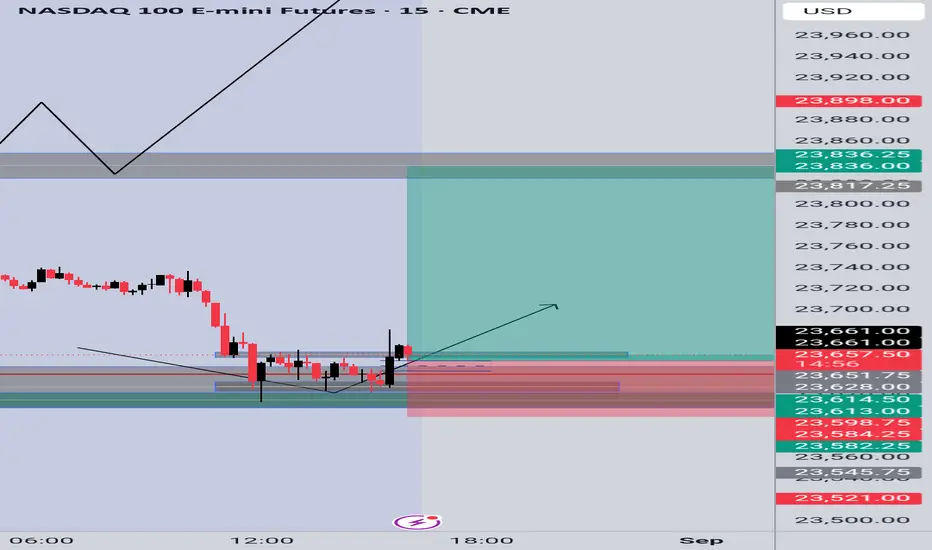
IFVG NQ LONG bullish bias here going into Asia / Tokyo session, Looking At the 15m and 5m FVG to get into a long position, slight EMA Bias NQ & ES keep ranging above the 15m 200ema, Predicting it respects the $23,843.00 price range and uses that as the draw to buy side liquidity (BSL)

NQ DAILY LEVELSKey levels that will be in play next week based of the four-hour time frame. We also have some fair value gaps and liquidity pools the market should be looking to take out. Expecting monday to be a bullish day due to more news the fed may lower interest rates.
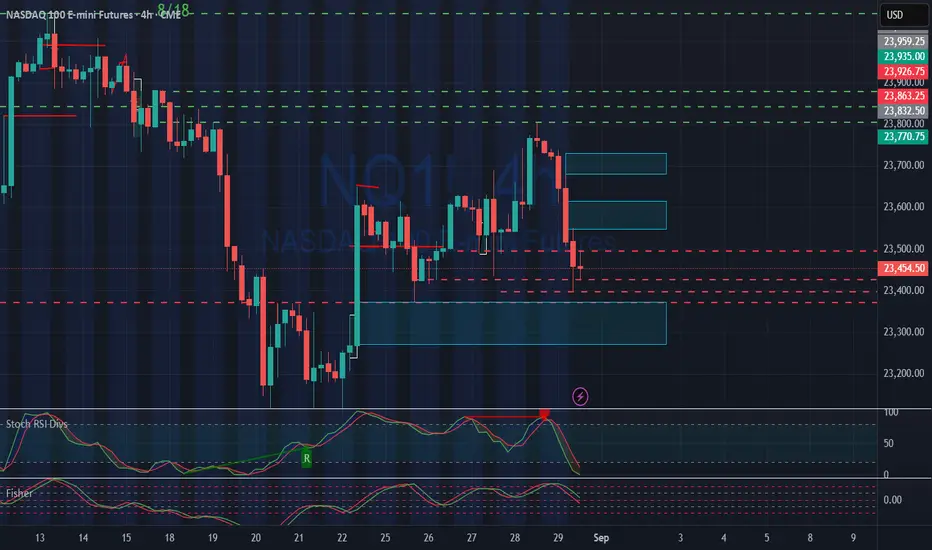
NQ Power Range Report with FIB Ext - 8/29/2025 Session (Correct)CME_MINI:NQU2025
- PR High: 23762.00
- PR Low: 23735.00
- NZ Spread: 60.5
Key scheduled economic events:
08:30 | Core PCE Price Index (YoY|MoM)
09:45 | Chicago PMI
Month end ahead of early close Monday
Session Open Stats (As of 12:45 AM 8/29)
- Session Open ATR: 283.13
- Volume: 16K
- Open Int: 286K
- Trend Grade: Long
- From BA ATH: -1.4% (Rounded)
Key Levels (Rounded - Think of these as ranges)
- Long: 24382
- Mid: 23239
- Short: 22096
Keep in mind this is not speculation or a prediction. Only a report of the Power Range with Fib extensions for target hunting. Do your DD! You determine your risk tolerance. You are fully capable of making your own decisions.
BA: Back Adjusted
BuZ/BeZ: Bull Zone / Bear Zone
NZ: Neutral Zone
New ATHs incoming? NFP numbers the catalyst?NQ1 is showing short-term bullish momentum, rebounding from 23,000 to 23,600. Key resistance sits at 23,856 and again at 24,000–24,100. A clean breakout above 24,100 could open the door toward 24,300+, but reaching 24,500 by Sept. 5 would likely require a strong catalyst. Probability of hitting 24,500 in the next week remains low (about 15–20%) despite the current upward bias.
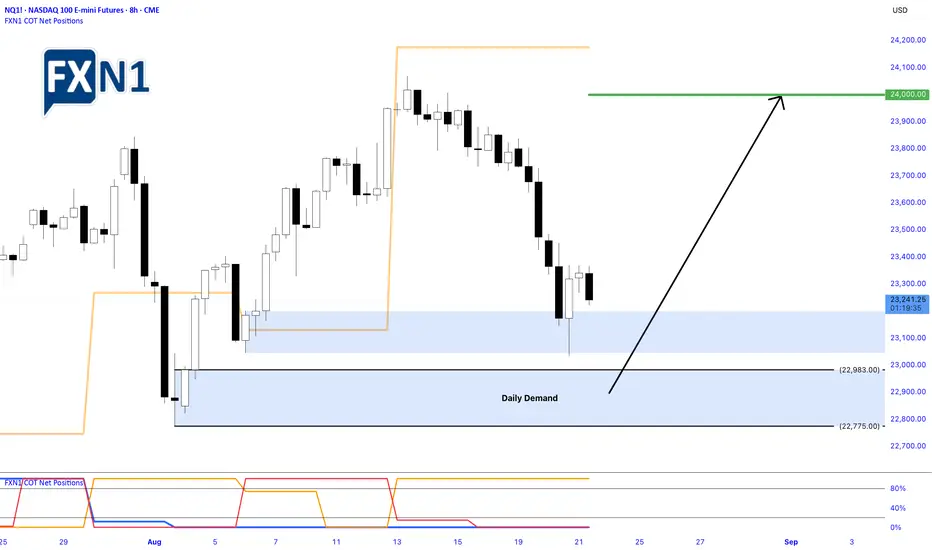
Nasdaq Bounces Off Demand Zone: Opportunities for a Bullish Rev.Yesterday, the Nasdaq experienced a notable rebound from the daily demand zone around 23,201, signaling buying interest at that level. However, as the EU trading session commenced, the index quickly shifted to a bearish impulse, reflecting ongoing market uncertainties and cautious sentiment among traders.
Key Levels and Opportunities
Despite the short-term pullback, the chart presents a compelling opportunity for traders to consider a "buy low" approach near the next demand zone at approximately 22,983. If the market finds support there, it could set the stage for a recovery, with the potential for the Nasdaq to rally back toward the 24,000 mark or even higher.
Market Outlook and Analyst Projections
Analysts remain optimistic about the index’s prospects, with many projecting a strong finish to the year. The Nasdaq, known for its volatility and lucrative trading opportunities, continues to attract traders seeking to capitalize on its upward momentum. As always, projections are optimistic, but the current technical setup suggests that there could be a favorable risk/reward ratio for those willing to position for a rally.
Final Thoughts
In a market characterized by rapid shifts and unpredictable moves, identifying key demand zones and monitoring reaction levels is crucial. The upcoming sessions could provide a prime entry point for those looking to buy dips, with the potential for the Nasdaq to forge ahead into the year’s final stretch with gains.
✅ Please share your thoughts about NQ1! in the comments section below and HIT LIKE if you appreciate my analysis. Don't forget to FOLLOW ME; you will help us a lot with this small contribution.
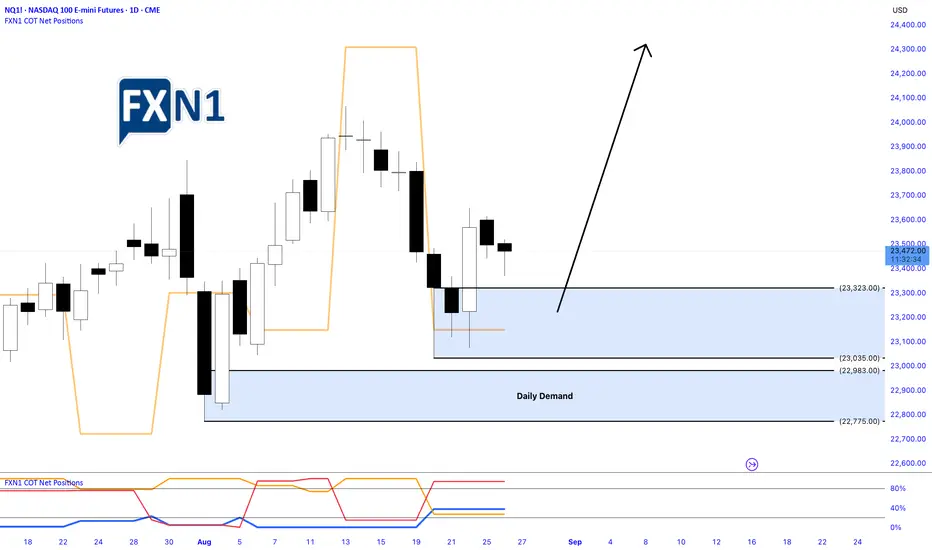
Nasdaq Pulls Back After Friday’s Rally: Identifying Demand ZoneYesterday, the Nasdaq underwent a pullback following a robust bullish surge on Friday. During this correction, a fresh Daily Demand Zone emerged on the chart, signaling potential support levels. Traders are now eyeing this area as an opportunity to position for a possible new high, should the market retrace further today. The current outlook favors a long setup, with anticipation of a continued upward move contingent on the price respecting the identified demand zone.
✅ Please share your thoughts about NQ1! in the comments section below and HIT LIKE if you appreciate my analysis. Don't forget to FOLLOW ME; you will help us a lot with this small contribution.
Nq & Es Premarket Comment 27-08-2025Good morning everyone,
My overall bias remains bullish, and I will once again be looking for long opportunities, with the main target being the high I have highlighted on the chart.
We are currently in a premium zone, which means price may seek lower levels before continuing higher. If that happens, it could offer fresh opportunities to re-enter long positions. However, there is also the possibility that price may simply continue its upward rally without a deeper pullback.
Personally, I prefer to wait for the market open at 09:30 NY time and observe the initial reaction before making any trading decisions.
Despite intraday fluctuations, my broader expectation is for both indices to eventually push above their ATHs.
Wishing everyone a successful trading session.
⚠️ Disclaimer: This analysis reflects personal market observations and is for educational purposes only. It does not constitute financial advice.

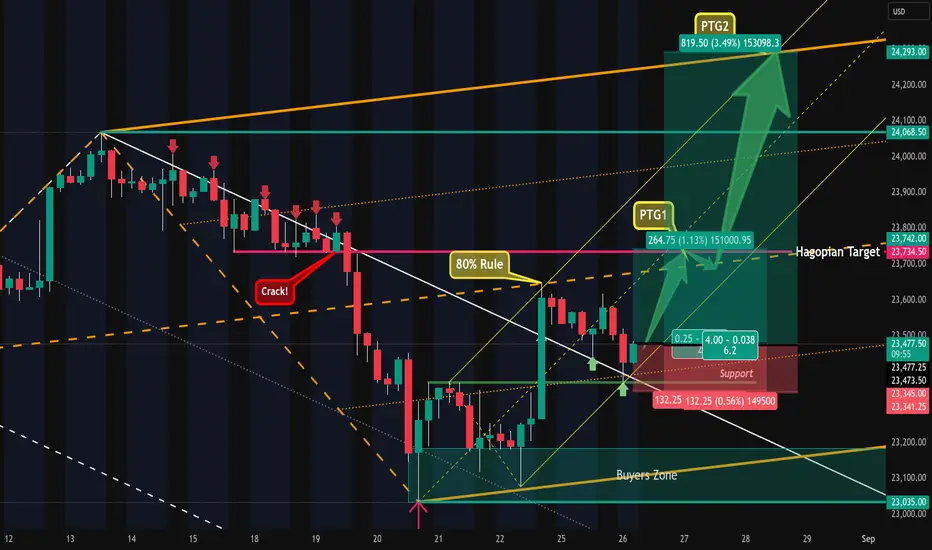
Nasdaq - Intraday Setup & Potential TradePrice was not abel to trade out of the white forks U-MLH and got constantly rejected.
It cracked the little support and fell down, but missed the white Centerline, creating a HAGOPIAN.
Then price traded outside of the white fork, following a textbook test/retest at the white U-MLH and found support.
The yellow fork points upwards, showing us the most probable path of price.
Going long near the white U-MLH gives us several potential targets:
1. the orange Centerline
2 the yellow Centerline
3. the HAGOPIAN target line.
4. the orange U-MLH
Stops would be below the last red bars low, because this, as of the time of writing, is the best structural level to hide behind.
I'm off to the mountains, have a happy trading day!
SHORT 1H CHARTnew project short term setups lets go ! i would try to post all my short terms moves.
p.s. i dont trade every day so...
short- local low the target
SL above 61%

MNQ Prop Account Risk Management – From $50K to $300K
1) Core funding rules (simple & strict)
Account inputs
Acct = account size
TTD = trailing drawdown buffer your prop gives (e.g., Apex $50K → $2,500)
tickValue and tickSize depend on the product (for MNQ: tickSize = 0.25, tickValue = $0.50, $2.00 per index point)
Budgeting
Daily loss cap (never exceed):
DailyCap = 0.10 × TTD (≈ 10% of TTD)
→ $50K example: 0.10 × 2,500 = $250/day
Per-trade risk (normal):
RiskTrade = 0.50 × DailyCap (≈ 50% of daily)
→ $50K example: 0.50 × 250 = $125/trade
Max trades per day (if all losers):
DailyCap / RiskTrade → typically 2 losses max. Stop trading.
Tip: if you’re warming up or drawdown is tight, use RiskTrade = 0.33 × DailyCap (3 bullets per day).
Position sizing
Choose a stop distance in points from your 15s setup (tight range, reduces variance).
For MNQ:
RiskPerContract = StopPoints × $2.00
Contracts = floor( RiskTrade / RiskPerContract )
Trailing drawdown protection
Hard daily stop: auto-flatten when Unrealized+Realized <= -DailyCap.
Two-strike rule: 2 consecutive full-risk losses → walk away.
No add-to-loser; scale-in only if the first risk is reduced (BE+ or partials).
2) Timeframe workflow (why 15s works)
Context / bias: 10–15-minute chart → trend, key levels, session regime.
Execution: 15-second chart → micro pullback, CHoCH/confirm, ALGTP setup zones.
Psychology: the 10–15m avoids overreacting; 15s keeps risk tight.
Risk discipline: 15s makes it easy to place objective small stops (e.g., 10–20 points MNQ), aligning with prop TTD constraints and avoiding rule violations.
3) Concrete numbers (MNQ examples)
Assume MNQ (Micro NQ):
$2.00 per point per contract (0.25 tick = $0.50)
Three example stops from 15s structure: 10 / 15 / 20 points
Risk per contract
10 pts → $20
15 pts → $30
20 pts → $40
Position sizing formula
Contracts = floor( RiskTrade / (StopPoints × 2) )
4) Scaling plan by account size
I’ll assume TTD ≈ 5% of account (matches Apex 50K→2.5K). If your prop’s TTD differs, just plug your TTD into the same formulas.
Account TTD (≈5%) DailyCap = 10% TTD RiskTrade = 50% of Daily MNQ contracts (10 / 15 / 20-pt stop)
$50K $2,500 $250 $125 6 / 4 / 3 (=$120/$120/$120 used)
$100K $5,000 $500 $250 12 / 8 / 6
$150K $7,500 $750 $375 18 / 12 / 9
$250K $12,500 $1,250 $625 31 / 20 / 15
$300K $15,000 $1,500 $750 37 / 25 / 18
How to read: For the $50K plan with a 20-point stop, Contracts = floor(125 / 40) = 3.
With 15-point stop: floor(125 / 30) = 4. With 10-point: floor(125 / 20) = 6.
Important fine-tuning
If your fills slip or you trail early, reduce Contracts by 1 to keep real risk ≤ plan.
In fast conditions, switch to 10-second (ALGTP’s funding preset) or even 5-second for entries. It shrinks stop distance yet still respects the 10–15m bias.
5) Trade plan checklist (ALGTP flow)
When to trade
Timeframe panel (your “snow” focus): higher-timeframe bias aligned (10–15m green for longs / red for shorts).
Price is above Setup Trigger and confirms at CHoCH/Confirmation Trigger (for longs), or symmetric for shorts.
Momentum not exhausted (avoid entries directly into TP3/TP4 clouds).
When not to trade
Opposite bias on 10–15m.
Entering right into Capital Defense / Max Exhaustion zones.
After 2 full-risk losses or when DailyCap is reached.
Entry & management
Entry at Setup Trigger or micro retest on 15s.
Initial stop just beyond Capital Defense (or last micro-swing).
Partial TP ladder: TP1 (momentum hold), TP2 (intensity), trail to BE+, then leave a runner toward TP3/TP4.
Trailing: switch to smart trailing only after TP1; before that, protect initial risk.
6) Simple formulas you can keep on your desk
DailyCap = 0.10 × TTD
RiskTrade = 0.50 × DailyCap
Risk/contract = StopPoints × $2.00 // MNQ
Contracts = floor( RiskTrade / Risk/contract )
Example (50K, TTD 2,500):
DailyCap = 250
RiskTrade = 125
Stop 15pt → Risk/contract = 15 × 2 = $30
Contracts = floor(125 / 30) = 4
If you also trade MES (Micro S&P): tick $1.25 (0.25 pt), so $5 per point. Replace $2.00 with $5.00 in the formula.
7) Why this is prop-friendly
Keeps risk anchored to TTD, not to account notional.
Forces few, high-quality attempts (2–3 bullets max/day).
15s (or ALGTP’s 10s funding preset) compresses stop distance, making the same TTD support more contracts without violating rules.
The 10–15m bias prevents revenge trading and wrong-direction scalps.

Nq & Es Premarket comment 28-08-2025Good morning everyone,
My overall bias remains bullish, with the Dow Jones and S&P (ES) showing stronger upward momentum compared to the Nasdaq. I will wait for the market open at 09:30 NY time to see if the market offers any long opportunities within a discount zone.
Of course, there is also the possibility that price may continue moving higher without any pullback. The main target remains the ATH on ES.
Wishing you all disciplined and successful trading.
⚠️ Disclaimer: This analysis reflects personal market observations and is for educational purposes only. It does not constitute financial advice.

#202534 - priceactiontds - weekly update - nasdaq futures Good Day and I hope you are well.
comment: Market stayed around the 50% retracement from the prior 2 weeks selling. Bears need to miracle to keep it below 23600 and go down again. Bulls want the measured move up which could lead to 24200 or more. We are in the middle of the range and I need strong momentum on Monday to join either side.
current market cycle: bull trend - peak bubble
key levels for next week: 22800 - 24100
bull case: Bulls want a new ath but I doubt they will get it without a better pullback. The move on Friday was strong enough to expect at least a second leg. Otherwise I am having a hard time finding arguments for the bulls. They printed a higher low, which still confirms the bull trend and bulls can argue it’s a two-legged pullback on the daily chart. Confirmation is only above 23600 and if so, I’d expect a quick move to 23800.
Invalidation is below 23400ish
bear case: Bears can argue the red bear trend line is still valid (see chart) and that we retraced about 50% of the two-week selling. If they can stay below 23600, small chance that we reverse and continue down to 23000 and make lower lows again. For now bears are not favored and around 23500 it’s best to do nothing.
Invalidation is above 23600
short term: Neutral around 23500. Can’t get much more out of the chart right now.
medium-long term - Update from 2024-08-10: 22000 likely to get hit this year gain. 20000 seems a bit much for 3 months left.
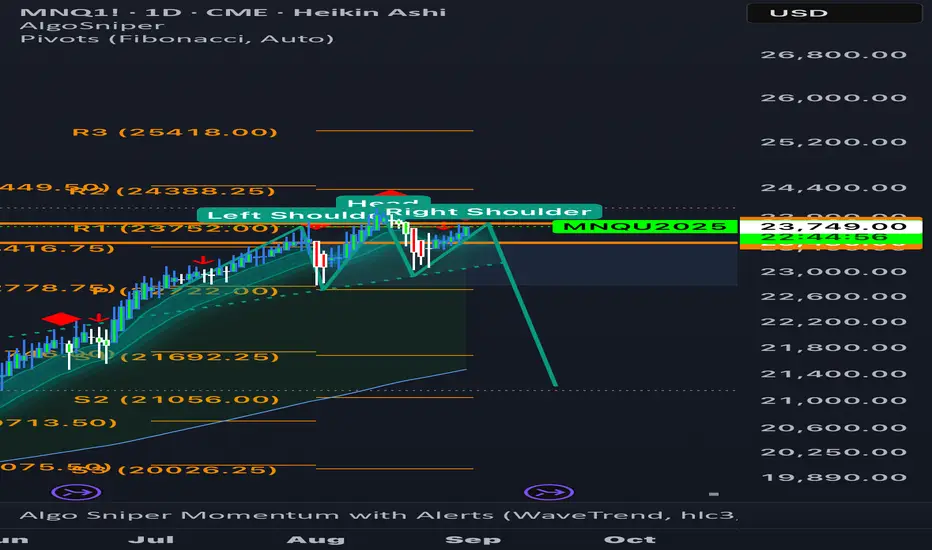
Thinking the impossibleIm thinking the impossible likeliness of NQ pushing higher testing 24000, before pulling back to create a leg down before moving higher again later. Sept & October is a possible red candle to allow long term buyers to buy at a lower price, perhaps similar to Feb and March pullback or perhaps not. The monthly candles are getting smaller during the past 2 months, which was also demonstrated in Feb and March. Price exhaustion based on a Demark 13 similar to Jun and July 24 before the pullback in August to October 24 adding the conviction of a probable pullback. Nobody can be certain what will happen in the future, just thinking the probable likeliness. Just an idea to ponder.

Possible head and shoulders pattern. Based on market structure we will see how our head and shoulders plays out.
Nq & Es After Hours Comment 28-08-2025Good evening everyone,
As the saying goes, a picture is worth a thousand words. Just look at how price delivered today — exactly in line with the outlook I shared earlier.
I hope you all managed your decisions well and had a successful session.
See you tomorrow, shortly before the market open.
⚠️ Disclaimer: This analysis reflects personal market observations and is for educational purposes only. It does not constitute financial advice.

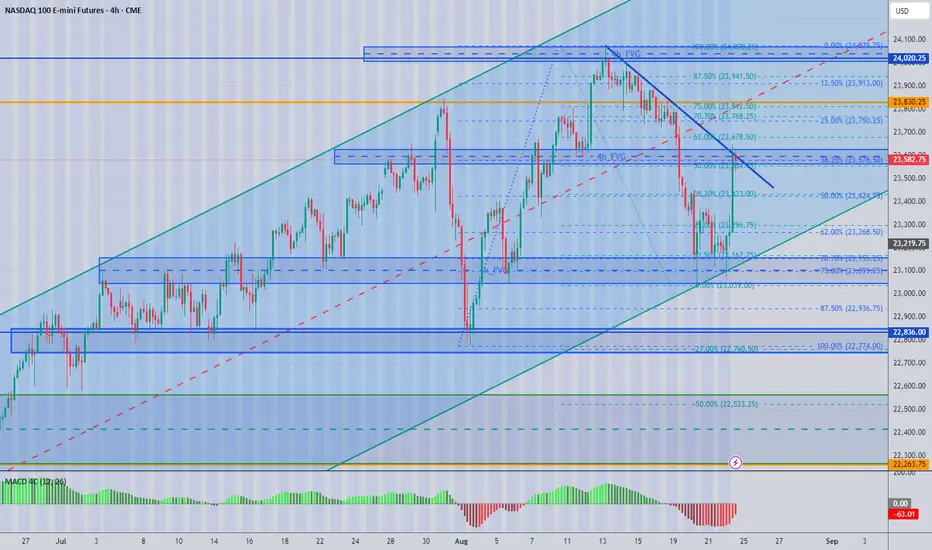
Re publishing the chart i published Friday - What do you noticeWhat is the standout feature of this chart I have extended the boxes to show you how areas of support and resistance interact in the market place.
The 4 hour chart is a great chart for evaluating positions.
1. Use this at setting bias and levels for breaks.
2. Then you can drill down into lower timeframe charts to identify potential position entries.
3. I would repeat the process of mapping out these lower time frame charts to identify entry levels
4. When you in your trading time frame, i use 1, 2, and 5 minute time frames, others use range bars or renko etc , these are allow personal preferences but the mapping process will remain the same.
5. I always use MACD to analyse strength of move and look for divergence.
6.I always measure an impulse higher or lower with the Fibonacci retracement tool. This will show you retracement values and set target levels.
7. I love the two moving averages 144 and 169 period.
8. Candle patterns help in determining market structure and order flow if you know what to look for.
I hope this all helps you any questions i am happy to answer them
good luck
Mark
NQ Bearish BiasNQ is consolidating below a key resistance after a strong selloff from recent highs.
Price failed to hold above 23,750 and is now building a lower-high structure under 23,550.
Unless buyers reclaim that zone, the path of least resistance looks lower with targets near 23,130–23,200.
What do you think? Like and follow for more insightful ideas.

NASDAQ100 - Update As anticipated, price returned to key support. I've, added more on a retest of the demand zone. Patience pays.