#202534 - priceactiontds - weekly update - nasdaq futures Good Day and I hope you are well.
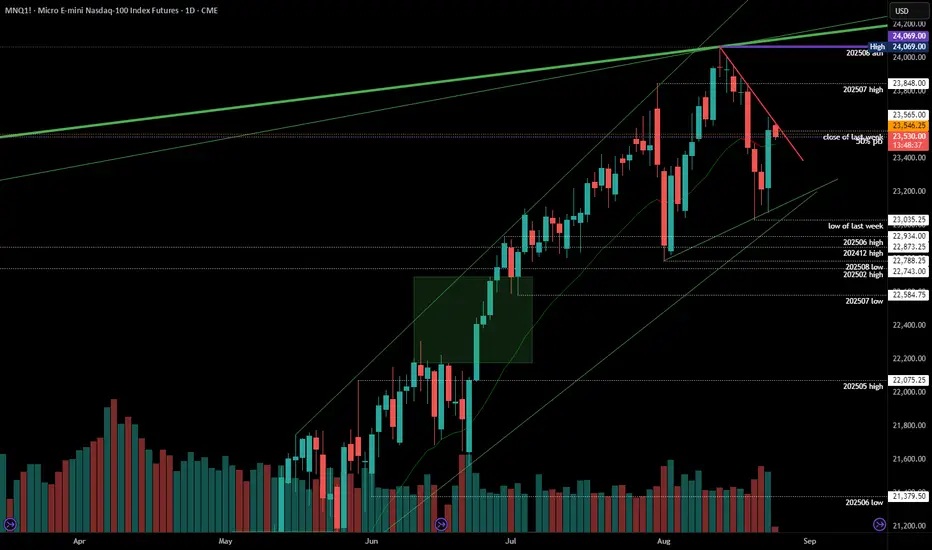
comment: Market stayed around the 50% retracement from the prior 2 weeks selling. Bears need to miracle to keep it below 23600 and go down again. Bulls want the measured move up which could lead to 24200 or more. We are in the middle of the range and I need strong momentum on Monday to join either side.
current market cycle: bull trend - peak bubble
key levels for next week: 22800 - 24100
bull case: Bulls want a new ath but I doubt they will get it without a better pullback. The move on Friday was strong enough to expect at least a second leg. Otherwise I am having a hard time finding arguments for the bulls. They printed a higher low, which still confirms the bull trend and bulls can argue it’s a two-legged pullback on the daily chart. Confirmation is only above 23600 and if so, I’d expect a quick move to 23800.
Invalidation is below 23400ish
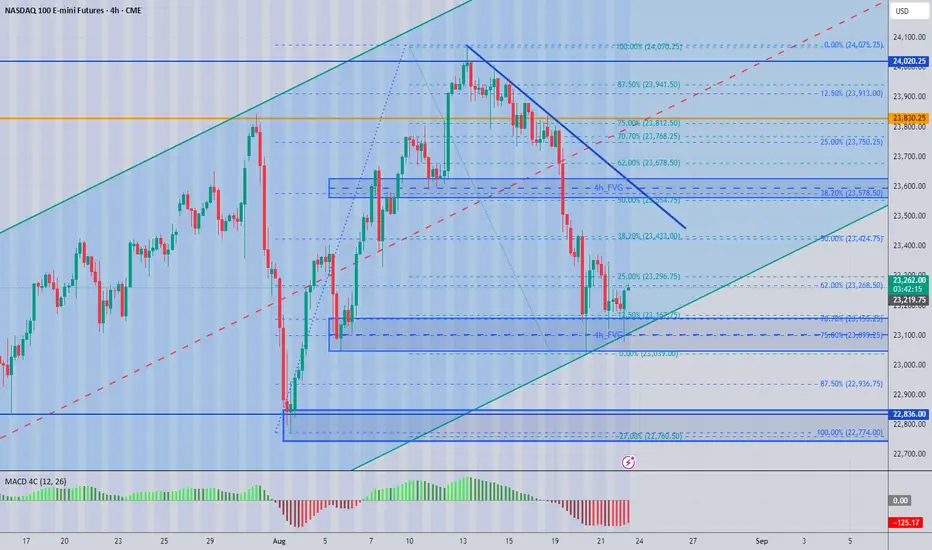
bear case: Bears can argue the red bear trend line is still valid (see chart) and that we retraced about 50% of the two-week selling. If they can stay below 23600, small chance that we reverse and continue down to 23000 and make lower lows again. For now bears are not favored and around 23500 it’s best to do nothing.
Invalidation is above 23600
short term: Neutral around 23500. Can’t get much more out of the chart right now.
medium-long term - Update from 2024-08-10: 22000 likely to get hit this year gain. 20000 seems a bit much for 3 months left.
NQX1! trade ideas
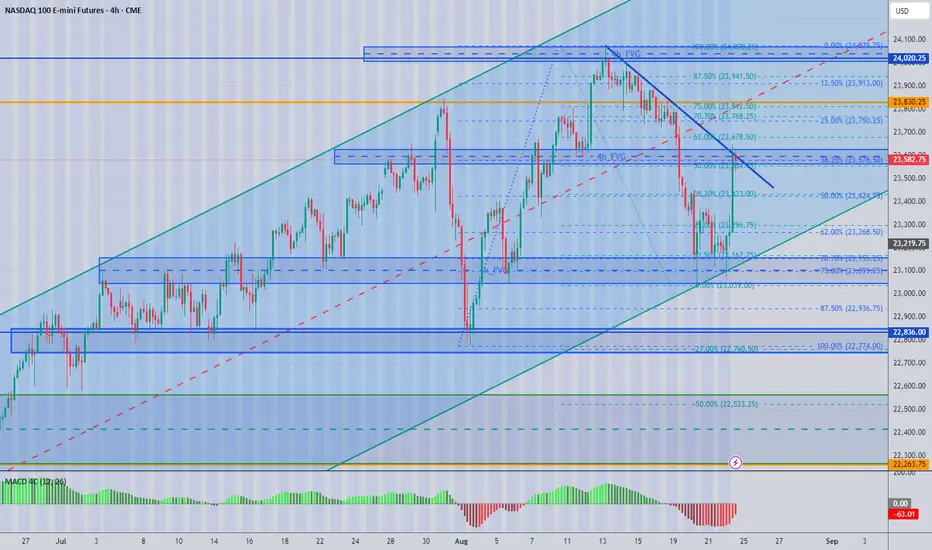
NASDAQ BULLISH4hr bull flag/golden pocket let’s see when it breaks out but def lookin for upside only

Re publishing the chart i published Friday - What do you noticeWhat is the standout feature of this chart I have extended the boxes to show you how areas of support and resistance interact in the market place.
The 4 hour chart is a great chart for evaluating positions.
1. Use this at setting bias and levels for breaks.
2. Then you can drill down into lower timeframe charts to identify potential position entries.
3. I would repeat the process of mapping out these lower time frame charts to identify entry levels
4. When you in your trading time frame, i use 1, 2, and 5 minute time frames, others use range bars or renko etc , these are allow personal preferences but the mapping process will remain the same.
5. I always use MACD to analyse strength of move and look for divergence.
6.I always measure an impulse higher or lower with the Fibonacci retracement tool. This will show you retracement values and set target levels.
7. I love the two moving averages 144 and 169 period.
8. Candle patterns help in determining market structure and order flow if you know what to look for.
I hope this all helps you any questions i am happy to answer them
good luck
Mark
NQ Short (08-18-25)Friday did not lift and the O/N is at low, look for anu reg session selling to gain some strength under the DZ. Looking for 400 point range this week and break lower can move 1,000 points under the DZ. Expect Tricks/Tweets (damage spin) and more Tweets early this week. Low volume buying should turn into high volume selling. Washington Street Asset Management will have its work cut out over the next month or so and may be why we got propped up.

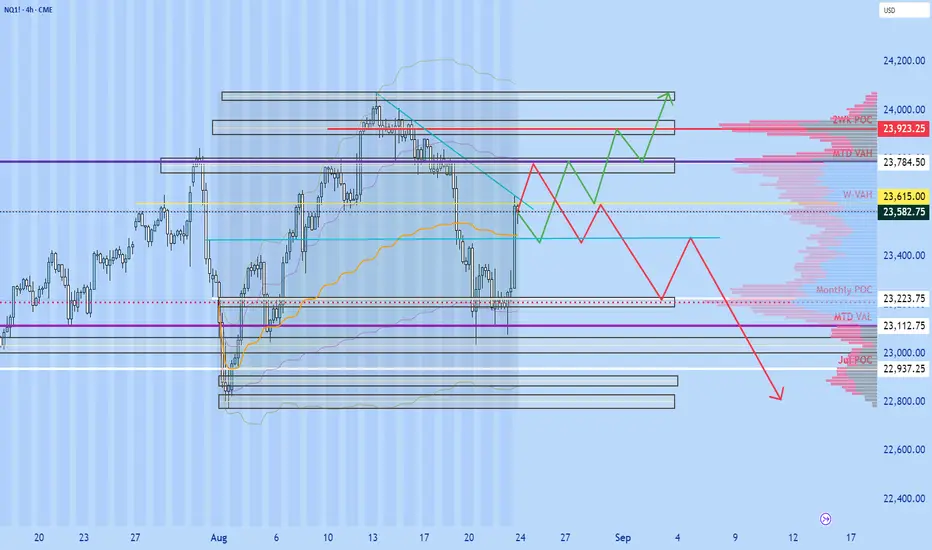
NQ may pullback before creating new highsThe bulls want to push the market higher while the bear wants a 2nd leg down on the daily. PA loses 20EMA then reverses up and we are approaching September where catalyst will help push the market to create new highs. We may retrace from here then move up. My bias is super bullish however not eliminating the potential of a small retracement. i.e. 50% retracement then pushes up. Just my thought process. Cheers
NQ - August 22 2025 - Before the open
So yesterday was an inside day, which means we traded inside the previous days range (failed to break previous days high or low).
23,000 is a very strong support. If it breaks with conviction there is no real support until about 22,500.
FUNDAMENTALS : I think we will need a strong fundamental reason for 23,000 to break down. Something such as Powell saying they wont cut rates in September. The market is keeping an eye on inflation data and employment because these will determine if they cut or not.
Rate cut scenarios:
1. If inflation spikes due to tariffs as we saw in most recent PPI report, I think they may hold rates.
2. If employment drops a lot (bad NFP report, most importantly unemployment rate goes up) that may force them to cut in September.
3. If inflation drops near 2%, they will likely cut in September regardless of if employment data is good or bad.
***Keep in mind the market is sort of expecting inflation due to tariffs, so if inflation holds steady or is slightly better than expected that maybe enough for them to cut in September.
TECHNICALS : So far we have strong buying near 23,000 level but for the last 3 days buyers are lacking conviction at lower and lower prices. (Selling near 23,300).
Good trading :)

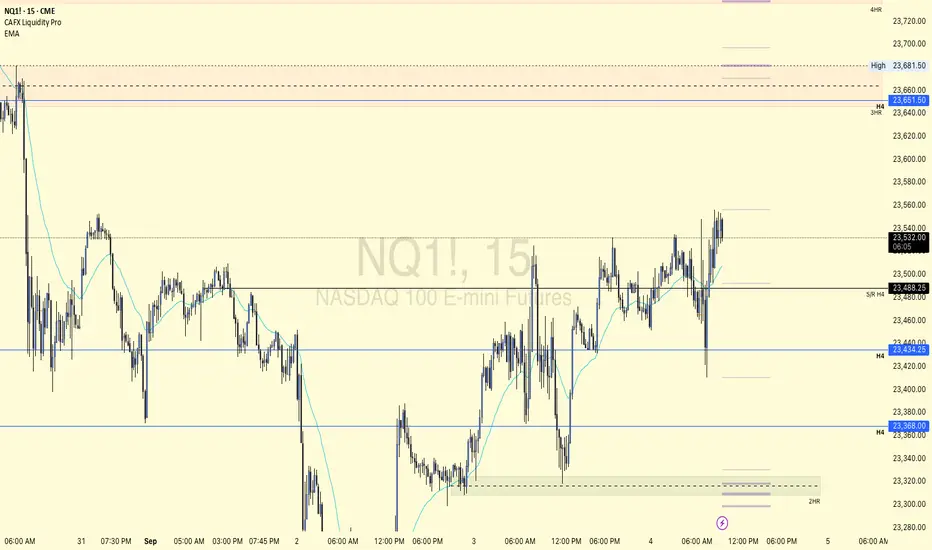
NQ Levels and set up for today With Jackson Hole upon us, we're going to get some explosive moves. I have mapped out my thoughts on the 4H chart. Good luck, be careful out there
NQ 9/5Daily resistance on top of price.
Price is currently testing and being held by a 15min Inverse FS level.
A distribution trend is trying to form. If the BS candle is not formed to create the future origin level needed to create the trend, then price is targeting a higher range.
Price is supported by an hourly BS level, (unmarked) and the 4hr RAT with its accumulation trend. The 4hr level has the potential to break the daily distribution trend.
seems likely the price will need to find support again before breaking out.

NQ: 246th trading session - recapI'll need to get back on my track - I know what my plan is, I just gotta push myself to actually write every part out and follow it
NQ - 9/4 1HRMonthly timeframe Pink
Weekly = Grey
Daily = Red
4hr = Orange
1hr = Yellow
15min = Blue
5min = Green
4 candles, 6 Levels, & MarketMeta
Range = 2 or consecutive candles of the same color.
Distribution Range - When price is above a distribution range it will act as support. When price is below, the SwingLow will be the boundary/entrance/exit of the range.
Distribution ranges consist of the 1st candle called the BackSide and last candle called the Frontside. Each has expectations.
BackSide candle (BS): expectation=strong reaction to price, support price. Hold price above it. Mark this level with a horizontal ray tool on the topside wick or topside body.
FrontSide candle (FS)
expectation = support price until trend reversal. Protects the SwingLow, exit of range.
To mark this level, place the horizontal ray tool on the topside wick or topside body.
SwingLow = the bottom side wick of the FrontSide Candle. Boundary of the range.
The Accumulation Range - When price is BELOW an accumulation range then these levels will act as resistance to price.
Inverse Backside (Inv.BS)= the first candle in the accumulation range. Its marked on the bottom side wick or body of the candle.
Its usually next to a Frontside candle. Traders like to see Inverse BackSide candles engulf Frontside candles and create an impulsive Fair Value Gap.
These f.V.G's next to FrontSide levels have higher probability than those that don't have the engulfing, F.V.G..
the last candle in the accumulation range is the Inverse FrontSide (Inv.FS)
marking the topside wick with the horizontal ray tool is to mark the SwingHigh Level. Mark the bottom side wick or body to display the Inv.FS level.

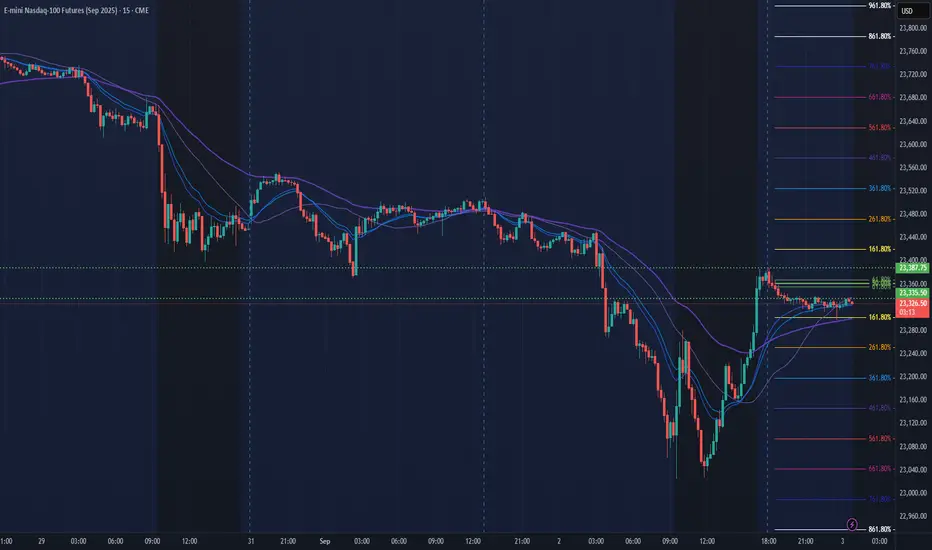
Fixed Range Volume Profile use it We are looking to retest top 23,525 NQ but if we fall below 23,427 NQ we going to the down side & short. I think we have a higher chance of going up to 23,700 NQ before Monday. I just want to take the time to thank the crazy Patrick Wieland and this cheap $200 course.
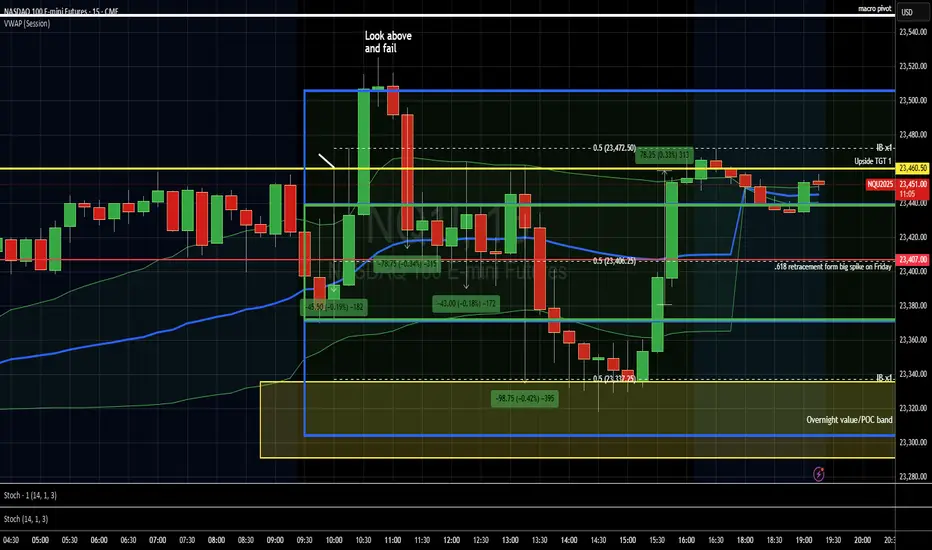
Nasdaq Futures: A Textbook Day of Balance and Precision PlaysNQ Recap - Sep 3, 2025: A masterclass in balance! Weaker JOLTS data sparked a relief rally, easing yields and lifting stocks, though markets zigzagged. Best trades? Confirmed breakouts or "look-above-and-fail" fades at 23,460.5 (IB high). Price held 23,407 support, squeezed late to 23,460, stalling at 23,472. Lower JOLTS signaled a cooling job market, hinting at eased inflation and Fed rate cuts—fuel for stocks, but recession fears loomed.
Tomorrow: Watch 23,407 & 23,460-72; break above targets 23,495-550, rejection eyes 23,3472.
#TradingView #Nasdaq #Futures #JOLTS #DayTrading
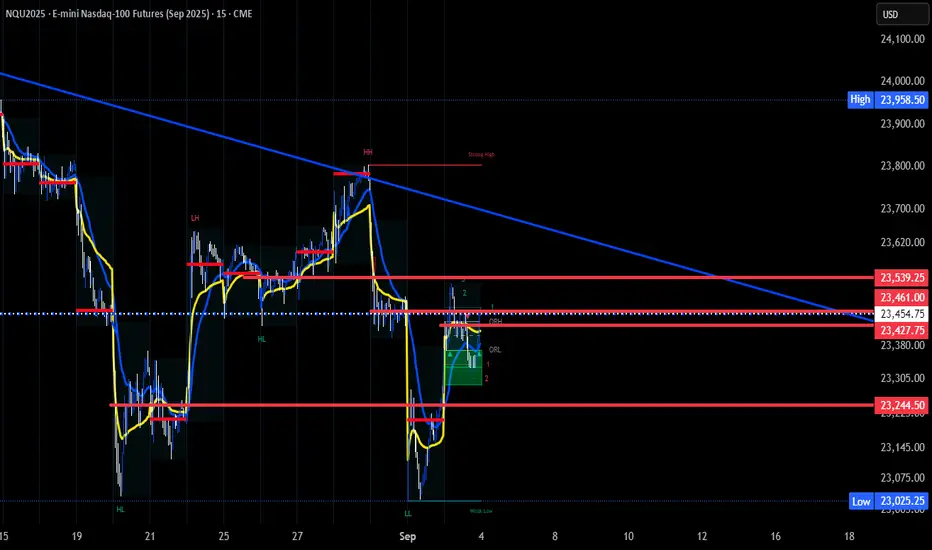
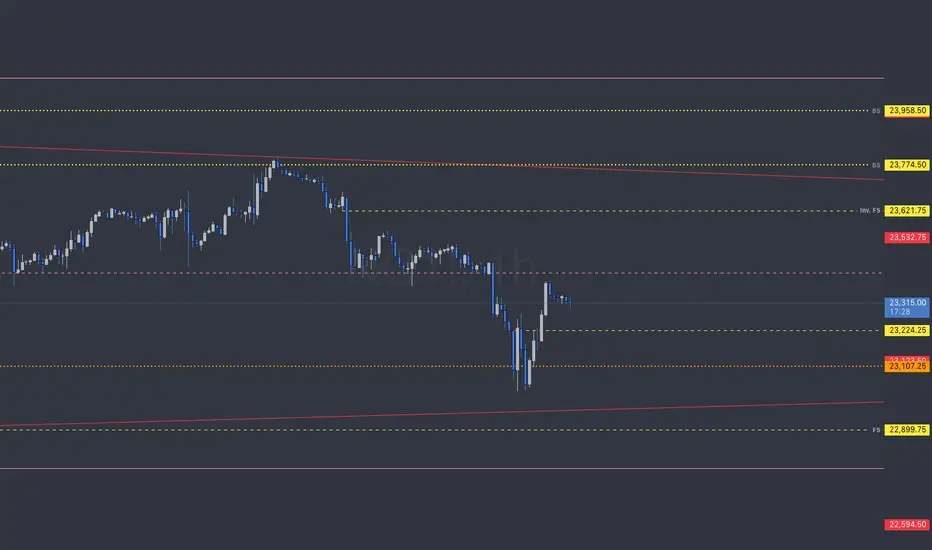
NQ HnS/Ranging Possible Head and shoulders pattern on the daily with right shoulder forming.
Price is sitting within the middle if the weekly range after rejecting the high of the range at 23,845.00.
Price is also consolidating within a triangle pattern. (Meaning a long term direction is yet determined.)
I expect price to break down to at least retest the low of the range and possibly the long term trend line that was previously reclaimed during April/May rally.
For added confluence Jeanius is displaying sideways movement in price for the daily and weekly charts. The month is still up.

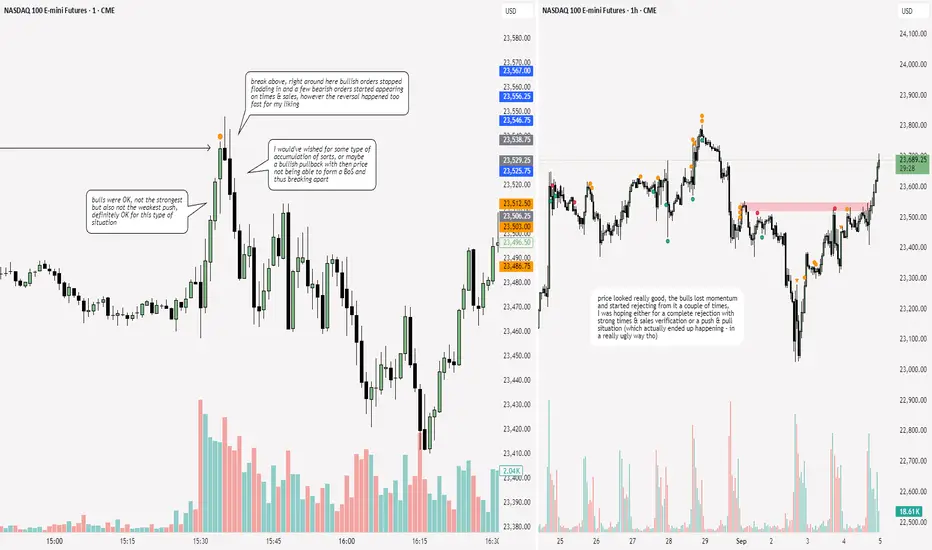
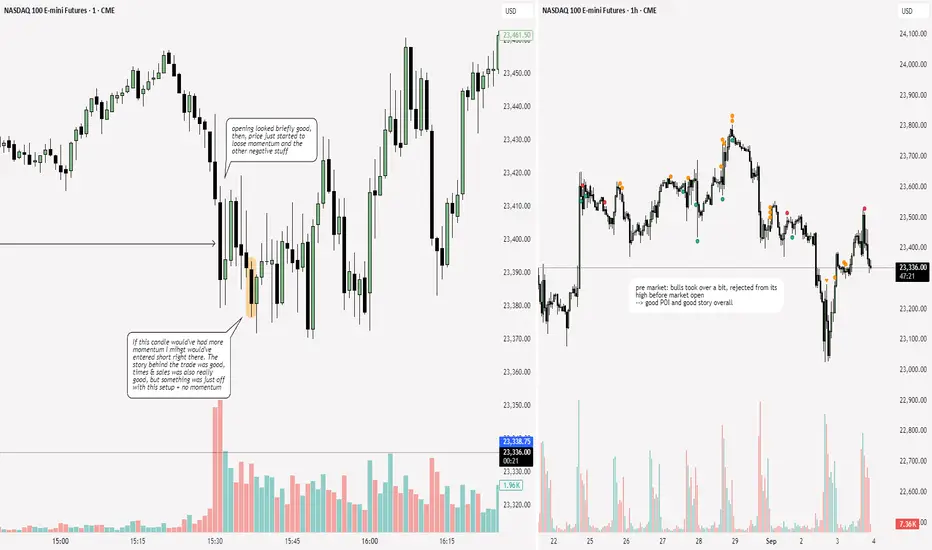
NQ! - September 3rd, 2025 - PMThe market has been beating me up these last few sessions...
I trade NQ futures. Here are my 2 last days of trading.
Good trading to all

NQ: 425th trading session - recapToday was alright, was a bit too tired and overstimulated, gotta change something tomorrow, definitely will...
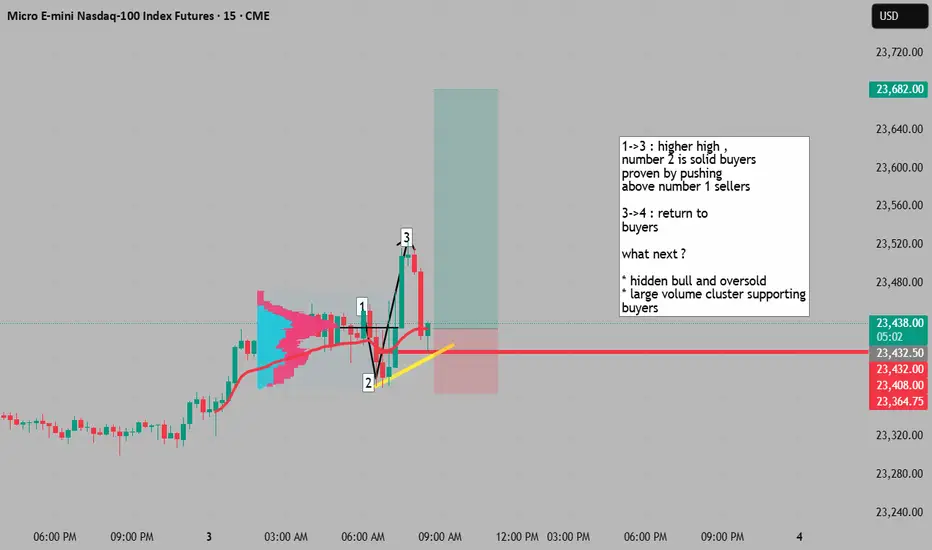
long opportunity with multiple confluences 1->3 : higher high ,
number 2 is solid buyers
proven by pushing
above number 1 sellers
3->4 : return to
buyers
what next ?
* hidden bull and oversold
* large volume cluster supporting
buyers
Targets above and below current price for US market open.Targets above and below current price for US market open.

NQ Power Range Report with FIB Ext - 9/3/2025 SessionCME_MINI:NQU2025
- PR High: 23387.75
- PR Low: 23335.25
- NZ Spread: 117.5
Key scheduled economic events:
10:00 | JOLTS Job Openings
Session Open Stats (As of 12:25 AM 9/3)
- Session Open ATR: 305.21
- Volume: 29K
- Open Int: 276K
- Trend Grade: Long
- From BA ATH: -2.4% (Rounded)
Key Levels (Rounded - Think of these as ranges)
- Long: 24382
- Mid: 23239
- Short: 22096
Keep in mind this is not speculation or a prediction. Only a report of the Power Range with Fib extensions for target hunting. Do your DD! You determine your risk tolerance. You are fully capable of making your own decisions.
BA: Back Adjusted
BuZ/BeZ: Bull Zone / Bear Zone
NZ: Neutral Zone
NQ = September There are 4 candles which create 6 levels.
3 levels are found in Distribution Ranges. The other 3 found in Accumulation ranges.
A Range is 2 or more consecutive candles of the same color.
The first distribution candle in the range is referred to as the "BackSide" candle. This is because is it behind the FrontSide candle.
We mark the top of this candle (wick or body) with the horizontal ray tool,
color it based on the timeframe color code, label it BS for BackSide,
select the line type then organize it's visibility based on timeframe to keep chart scrolling neat. *part of mental analysis and have a clean chart, clean mind, clean desk while in the zone.
The last distribution candle in a range is the "FrontSide" candle. It contains the last two levels. We mark the top of the candle (wick or body) with the horizontal ray tool, label it FS for FrontSide, color it based on the timeframe color code, select the line type and timeframe visibility.
The SwingLow is marked with a horizontal ray tool on the bottom of the FrontSide candle. Mark the wick, not the body. These levels I only mark with solid lines because the represent the boundary of the range.
Once price gets inside a range, it likes to bounce inside of it, testing its fractal ranges on other timeframes. Sometimes we'll see a 4hr level bounce to a 4hr level. Othertime's price stops after a 4hr level at 1hr level (plus 1, minus 1 theory) maybe we'll see it this month.
Happy September
BEARISH ON THE WEEKPrice inverted the bullish FVG so we will go lower for the week as predicted
look for shorts tomorrow. do not buy into the market all moves higher is a fake out.

9/2/25 Key Levels and Supply/Demand ZonesLink to chart: www.tradingview.com
Posting for the YT community fam.

Futures - Commodities / Financial: Nasdaq case (MNQ)+ Strong overnight support zone / ask increasing in volume at the zone. Contrarian trade.
Standard approach:
Applying A+ setup, volume profile (high volume nodes, low volume nodes day and intra-day and possibly extended to swing probability), smart money concept, numerical volume buy/sell side. trend confirmation, tick charts.
