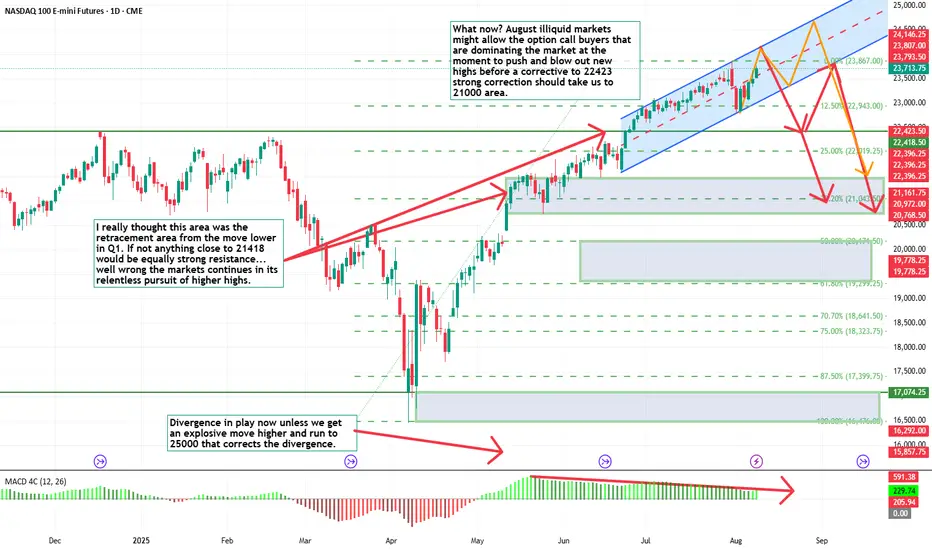
What now for the NQThe chart shows the area i previously believed would contain a corrective move back to retrace the first impulse lower, that is off the table and the question is where is that turning point now.
September likely to get a rate cut, tariffs news having less impact and news about Powell needs to watched.
We have continued divergence and i think after a blow out top we will get a reasonable corrective move.
NQX1! trade ideas
NQ. Market Efficiency Paradigm. Weekly Outlook 10.08.2025, CME_MINI:NQ1!
Covered the daily and hourly order flow.

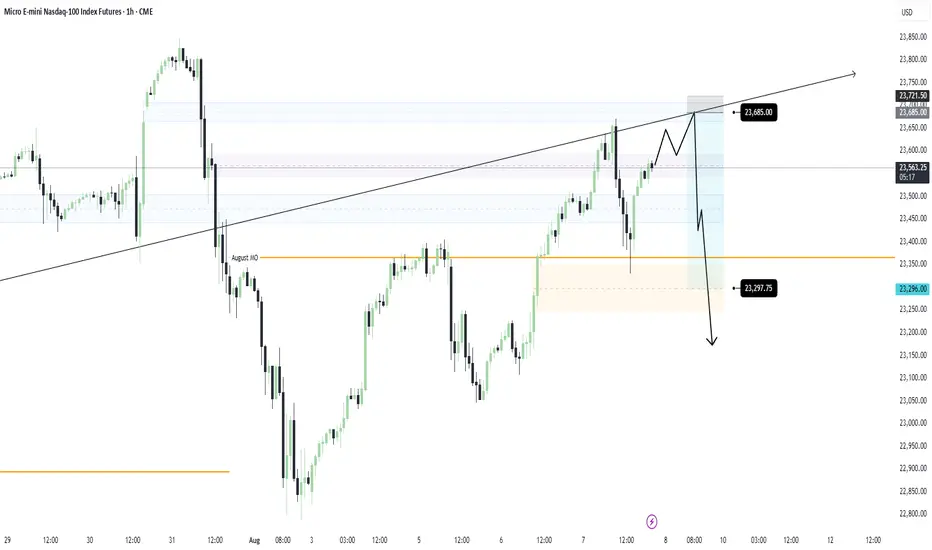
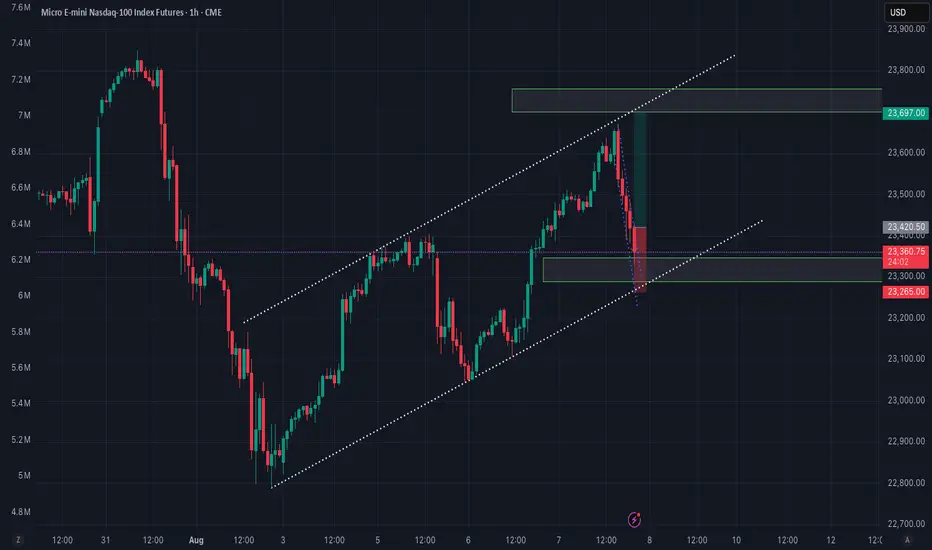
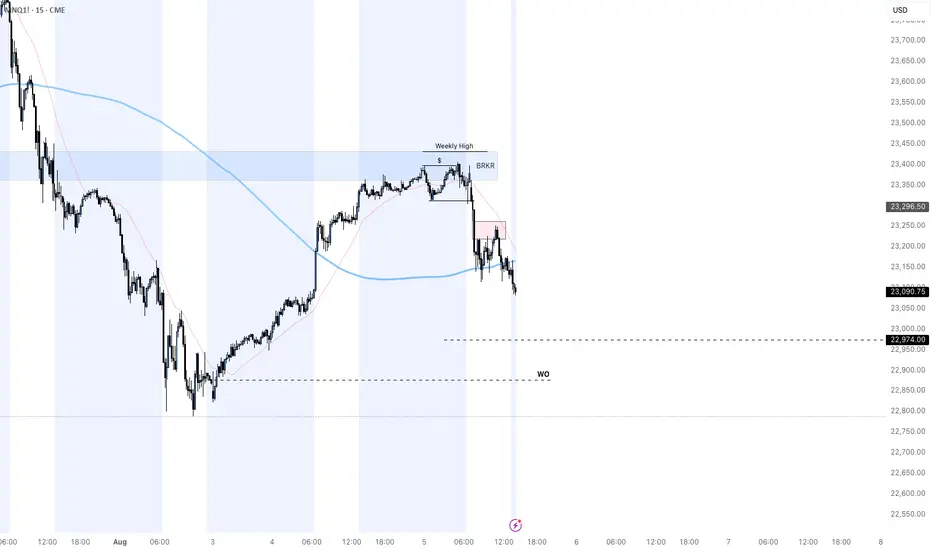
NQ Short Bias: Previous NWOG RejectionI missed today’s sell-off by 60 ticks, but price respected Monthly Open support and retraced back near intraday highs. That reaction reinforces my bias: I’m still anticipating the dump that will likely happen tomorrow.
Ideally, price completes the Double Top within the prior NWOG zone, then falls slightly before or exactly at NY Open for a clean downhill ride.
My entry will be at 23,685.00
Target will be around the low 23,300.00s
I feel like we can definitely fall further than my target, so I will have trailing Stop in place once price reaches my target.
Lets see how this goes⚡
Nq & Es Key Levels 08-08-2025 After from my morning forecastFinally, the price moved up as we predicted before the market opened at 09:30.
Let's make this journey fun. Lets develop system/indicators!Looking for a guy(s) skilled in coding and development, python or pine script. Let's test strategies, I have learned how to trade for 10 years, I lack faith. Started as a student. On graduating, I found ICT and I continue. I think using systems to test strategies would help. So a quant, sort of, with coding knowledge. No compensation on offer, just two (or more) guys and girls working out a way to beat the system and pave a way for themselves. I am M(30). Reach out, lubof!
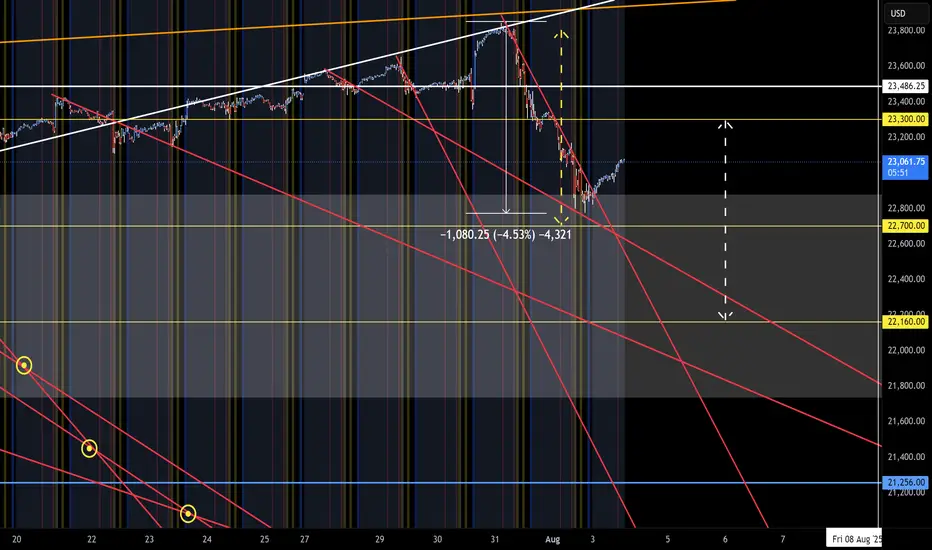
NQ Targets (08-04-25)Many calls did play out last week and looking for some targets to get tested this week. On 7/29 called the Yellow arrow (last week's called range), the white is this week's. NDX has some gaps to retest, YTD chart below and yellow arrows are the targets.
The 30M and 4HR charts are adjusted to match the NDX gaps.
Anyway, the Overnight will be used to redirect the NAZ back up after most drops, this is normal and just beware of the O/N Pump/Dump once the Reg Session starts. Washington Street will spin, Fire, Tweet and do whatever works to get NAZ back above the DZ 23,486. Just watch the Queen spiral out of control should it not. The two day drop erased 23 trading days and those buyers are now loosing money. Should it not come back, the buyers that did not sell (trapped) will sell and send this even lower. Games/tricks can not fix that.
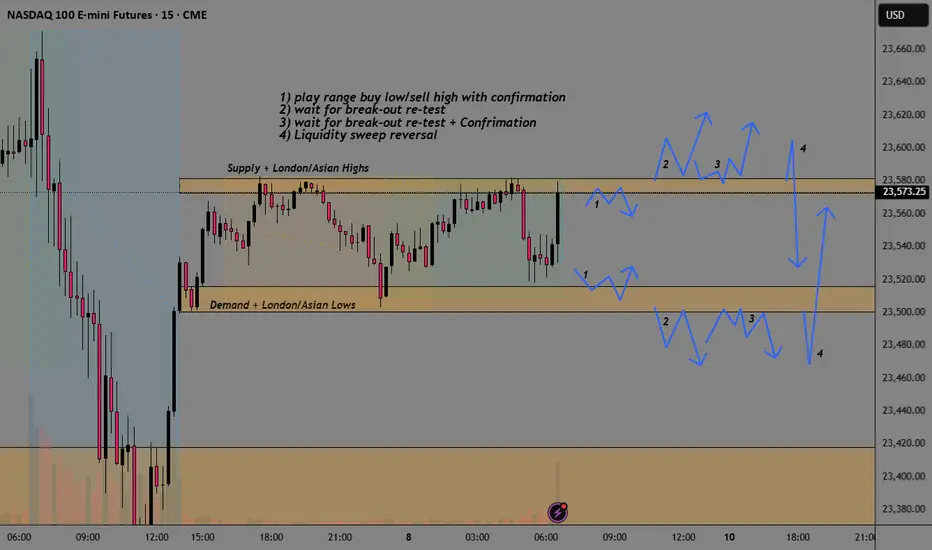
NQ Break-Out AnalysisSee chart from analysis of different options depending on the type of trader and what others are looking at.
1) play range buy low/sell high with confirmation
2) wait for break-out re-test
3) wait for break-out re-test + Confirmation
4) Liquidity sweep reversal
NQ : Short levelThe level has been activated, so you can short it. I have slightly edited it since last time. It is best to scalp or pips it; I cannot promise any significant movement. Be careful when trading on news or at market close/open.
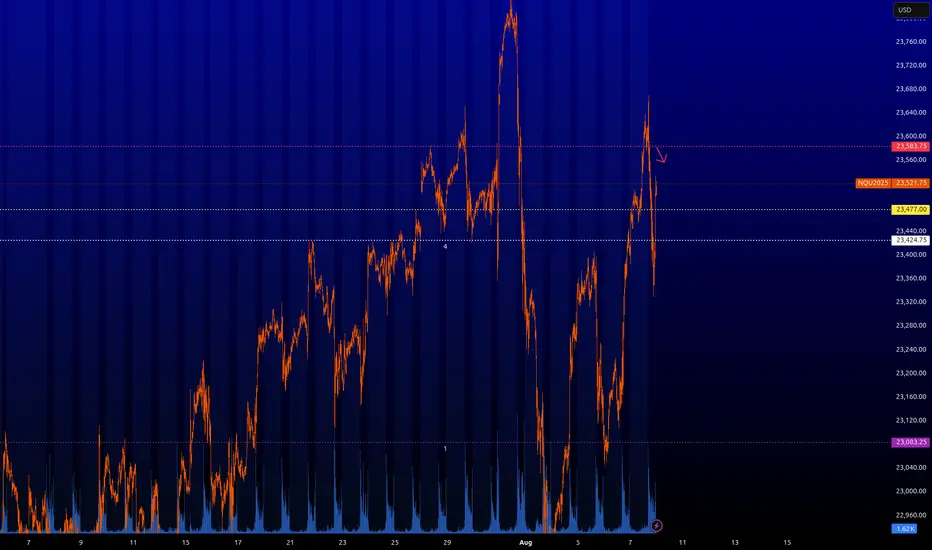
NQ Power Range Report with FIB Ext - 8/8/2025 SessionCME_MINI:NQU2025
- PR High: 23568.00
- PR Low: 23516.00
- NZ Spread: 116.5
No key scheduled economic events
Session Open Stats (As of 12:35 AM 8/8)
- Session Open ATR: 302.51
- Volume: 22K
- Open Int: 282K
- Trend Grade: Long
- From BA ATH: -1.1% (Rounded)
Key Levels (Rounded - Think of these as ranges)
- Long: 23811
- Mid: 22096
- Short: 20383
Keep in mind this is not speculation or a prediction. Only a report of the Power Range with Fib extensions for target hunting. Do your DD! You determine your risk tolerance. You are fully capable of making your own decisions.
BA: Back Adjusted
BuZ/BeZ: Bull Zone / Bear Zone
NZ: Neutral Zone
Mastering One Good Trade for New York Session📍 Trade Overview
Asset: Nasdaq 100 E-Mini Futures
Direction: Short
Entry Price : 23607.0
Exit Price : 23512.85
Date of Trade : 08/07/2025
R:R Target : 5.26
Result: Win
Timeframe: 15min
🧠 Trade Thesis
Behavior of price was the key to this trade around the specific time of New York open along with sweeping the London high combined with an ADR pivot level and a rise in Asian and London for the reversal in New York.
📊 Technical Breakdown
Structure: (M formation, False Breakout, double top)
Key Levels: (HOD supply/demand, pushed above London high, directly at ADR Pivot Level)
Indicators (if any): (e.g., TDI, EMA confluence, RSI divergence)
Volume Behavior: (3 pushes into the high for NY open, stop hunt, bearish engulfing on the 15 and 5 minute)
⏱️ Timing
Session: NYC
Minute of Entry: Early in the session / 10:10amEST
Context in Session: Breakout window, equities hour
🧩 Execution Details
Entry Trigger: (Candle close confirmation with a bearish engulfing)
Stop Loss Location: (Above wick of 5 minute entry candle)
Target: (ADR / measured move)
🔍 Post-Trade Analysis
What went right?
Price instantly rejected the level it was at and reached target fairly quickly.
What could have been better?
Could have taken YM for a better setup instead.
Would I take this trade again? Yes. A+ setup but not A+++ due to it not being at a major level like the other indices were.

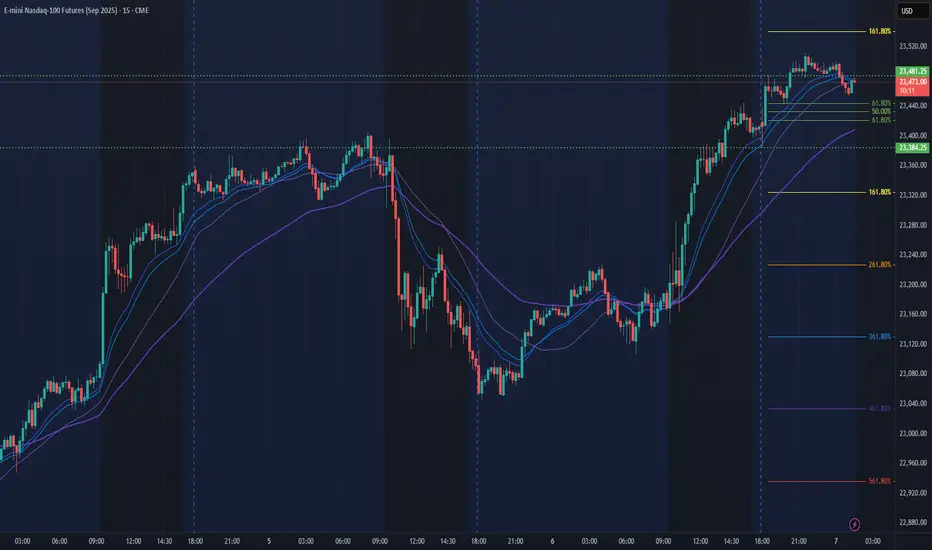
Nasdaq longPossible trade shaping up on the Nasdaq.
1hr trendline a channel with a 50-61.8% fib zone
Previous days profile providing a low volume node as support
5min counter trend failure for possible breakout point. Otherwise, previous lower high or resistance might be worth looking at
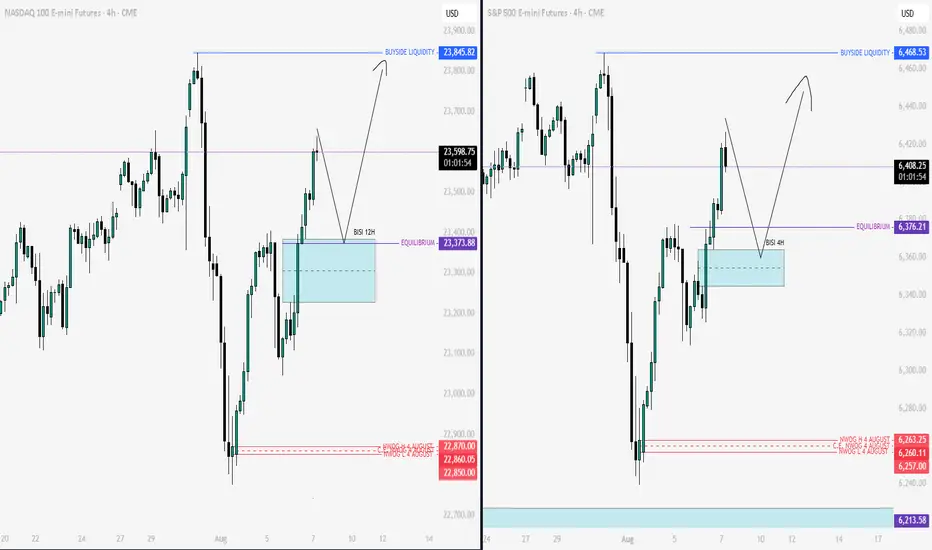
Nq & Es Key Levels & Scenarios 07-08-2025It’s clear that we’re currently operating within a premium zone of the range. The directional bias remains bullish, but I’m anticipating the potential for a short-term short setup around the 09:30 AM New York open, allowing for a retracement before continuation higher.
I will not look for long setups unless price trades back into a discount zone, or at the very least, rebalances toward the equilibrium (50% of the dealing range). If price continues to rally without offering such a pullback, I’m fully prepared to stay sidelined — discipline over FOMO.
Wishing everyone clean, high-probability setups today.
NQ Power Range Report with FIB Ext - 8/7/2025 SessionCME_MINI:NQU2025
- PR High: 23481.00
- PR Low: 23384.50
- NZ Spread: 216.25
Key scheduled economic events:
08:30 | Initial Jobless Claims
13:00 | 30-Year Bond Auction
Session Open Stats (As of 12:35 AM 8/7)
- Session Open ATR: 305.25
- Volume: 34K
- Open Int: 285K
- Trend Grade: Long
- From BA ATH: -1.5% (Rounded)
Key Levels (Rounded - Think of these as ranges)
- Long: 23811
- Mid: 22096
- Short: 20383
Keep in mind this is not speculation or a prediction. Only a report of the Power Range with Fib extensions for target hunting. Do your DD! You determine your risk tolerance. You are fully capable of making your own decisions.
BA: Back Adjusted
BuZ/BeZ: Bull Zone / Bear Zone
NZ: Neutral Zone
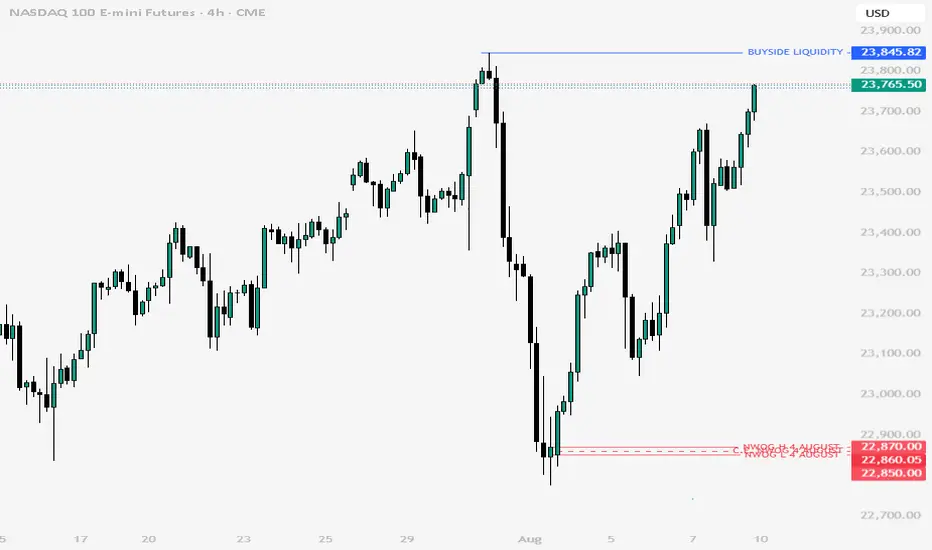
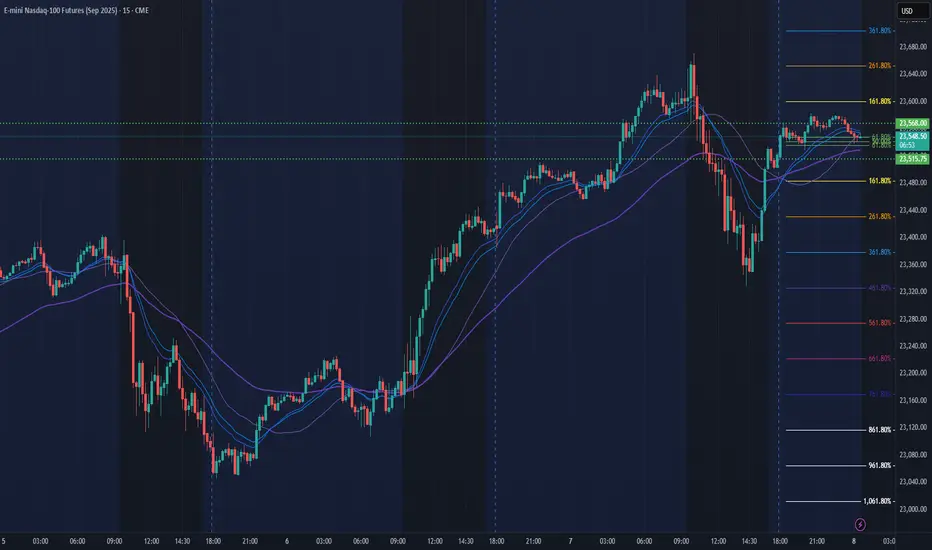
NQ heading back to weekly AVL🕵️ Chart Overview
• Instrument: MNQ1! (Micro Nasdaq Futures, continuous contract)
• Timeframe: 4H
• Method: Volume Profile + Price Action + Supply/Demand
⸻
🔷 Technical Commentary
Entry Zone
• Price Range: 23,463.25 – 23,608.25
• Context: Clearly marked supply zone formed after a strong rejection wick and drop, likely a mitigated order block or an area with resting sell orders.
• Price recently tapped into the bottom edge of this zone and is showing signs of reaction.
• You’re targeting this as an ideal short re-entry point on a retracement move.
Confluence Factors
• Volume Profile: High volume node (HVN) just below the entry zone, suggesting this area previously acted as fair value before price got rejected.
• Structure: Bearish internal structure shift after that strong swing high. Price created a lower high and lower low, supporting the short idea.
• Clean break & retest: You’ve waited for the pullback to a previous area of interest—textbook risk-efficient trading.
TP Area
• Target Range: ~22,800s zone
• Likely drawn from:
• Previous demand area
• Volume gap / low-volume node
• Strong bounce from this zone last time suggests it’s a key support.
• Gives a nice 2–2.5R setup, depending on your SL.
⸻
🧠 Trade Logic Summary
• Bias: Bearish
• Entry: Short within the 23,463.25 – 23,608.25 zone (watch for rejection wicks / internal breakdown on LTF).
• Confirmation: Price reaction or reversal pattern in the zone (e.g., bearish engulfing, LTF BOS).
• TP: 22,800 region (just above the previous demand zone)
• SL: Just above 23,608.25 to invalidate the idea.
⸻
✅ Strengths
• Clear market structure shift
• Volume Profile confirmation
• Defined RR with institutional-style entry
• Good use of supply zone logic (not chasing entries)
⸻
⚠️ Things to Monitor
• If price closes above 23,608, setup invalidates and you may be looking at a liquidity grab and continuation to 23,800+
• Watch for bullish absorption in your entry zone. That would be a red flag.
• NFP / FOMC or any other scheduled macro events? Check the calendar before execution.

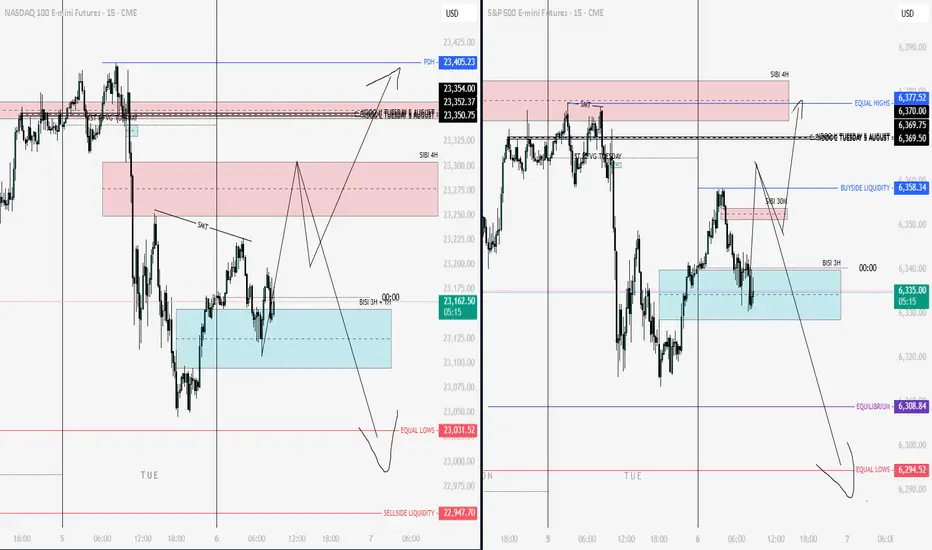
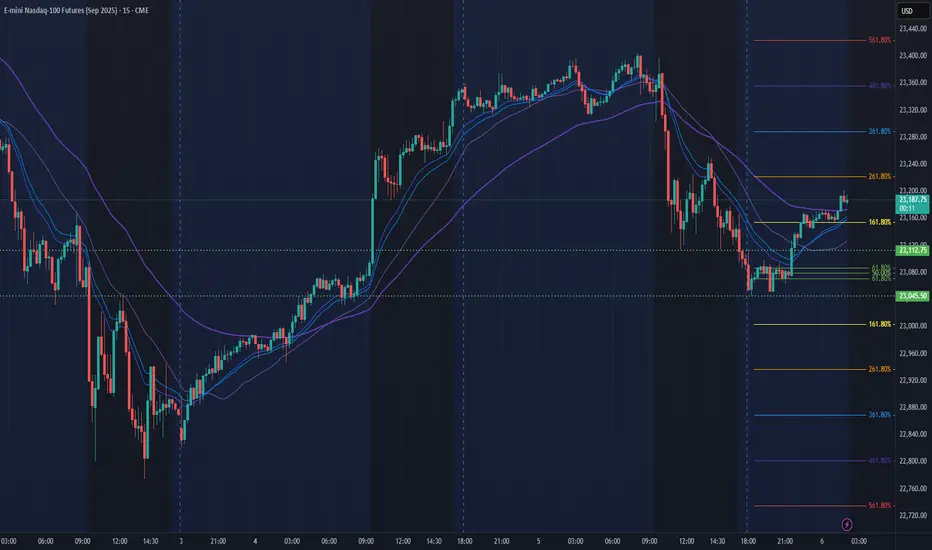
NQ & ES Key Levels 06-08-2025"To determine which of the two scenarios is more likely to play out, we first need to see how the market opens. Based on the price action and how key levels are respected, we’ll gain clarity on the setup we’re looking for. Price is currently at a critical point, with probabilities at roughly 50-50 — so there’s no clear bias yet. However, we’re well aware of the key levels and zones we’re focused on."
NQ Power Range Report with FIB Ext - 8/6/2025 SessionCME_MINI:NQU2025
- PR High: 23112.75
- PR Low: 23045.50
- NZ Spread: 150.25
Key scheduled economic events:
10:30 | Crude Oil Inventories
13:00 | 10-Year Note Auction
Look above & fail Friday-Monday highs
Session Open Stats (As of 12:35 AM 8/6)
- Session Open ATR: 299.58
- Volume: 32K
- Open Int: 277K
- Trend Grade: Long
- From BA ATH: -2.8% (Rounded)
Key Levels (Rounded - Think of these as ranges)
- Long: 23811
- Mid: 22096
- Short: 20383
Keep in mind this is not speculation or a prediction. Only a report of the Power Range with Fib extensions for target hunting. Do your DD! You determine your risk tolerance. You are fully capable of making your own decisions.
BA: Back Adjusted
BuZ/BeZ: Bull Zone / Bear Zone
NZ: Neutral Zone
MNQ SHORT POSITION both setups played out **7:15 AM**
CME_MINI:MNQ1!
one thing to note is I have to be in control with my trigger finger I entered a 2nd position for mnq at the end of the moving into the consolidation lost about 40% of my move ending the day at 300$ after being up 437$
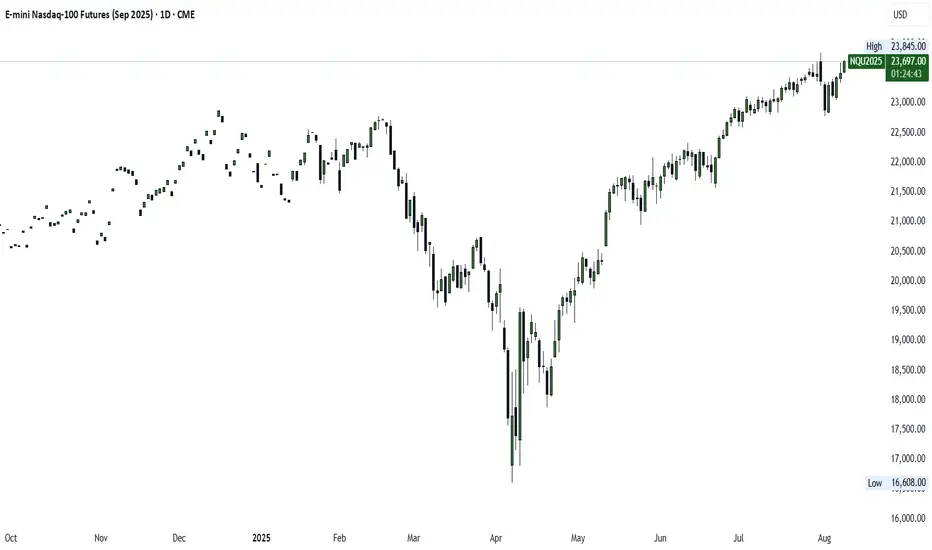
Calm Before a StormSince the post-COVID period, we have not seen such a gentle and continuous uptrend. This phenomenon reminds me of the market before the COVID meltdown.
How do I going to interpret this "Gentle & Continuous Uptrend" move?
My answer: Cautiously bullish
Back then, market was cautiously bullish because COVID seemed to be contagious.
It has triggered.
Now, market is cautiously bullish because tariffs appear to be deepening inflation. With slowing job numbers, this is becoming a bigger concern.
Will it trigger?
Mirco Nasdaq Futures and Options
Ticker: MNQ
Minimum fluctuation:
0.25 index points = $0.50
Disclaimer:
• What presented here is not a recommendation, please consult your licensed broker.
• Our mission is to create lateral thinking skills for every investor and trader, knowing when to take a calculated risk with market uncertainty and a bolder risk when opportunity arises.
CME Real-time Market Data help identify trading set-ups in real-time and express my market views. If you have futures in your trading portfolio, you can check out on CME Group data plans available that suit your trading needs www.tradingview.com

NASDAQ 100 BOUNCE OFF SUPPORT FROM BUY ZONE!Hey Traders so today looking again at the Nasdaq 100 looks like we got a bounce right off the level of support that I thought it could hold 22,806.
Why that level?
I trade off the daily charts so every candle is one day and I believe that price action is everything in these markets it's all about support and resistance. The market tried 9 days to test that level from 07/03-07/15. But it kept getting rejected then it rallied off it so I just felt that maybe thats a level that the market might halt some of the selling. Ok so maybe I got it right yay!
Guess what? Sometimes we will get it completely wrong! So getting market direction right is only half the battle. The key is risk management.
I have learned it's not how we enter a trade that counts but how we exit. Can we get out with a profit? Ok enough of the classroom for today. 🤓
So where are we market bounced off support at 22,800 yes you are in profit if you took buy zone but we also have risk still in the trade so I say lower the risk by moving the stop about half way up from 22,533 to 22,700. That way if there is a market reversal we don't get stopped out at full loss. Then try to stay 3 days behind the market so it has room to breathe if it can test the all time high again at 22,830 that would be a great place to take some profits!
This is the way I stay 3 days behind the market. But if you have another profit strategy that works better then continue to do what works for you.
However if bearish way until market breaks a strong support level before consider selling into rally.
COT REPORT
LARGE SPECS = NET LONG 34,954
So lets see what happens this week.
Good Luck & Always use Risk Management!
(Just in we are wrong in our analysis most experts recommend never to risk more than 2% of your account equity on any given trade.)
Hope This Helps Your Trading 😃
Clifford

The right time to short nasdaqI shorted when the Nasdaq hit a cluster of prior highs—a well-defined resistance shelf that charts show often attracts heavy supply and stalls rallies, making it a textbook spot where sellers overpower buyers
. Fading the move at that ceiling gives a favorable risk-reward: if price rejects the level, downside potential is wide while upside is capped just beyond the barrier

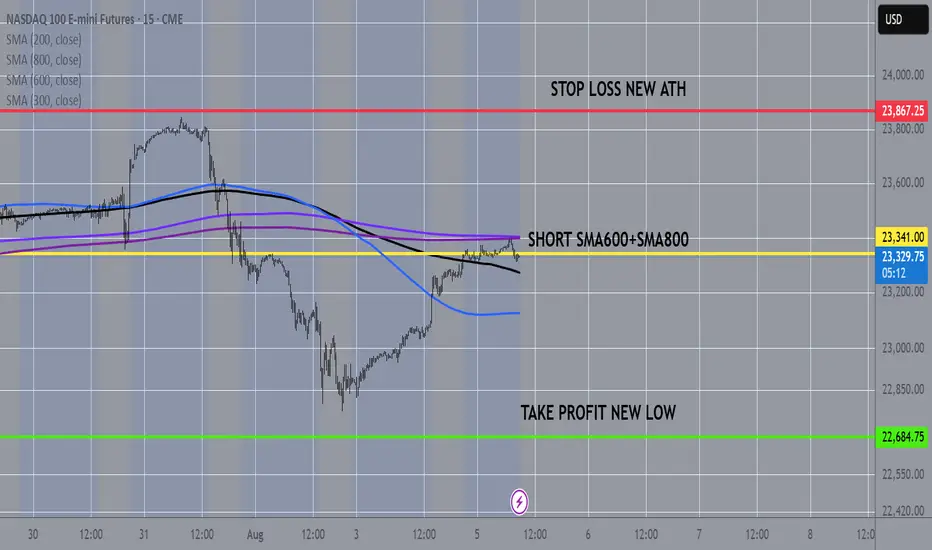
NASDAQ100 15MIN CHART FROM SMAS TO NEW LOWNasdaq100 at 10 and 15min chart touches the sma600 and the sma800 so as in many other cases before, odds are are more that it will fall from here to a new low
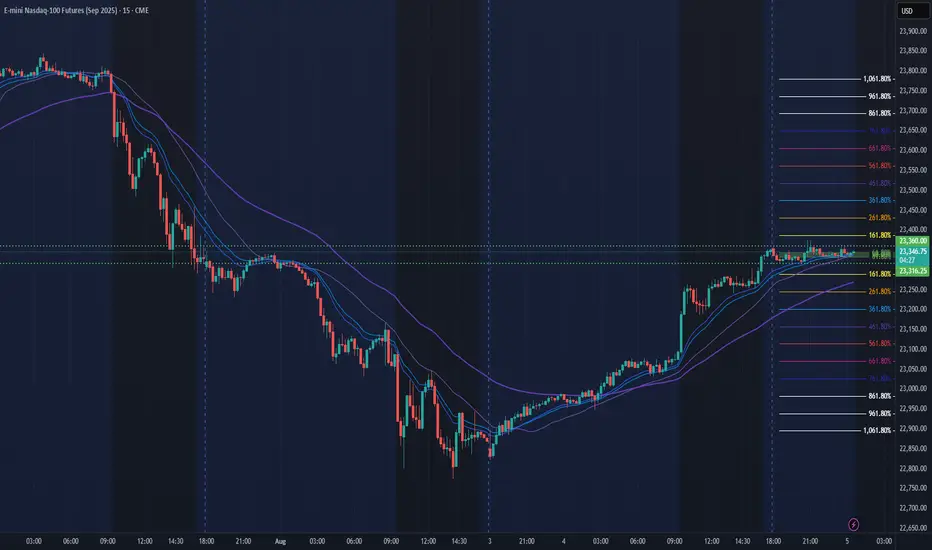
NQ Power Range Report with FIB Ext - 8/5/2025 SessionCME_MINI:NQU2025
- PR High: 23360.00
- PR Low: 23316.25
- NZ Spread: 97.75
Key scheduled economic events:
09:45 | S&P Global Services PMI
10:00 | ISM Non-Manufacturing PMI
- ISM Non-Manufacturing Prices
Session Open Stats (As of 12:35 AM 8/5)
- Session Open ATR: 294.27
- Volume: 23K
- Open Int: 278K
- Trend Grade: Long
- From BA ATH: -2.0% (Rounded)
Key Levels (Rounded - Think of these as ranges)
- Long: 23811
- Mid: 22096
- Short: 20383
Keep in mind this is not speculation or a prediction. Only a report of the Power Range with Fib extensions for target hunting. Do your DD! You determine your risk tolerance. You are fully capable of making your own decisions.
BA: Back Adjusted
BuZ/BeZ: Bull Zone / Bear Zone
NZ: Neutral Zone
NQ: 230th trading session - recapReally good session today - won't be here tomorrow PROBABLY. I'll do a mental recap of the day after it's over. Again, I'm away for holidays. Maybe I should take the time off too. Maybe. Just maybe.
