RTY UpdateWell, I moved my stuff into storage, and sold my house in WA. Gold looks topped out (or close enough that I don't want to play it any more), so I'm back in the stock market again.
I noticed today that a bunch of crap stocks like RH bounced today after a selloff the last week or two. One that caug
Related futures
Markets Mixed Ahead of Data DayMarkets are seeing a nice mix of positive and negative moves on the day today, with the equity and precious metals markets broadly trading lower. The Russell led the equities lower trading down near 0.7% while the Gold and Silver market were lower by over 1% each on the day. Both of these markets ha
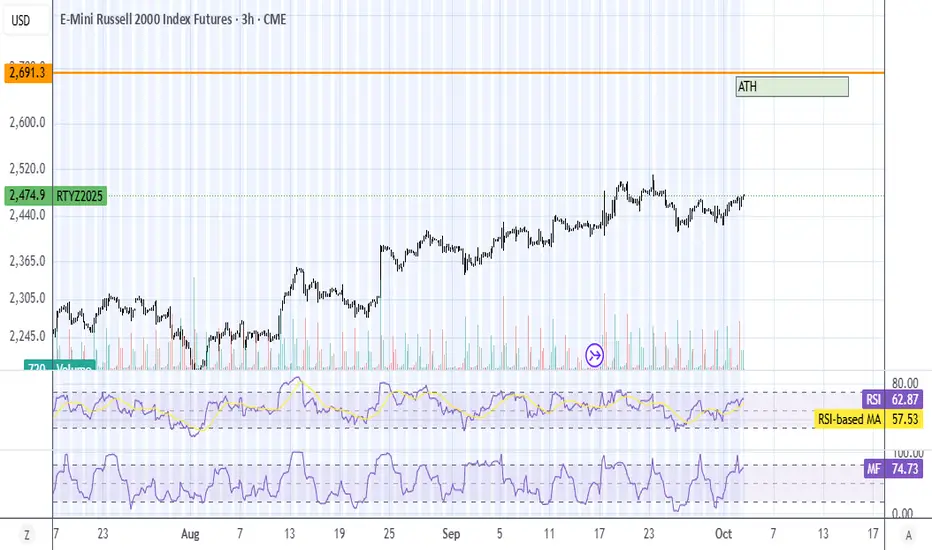
Bulls Spring-Load at VWAP - Next Leg Higher📝 To see my confluences and/or linework, step 1: grab chart 📊, step 2: unhide Group 1 in object tree 🌳, step 3: hide and unhide specific confluences ✨
🔥 RTYZ25: Bulls Spring-Load at VWAP - Next Leg Higher
The Market Participant Battle:
Bears attempted to push Russell 2000 futures below the cri

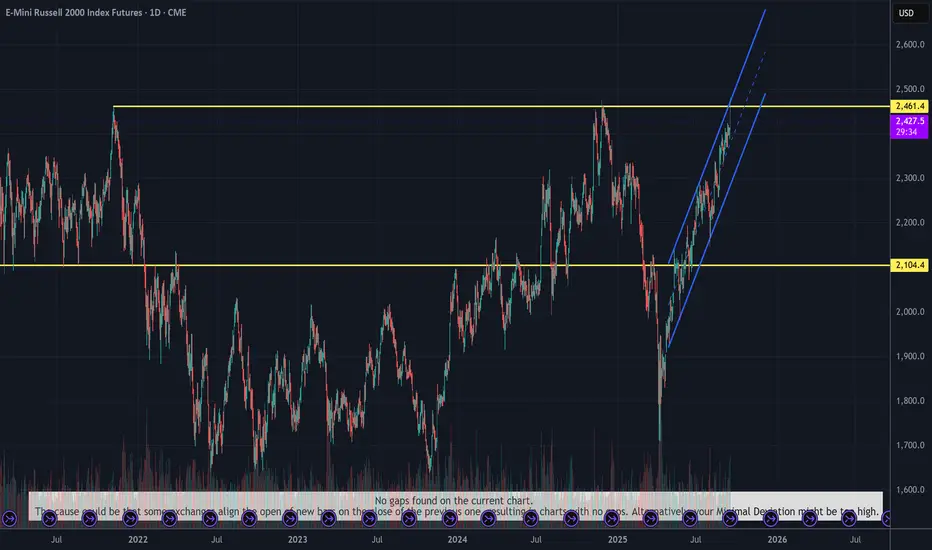
Triple Top and Parallel ChannelBullish Scenario (Breakout Long):
Trigger: A decisive break above the resistance confluence (~2,500) with a daily close. Ideally, look for increased volume to confirm conviction.
Entry Strategy: Wait for a retest of the broken resistance as new support (e.g., pullback to 2,480-2,500). This red
Bulls Spring-Load at VWAP - FOMC Catalyst Ready🎯 RTY: Bulls Spring-Load at VWAP - FOMC Catalyst Ready
The Market Participant Battle:
Bears attempted to push Russell 2000 futures below the critical 2400 psychological level but were definitively beaten by institutional bulls who defended the VWAP and Volume Point of Control (VPOC) support zone

Russell Leads Equities Higher With Fed Decision Today was a well anticipated Fed meeting over the last few weeks as it has been priced in as the first interest rate cut of the year. The probabilities were accurate and traders saw a 25-basis point interest rate cut today, and the S&P and Nasdaq saw some back and forth price movement before finishi
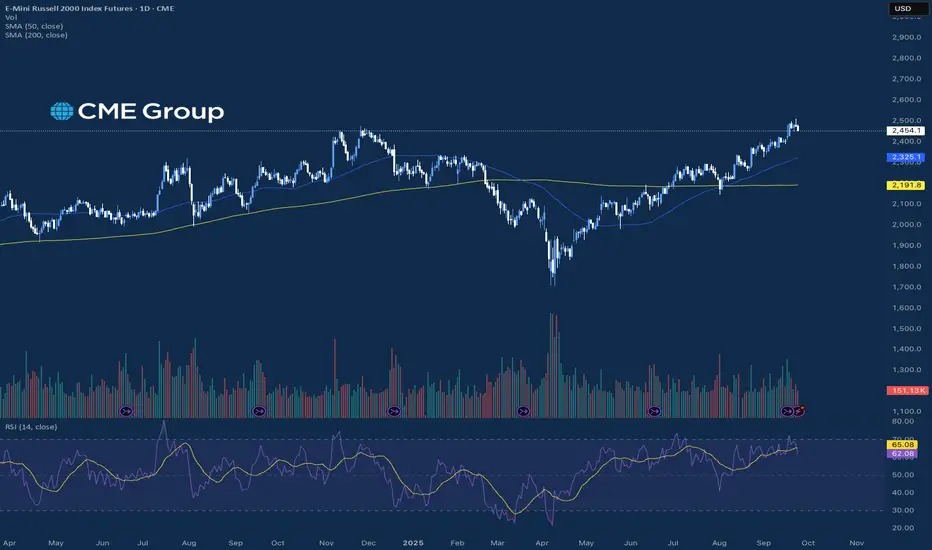
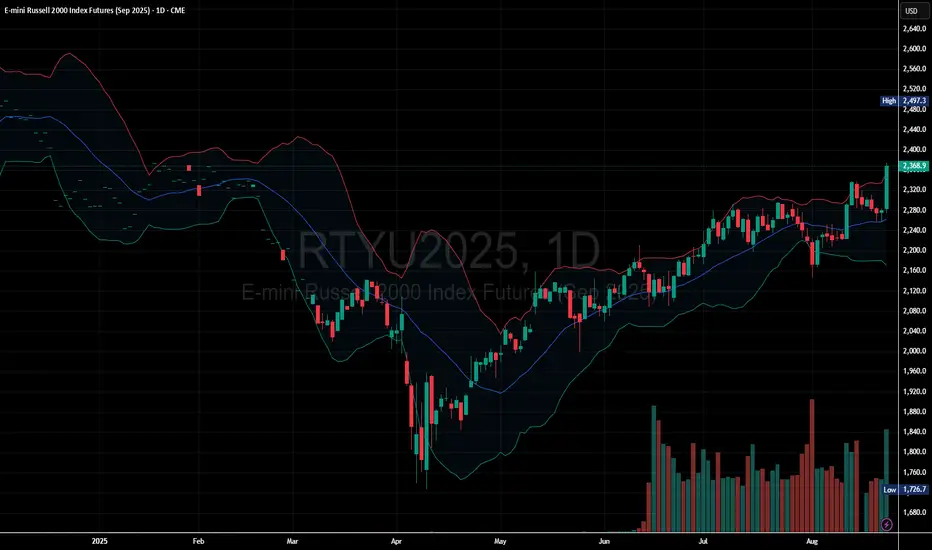
Russell 2000 Futures: Bullish Breakout in Play
Price is trading above the blue mid-band, confirming bullish momentum.
The slope of the mid-band is upward, further supporting the trend.
Uptrend intact, with bullish continuation.
Strong breakout candle above consolidation, supported by volume.
Bullish as long as price holds above 2,280 suppo
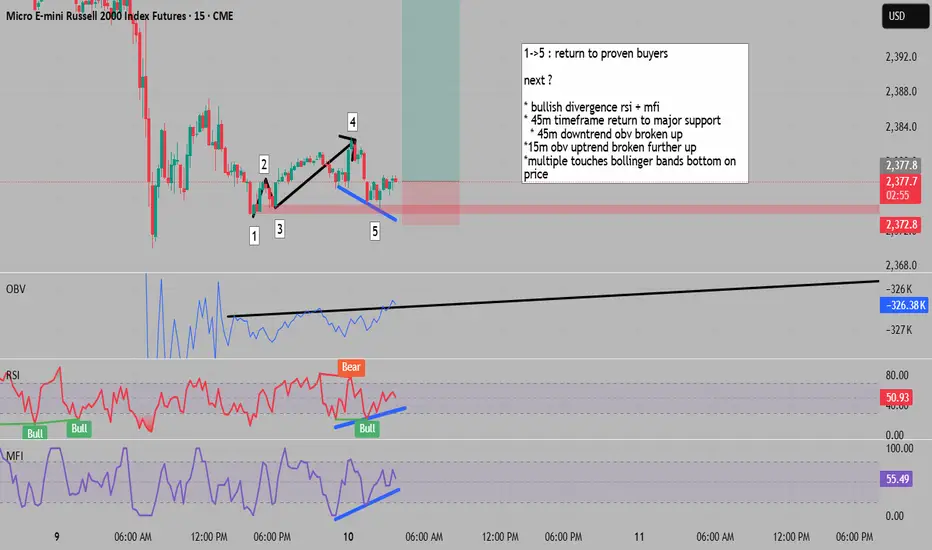
reutrn to support presents on-trend buy opportunity multiple tf1->5 : return to proven buyers
next ?
* bullish divergence rsi + mfi
* 45m timeframe return to major support
* 45m downtrend obv broken up
*15m obv uptrend broken further up
*multiple touches bollinger bands bottom on price
a potential to buy, or will mr.bordendoff dump eeet1->4 : return to proven buyers at 2 :
next ?
* bullish divergence rsi+mfi
* oversold rsi+mfi
* bb break obv
* 1st std vwap
* 1-2 swing poc volume

return to proven buyers gives entry at market edge 1->4 : return to proven buyers at number 2
next :
* bullish divergence rsi and mfi
*obv is in uptrend
* number 3 and 4 hit 2nd std. vwap
* number 2 3 and 4 pierce BB deviation markers

See all ideas
Summarizing what the indicators are suggesting.
Neutral
SellBuy
Strong sellStrong buy
Strong sellSellNeutralBuyStrong buy
Neutral
SellBuy
Strong sellStrong buy
Strong sellSellNeutralBuyStrong buy
Neutral
SellBuy
Strong sellStrong buy
Strong sellSellNeutralBuyStrong buy
A representation of what an asset is worth today and what the market thinks it will be worth in the future.
Displays a symbol's price movements over previous years to identify recurring trends.
Frequently Asked Questions
The current price of E-Mini Russell 2000 Index Futures is 2,497.4 USD — it has risen 0.73% in the past 24 hours. Watch E-Mini Russell 2000 Index Futures price in more detail on the chart.
The volume of E-Mini Russell 2000 Index Futures is 11.96 K. Track more important stats on the E-Mini Russell 2000 Index Futures chart.
Open interest is the number of contracts held by traders in active positions — they're not closed or expired. For E-Mini Russell 2000 Index Futures this number is 360.15 K. You can use it to track a prevailing market trend and adjust your own strategy: declining open interest for E-Mini Russell 2000 Index Futures shows that traders are closing their positions, which means a weakening trend.
Buying or selling futures contracts depends on many factors: season, underlying commodity, your own trading strategy. So mostly it's up to you, but if you look for some certain calculations to take into account, you can study technical analysis for E-Mini Russell 2000 Index Futures. Today its technical rating is buy, but remember that market conditions change all the time, so it's always crucial to do your own research. See more of E-Mini Russell 2000 Index Futures technicals for a more comprehensive analysis.