Dovish Agenda & AI Boom Propel Nikkei to Record HighsJapan’s Nikkei-225 surged past 51,000, reflecting renewed confidence in the nation’s growth outlook. The rally has strengthened under the new PM, Sanae Takaichi, whose pro-market reforms and fiscal agenda have revived optimism reminiscent of Abenomics.
Takaichi’s Dovish Ambitions Set the Stage for Japan’s Next Growth Phase
Optimism over pro-spending policymaker Sanae Takaichi’s incoming government has lifted sentiment across Japanese markets.
Japan’s new PM is preparing an economic stimulus expected to surpass last year’s ¥13.9 trillion (USD 92 billion) package, aimed at easing inflationary pressures on households while channelling investment into high-growth industries and national security.
Her “responsible proactive fiscal policy” mirrors Abenomics, restoring confidence in continuity and state-led growth. Yet, it offers little hope of changing Japan’s renowned legacy of short-lived prime ministers.
Despite winning the LDP leadership, her minority government relies on support from the Japan Innovation Party. Still, history suggests that when a dovish leader takes office, the Nikkei-225 often rallies, even amid political uncertainty. We previously explored this trend in detail.
Foreign Investors Flock to Japan Amid AI Boom
After modest outflows in September, October marked a sharp turnaround for Japan, with foreign investors returning as net buyers.
Source: Japan Exchange Group
Beyond confidence in Takaichi’s policies, the rally is driven by optimism that the global AI investment boom still has room to grow, boosting demand for Japan’s tech-heavy stocks.
Meanwhile, concerns over high U.S. valuations & policy uncertainty are prompting investors to rotate capital from the West towards Japan.
Moreover, according to Bloomberg, only 43 of Nikkei 225 components advanced on 29/Oct, the fewest ever for a gain above 1.7%.
The rally was driven by strong gains in the Electronic Technology and Communications sectors, where AI-related optimism remains the dominant force. Advantest Corp, a chip-testing equipment supplier, surged a record 22% after hiking its annual profit outlook on booming semiconductor demand, while SoftBank Group continues to anchor market momentum.
The outsized contribution from a handful of tech and conglomerate names underscores the rally’s narrow breadth. If global AI enthusiasm cools or profit-taking sets in, Japan’s market could face a short-term correction, exposing the fragility behind its headline strength.
BoJ’s Softer Stance Fuels Yen Slide, Aids Nikkei's Outlook
The BoJ’s dovish turn in October sent the yen lower as traders dialed back expectations of near-term tightening. Under newly elected Prime Minister Takaichi, a supporter of loose monetary policy, the BoJ opted for patience, softening its earlier hawkish tone.
Governor Ueda signaled flexibility for a possible hike later this year but stressed the need to gauge wage and growth trends first. With the yen and Nikkei-225 moving inversely, this renewed dovishness could keep the yen weak and bolster the Nikkei-225.
Navigating Nikkei with CME Nikkei-225 Futures
This year, we have seen a sharp response to political signals, particularly when leadership changes hint at a more accommodative or growth-oriented policy stance.
The most recent example came in September 2025, when Prime Minister Shigeru Ishiba announced his resignation on 07/Sep. The move sparked optimism that his successor would adopt a more expansionary economic agenda.
Consequently, the Nikkei-225 surged past the key 44,000 mark for the first time on 09/Sep. Investors bullish on Japanese equities could gain from holding a long position in CME’s Micro Nikkei (JPY) futures to express this view.
A long CME Micro Nikkei (JPY) futures position opened at 42,505 on 26/Aug and closed a week later at 44,170 on 09/Sep would have generated a gain of (44,170 – 42,505) × 50 = ¥83,250 (~USD $565).
However, Japanese markets are quick to react to political uncertainty. After a record rally on 09/Oct, the Nikkei-225 tumbled the next day when the Komeito Party announced its exit from the ruling coalition with the LDP. The move raised doubts about Takaichi’s confirmation as prime minister and, by extension, the durability of the “Takaichi trade.”
A long CME Micro Nikkei (JPY) futures position opened at 48,660 on 09/Oct & closed at 46,990 on 14/Oct would have booked a loss of (46,990 - 48,660) × 50 = ¥83,500 (~USD 550).
Equity Index Futures enable investors to harvest gains from expected index moves. It also helps astute investors and risk managers to build protection against falling markets.
This content is sponsored.
MARKET DATA
CME Real-time Market Data helps identify trading set-ups and express market views better. If you have futures in your trading portfolio, you can check out on CME Group data plans available that suit your trading needs tradingview.com/cme .
DISCLAIMER
This case study is for educational purposes only and does not constitute investment recommendations or advice. Nor are they used to promote any specific products, or services.
Trading or investment ideas cited here are for illustration only, as an integral part of a case study to demonstrate the fundamental concepts in risk management or trading under the market scenarios being discussed. Please read the FULL DISCLAIMER the link to which is provided in our profile description.
Trade ideas

Nikkei Futures Reach Historic Highs, Extending Bullish RallyThe short-term Elliott Wave analysis for Nikkei Futures (NKD) indicates a robust bullish trend, with the Index recently achieving a new all-time high. The rally to 49,030 marked the completion of wave ((3)), followed by a pullback to 45,344, which concluded wave ((4)). The internal structure of wave ((4)) developed as a zigzag Elliott Wave pattern. From the peak of wave ((3)), wave (A) declined to 47,410, followed by a wave (B) rally to 47,985. The Index then extended lower in wave (C), reaching 45,344, finalizing wave ((4)) in the larger degree.
The Index has since resumed its upward trajectory in wave ((5)). From the wave ((4)) low, wave 1 advanced to 48,030, with a subsequent wave 2 pullback concluding at 46,600. The Index then surged in wave 3 to 48,390, followed by a wave 4 dip to 47,720. The final leg, wave 5, reached 48,650, completing wave (1). A corrective wave (2) followed, ending at 47,145 in a zigzag structure. The Index has now resumed its ascent within wave (3). In the near term, as long as the pivot low at 45,344 holds, expect pullbacks to attract buyers in 3, 7, or 11 swings, supporting further upside in the Nikkei Futures.

Why does Nikkei falls this big (even bigger than HSI), plan B?The Nikkei 225 fell harder than almost everyone on Friday — even more than the HSI, S&P 500, Dow, Nasdaq, and yes, gold held up better. The reason? POTUS’ new tariff warning on China hit Japan’s export-heavy market right where it hurts.
When global trade looks shaky, Japan’s big names — autos, chips, and industrials — feel it first. A stronger yen didn’t help either, cutting into exporter profits.
The index broke below support near 47,800, and the next key zone sits around 45,200. It’s still in a long uptrend, but the pullback shows momentum cooling fast.
So, what’s plan B? Pretty simple — weaker yen, calmer headlines, and maybe a bit of good news from the U.S. Until then, the Nikkei might need to catch its breath.

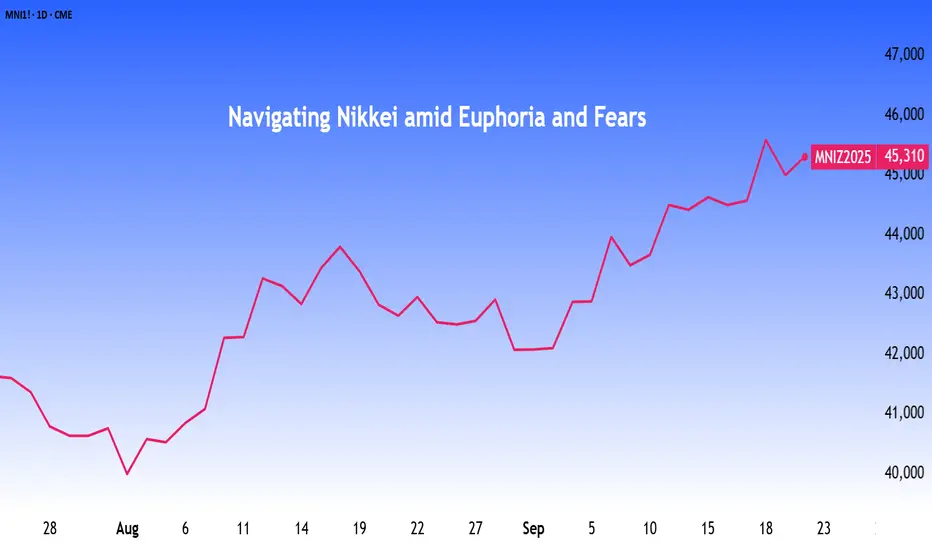
Navigating Nikkei amid Euphoria and Fears Central banks can and do sway markets. The Nikkei-225, propelled by central bank actions in the US & Japan soared to all time high before pulling back sharply on Friday.
However, momentum snapped when BoJ unveiled its plan to offload risk assets off its balance sheet. This has cast doubt on the rally’s durability.
Nikkei Rockets Past 45,000 on Tech Surge and Fed Rate-Cut
Japan’s Nikkei-225 closed above the 45,000 mark on Thursday (18/Sep), powered by rally in tech stocks & wave of optimism after the US Fed’s 25-basis-point rate cut .
By last Friday (19/Sep), the index was scaling new record highs as investors looked ahead to the BoJ’s policy decision. Rates were anticipated to stay unchanged at around 0.5%. Market optimism was also lifted by data showing core inflation slowed to 2.7% in August, its lowest since November 2024 and the third straight month of easing.
Nikkei Edging Lower when BoJ Begins Gradual Unwinding of Stimulus
The BoJ held rates steady at around 0.5%, with seven of nine policymakers in favor. It also unveiled plans to shed riskier assets from its balance sheet.
The central bank will begin offloading its ETF holdings at about 330 billion yen a year, while gradually trimming its J-REIT holdings by around 5 billion yen annually, pacing the sales to avoid jolting markets. The Nikkei 225 gave up early gains and closed in the red on this news.
Foreign Investors Start Pulling Out of Japanese Equities
Foreign investors are retreating from Japanese equities, taking profits following record rally. Softer trade data has raised doubts about Japan’s export-driven recovery. At the same time, worries over global growth and potential recession are weighing on sentiment, prompting overseas investors to lock in gains.
Source: ( Japan Exchange Group )
Technical Indicators Hint at Potential Pullback
Prices hold above the short-term MA, but momentum is clearly fading. The MACD remains above the signal line, yet the shrinking green histogram signals weakening bullishness.
Meanwhile, the RSI retreating from 73.81 to 64.51 shows buying pressure is easing, suggesting the Nikkei-225 may be entering a consolidation or pullback phase.
Bollinger Bands suggest the same. The uptrend remains intact, and buyers are still pushing prices higher, but the rally appears overextended, making the market susceptible to a short-term pullback.
Prices traded between 0% and 38.2% Fibonacci retracement levels. In the near term, absent material news flow, Micro Nikkei-225 futures are expected to trade between JPY 44,424 (serving as support) & JPY 45,700 (serving as resistance).
Hypothetical Trade Setup
In the short term, the Nikkei-225 faces pressure from potential foreign selling as global growth concerns persist. Japan’s safe-haven appeal appears fragile, heightening the risk of a near-term pullback.
Set against this backdrop, managers can manage their portfolio risk using the CME yen-denominated Micro Nikkei Futures contract to protect from drawdowns and to hedge against weakening USD versus the Yen.
• Entry: 44,950
• Target: 43,250
• Stop Loss: 46,000
• Potential Gains: JPY 85,000 ((44,950-43,250) x 50 yen/contract)
• Potential Losses: JPY 52,500 ((44,950-46,000) x 50 yen/contract)
• Reward-to-Risk: 1.6x
MARKET DATA
CME Real-time Market Data helps identify trading set-ups and express market views better. If you have futures in your trading portfolio, you can check out on CME Group data plans available that suit your trading needs tradingview.com/cme .
DISCLAIMER
This case study is for educational purposes only and does not constitute investment recommendations or advice. Nor are they used to promote any specific products, or services.
Trading or investment ideas cited here are for illustration only, as an integral part of a case study to demonstrate the fundamental concepts in risk management or trading under the market scenarios being discussed. Please read the FULL DISCLAIMER the link to which is provided in our profile description.
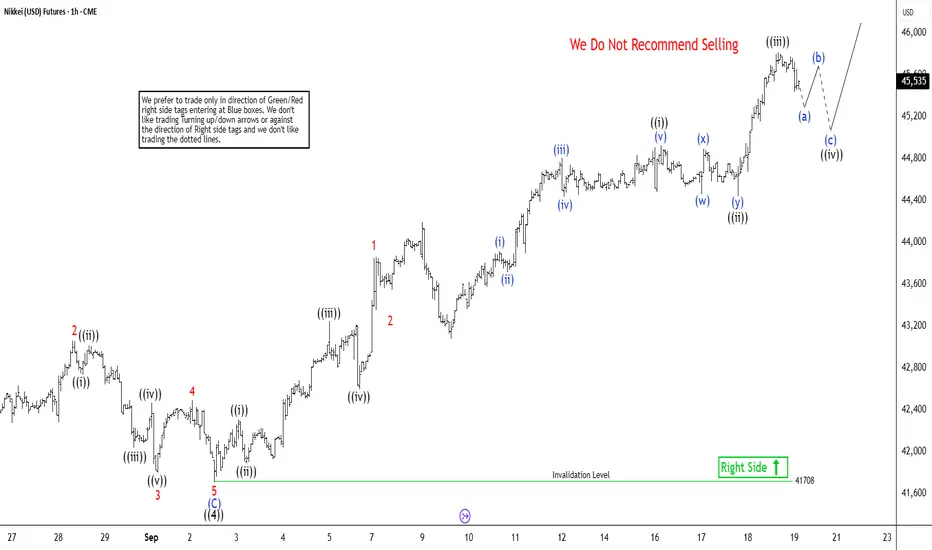
Elliott Wave Update: Nikkei (NKD) Advances in Fifth WaveThe short-term Elliott Wave analysis for Nikkei Futures (NKD) indicates that the pullback to 41,708 on September 2, 2025, marked the completion of wave ((4)). The Index has since resumed its upward trajectory in wave ((5)), structured as a five-wave impulse. From the wave ((4)) low, wave ((i)) concluded at 42,260, followed by a dip in wave ((ii)) to 41,890. The subsequent wave ((iii)) advanced to 43,245, with a pullback in wave ((iv)) ending at 42,595. The final leg, wave ((v)), peaked at 44,190, completing wave 1 in a higher degree. A corrective wave 2 followed, bottoming out at 43,080.
The Index has now embarked on wave 3, exhibiting another impulsive five-wave structure in a lesser degree. From the wave 2 low, wave ((i)) reached 44,925, and a pullback in wave ((ii)) concluded at 44,440. The Index then surged in wave ((iii)) to 45,810. A corrective wave ((iv)) is anticipated to retrace the cycle from the September 18, 2025, low, unfolding in a 3, 7, or 11 swing pattern before resuming higher. As long as the pivot at 41,708 holds, any near-term pullback should find support in a 3, 7, or 11 swing, setting the stage for further upside.
double top++ in potential downtrend formation 1->3 : number 2 are solid major sellers
in this local scope , after number 3
closes below number 1
3->4 : return to solid major sellers
next ?
* hidden bear divergence
* obv downtrend maintained and trendline touch
at number 4
* entry has poc above
*1st standard deviation on major high

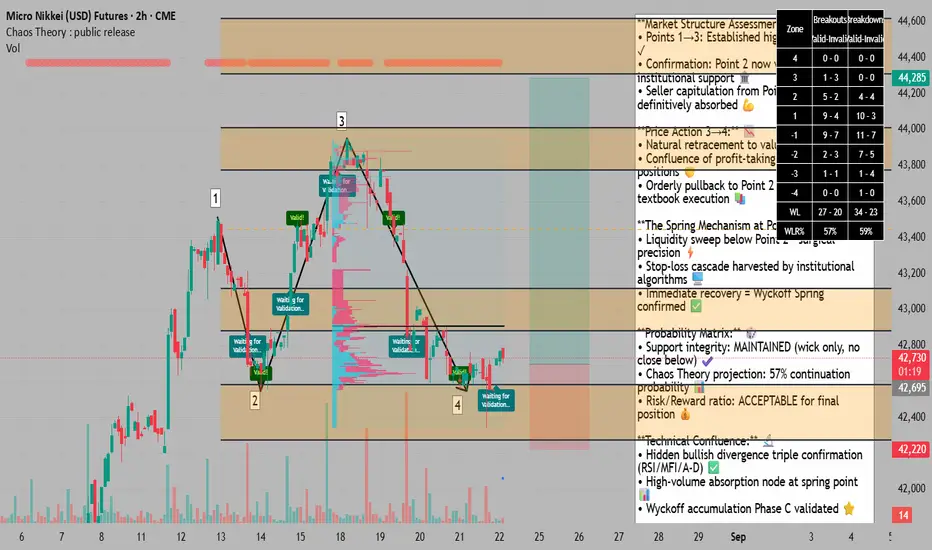
MNK1 Shakeout Complete at 42,650 =BUY the Smart Money Move**Market Structure Assessment:** 📈
• Points 1→3: Established higher high formation ✓
• Confirmation: Point 2 now validated as institutional support 🏛️
• Seller capitulation from Point 1 has been definitively absorbed 💪
**Price Action 3→4:** 📉
• Natural retracement to value area identified ✓
• Confluence of profit-taking and new short positions 🤝
• Orderly pullback to Point 2 support zone - textbook execution 📚
**The Spring Mechanism at Point 4:** 🎯
• Liquidity sweep below Point 2 - surgical precision ⚡
• Stop-loss cascade harvested by institutional algorithms 🖥️
• Immediate recovery = Wyckoff Spring confirmed ✅
**Probability Matrix:** 🎲
• Support integrity: MAINTAINED (wick only, no close below) ✔️
• Chaos Theory projection: 57% continuation probability 📊
• Risk/Reward ratio: ACCEPTABLE for final position 💰
**Technical Confluence:** 🔬
• Hidden bullish divergence triple confirmation (RSI/MFI/A-D) ✅
• High-volume absorption node at spring point 📊
• Wyckoff accumulation Phase C validated ⭐
**Risk Acknowledgment:** ⚠️
• Point of Control resistance overhead - monitored 👁️
• Position sizing: MAXIMUM ALLOWABLE 💯
• Stop-loss: ABSOLUTE at spring low 🛑
This is the trade. This is the moment. Fortune favors the prepared. 🎖️
**EXECUTING LONG POSITION. NO SECOND CHANCES.** 🚀
*Risk management is paramount. Trade responsibly.* 📋
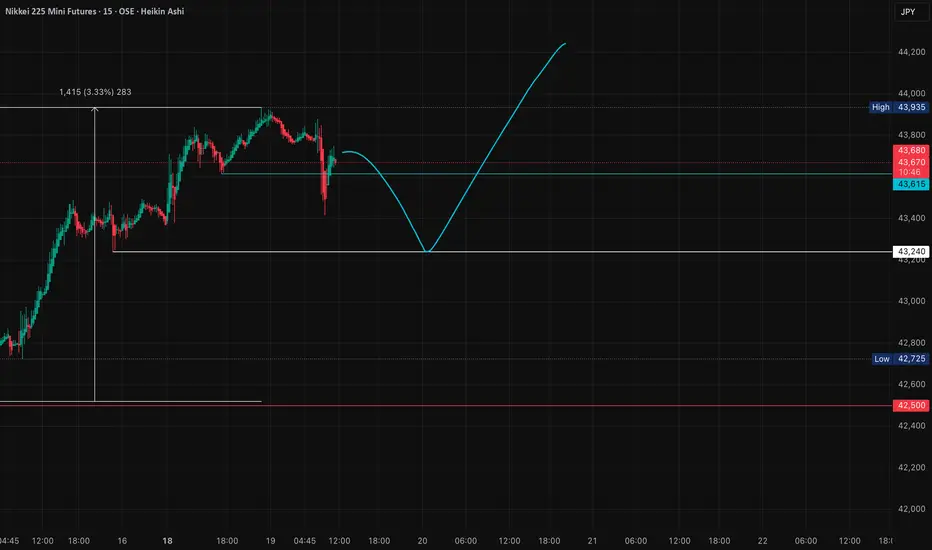
NIKKEI FUTURES: Liquidity Hunt → Rally → Major Correction SetupSharing my current outlook on Nikkei futures with a simple but effective read. 📈
**🎯 My Expectation:**
I'm anticipating a classic liquidity grab below recent lows, followed by another leg higher. After this move, we might see a more significant corrective pullback. 📉
**📍 Target Zone:**
A move up to around 44,500 would provide an ideal setup. This level would create what looks like the second touch of a potential double top pattern - that's where I'm planning to take profits. 🎯
**🧠 Market Structure Logic:**
This type of move is textbook market behavior: sweep the weak hands out with a liquidity grab below support, then drive price higher to collect stops above resistance. Simple, but effective. 🔄
**⚠️ What I'm Watching:**
- Clean break below recent lows (liquidity hunt)
- Quick reversal and momentum shift upward
- Approach to the 44,500 area for potential double top formation
**📊 Risk Consideration:**
If we don't see the expected liquidity grab first, or if price breaks structure in an unexpected way, I'll reassess the setup. The beauty of having a plan is knowing when it's not working. 🛑
---
**Trading is simple.** You don't need multiple indicators or dozens of lines on your chart. A clean and simple chart often works best — it keeps your decisions consistent and reduces uncertainty. Sure, it might not look flashy, and my analysis may seem a bit "plain" compared to others… but that's how I like it. If you find this analysis useful, feel free to follow me for more updates.
---
*Disclaimer: This post is for general informational and educational purposes only. It does not constitute financial advice, investment recommendation, or a service targeting specific investors, and should not be considered illegal or restricted information in any jurisdiction.*
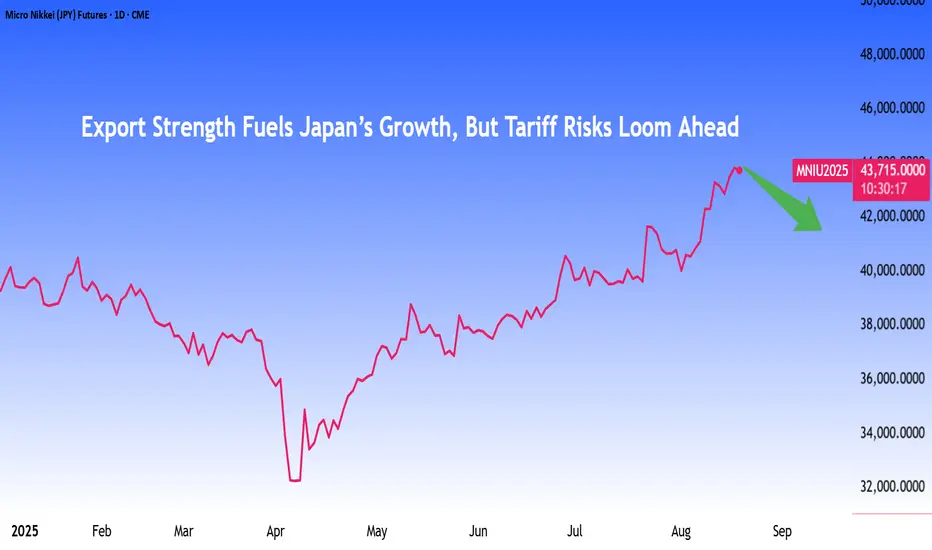
Export Strength Fuels Japan’s Growth,But Tariff Risks Loom AheadJapan’s economy defied expectations in Q2 2025. Exports roared back as a key driver, powered by a new U.S. trade deal and a weaker yen, sending the Nikkei higher. However, with tariffs and a cooling investment outlook on the horizon, the question is whether this upside has staying power.
Nikkei Rallies on Growth Surprise, Though BoJ Warns Boost May Fade
On 15/Aug, preliminary data showed that Japan’s economy expanded by 0.3% in Q2 2025, outpacing forecasts of 0.1% and building on the upwardly revised growth from the previous quarter.
Chart 1: Exports Drive Japan’s Q2 GDP Surprise, Economy Outpaces 0.1% Forecast
Source: Trading Economics (as of 18 Aug 2025)
The upside surprise was driven primarily by stronger exports, which contributed 0.3 percentage points to GDP after dragging growth by 0.8% in Q1.
Japan’s GDP growth beat expectations, offering a welcome surprise after a difficult second quarter marked by trade uncertainty. A breakthrough came on July 23, when Japan finalized a trade agreement with Washington that imposed a uniform 15% tariff on exports, including autos.
While the tariff reprieve on autos is significant, it is not the sole driver of recent momentum. The yen’s weakness has also supported Japanese exporters, as overseas earnings translate into higher profits when converted back into local currency.
Chart 2: Nikkei Soars While Yen Stumbles Against the Dollar since 2024
The key question is whether the Nikkei’s latest rally has the strength to continue, or if near-term headwinds could slow it down.
Exports to the US saw a temporary boost from front-loading ahead of higher U.S. tariffs, followed by a pullback.
Chart 3: Tariff Fears Spark Export Rush Followed by Retreat
Source: Ministry of Finance (as of 18 Aug 2025)
Industrial output is set to dip near term from factory shutdowns and mounting pressure from weaker overseas demand.
Chart 4: Factory Shutdowns and Sluggish Demand Cloud June Output Rise
Source: Trading Economics (as of 18 Aug 2025)
Household spending is set to remain strained, as higher food prices and weaker bonuses from lower corporate profits are likely to weigh on consumption through the second half of the fiscal year.
Chart 5: Rising Food Costs and Weak Bonuses Squeeze Household Spending
Source: Trading Economics (as of 18 Aug 2025)
The BoJ has cautioned that the drag from tariffs is likely to weigh on corporate earnings. That backdrop argues for a more measured outlook. Adding to this, Marcel Theliant of Capital Economics noted that while GDP growth recently surprised on the upside, he sees momentum cooling ahead as investment eases and exports edge lower.
Technical Indicators
Chart 6: MACD Strengthens, But RSI Flashes Overbought Warning
Prices remain firmly supported above short-term MA, with bullish momentum strengthening as shown by MACD. However, the relative strength index signals overbought conditions, suggesting that while the uptrend is intact, the market may be vulnerable to a near-term pullback.
Chart 7: Bollinger Bands Hint at Rally Pause Despite Buyer Momentum
Bollinger Bands suggest the same. While the uptrend is intact and buyers are clearly driving prices higher, the rally may be overextended, leaving the market vulnerable to a near-term pullback or sideways consolidation.
Hypothetical Trade Setup
Chart 8: Hypothetical short position in CME Micro Nikkei 225 (Yen) futures expiring in September
Japan’s safe-haven status looks fragile, raising the risk of a pullback in the Nikkei 225. These factors support taking a short position in CME Micro Nikkei 225 (JPY) futures.
In this scenario, the yen-denominated Micro Nikkei Futures contract may boost USD-denominated returns, given the anticipated strengthening of the yen.
The investor should manage downside risk by placing a stop-loss. Based on Chart 8, one option is to set it just above 45,085, a potential resistance level, which would represent a maximum hypothetical loss of JPY 71,000 ((43,665 – 45,085) × 50 yen/contract). Investors with a lower risk tolerance may choose a closer stop-loss.
Hypothetical Short Position:
Entry: 43,665
Target: 41,540
Stop Loss: 45,085
Potential Gains: JPY 106,250 ((43,665-41,540) x 50 yen/contract)
Potential Losses: JPY 71,000 ((43,665-45,085) x 50 yen/contract)
Reward-to-Risk: 1.5x
MARKET DATA
CME Real-time Market Data helps identify trading set-ups and express market views better. If you have futures in your trading portfolio, you can check out on CME Group data plans available that suit your trading needs tradingview.com/cme .
DISCLAIMER
This case study is for educational purposes only and does not constitute investment recommendations or advice. Nor are they used to promote any specific products, or services.
Trading or investment ideas cited here are for illustration only, as an integral part of a case study to demonstrate the fundamental concepts in risk management or trading under the market scenarios being discussed. Please read the FULL DISCLAIMER the link to which is provided in our profile description.
Nikkei Futures Try for ATHsWith US President Trump finalizing an agreement with Japan by imposing a 15% tariff on US businesses for Japanese products, Japanese stocks are flying due to the new found competitive advantage they have

Bond Market Uncertainty Weighs on NikkeiBy Pranay Yadav, Portfolio Analyst, Mint Finance
Rising bond yields and an unexpected economic slowdown in Japan pose new risks to the Nikkei 225, following its recovery from the tariff-driven decline.
Warning lights are flashing. Downside risk potential is present. Nikkei 225 is trading near its one-year average where it has previously shown a tendency to revert.
What could help an investor hedge the uncertainty in the Nikkei 225?
IMPACT OF RISING JGB YIELDS ON NIKKEI 225
Japan’s bond market witnessed renewed turmoil this spring, with a feeble 20-year auction pushing long-term yields to record highs. The 30-year JGB yield has hit an all-time high.
Chart 1: JGB yields soar, fueled by tightening expectations and inflation pressures.
Source: TradingView as of 23 May 2025
Rising yields pose potential risks for the Nikkei 225. Higher yields pressure the earnings-yield gap, eroding equity risk premium. In layman terms, when bond yields go up, investors will opt for the safety of higher bond returns instead of paying for equity risk premium.
Additionally, higher yields tighten financial conditions, raise borrowing costs and squeeze corporate profits, potentially weighing down on Nikkei 225.
Chart 2: 52-week correlation between JGB yields & Nikkei 225 has turned negative
Source: TradingView as of 30 May 2025
As bond prices tank to decade lows and the yield curve steepens significantly, markets are increasingly vulnerable to disruption from carry trade unwinding.
Chart 3: BoJ policy shift shocked the market last August, driving sharp adverse moves.
Source: TradingView as of 30 May 2025
Historically, volatility in the bond market has often spilled into equities. Past 30Y JGB spikes tended to be succeeded by sharp Nikkei 225 drops. Will history repeat itself?
Chart 4: Historically, JGB volatility spikes have triggered equity volatility.
Source: TradingView as of 30 May 2025
Monetary policy uncertainty & fragile global trade have pushed JGB into turmoil. The GDP contraction in Q1 is an additional factor which will potentially force a shift in BoJ’s policy path. Slowing growth weighs down on the equities through weaker domestic demand.
BoJ’s situation could get complicated due to slowing GDP and rising inflation which may push Japan towards stagflation.
Chart 5: Japan’s economy shrank in Q1 amid disruptive tariff impact.
NIKKEI TRADING AT LONG-TERM MEAN
The Nikkei 225 is trading at its long-term average and over the past year the index has shown strong mean reversion around this level, speaking volume about the need for understanding the market dynamics, economic conditions, and the specific characteristics of the Nikkei 225.
Chart 6: Mean reversion in Nikkei 225 over the past year
Source: TradingView as of 30 May 2025
While past trading levels suggest more upside for a short positioning, a sharp decline may occur if a major risk event unfolds.
Chart 7: Nikkei 225 technical indicators signal contrasting views.
Source: TradingView as of 29 May 2025
A bearish MA crossover is imminent which could suggest near term downside. Although, MACD signals that the recent bearish trend may be fading.
CONCLUSION AND CASE STUDIES
Risk signals are flashing with spiking JGB yields and slipping GDP. As Nikkei 225 trades near its long-term average, risks of mean reversion mount.
Chart 8: Hypothetical short position in CME Micro Nikkei-225 (Yen) futures expiring in September
Source: TradingView as of 6 June 2025
If an investor believes that these risks could materialize and that the Nikkei 225 could decline, they may consider shorting the CME Micro Nikkei 225 (Yen) futures. In this case, the yen-denominated Micro Nikkei Futures contract could further enhance the profit in USD due to the anticipated strengthening of the yen.
The investor should manage downside risk by placing a stop-loss. Based on Chart 8, one option is to set it just above the Jan high of 40,330, a potential resistance level, which would represent a maximum hypothetical loss of JPY 130,000 ((37,730 – 40,330) × 50 yen/contract). Investors with a lower risk tolerance may choose a closer stop-loss.
If the Nikkei 225 pulls back to around 32,250, a support level observed in mid-April, this hypothetical short position could yield JPY 274,000 ((37,730 – 32,250) × 50 yen/contract). However, market movements are unpredictable, and there is no guarantee that the index will reach this level before the futures contract expires.
Hypothetical Short Position:
Entry: 37,730
If Nikkei 225 Falls: 32,250
Stop Loss: 40,330
Potential Gains (JPY): JPY 274,000 ((37,730-32,250) x 50 yen/contract)
Potential Losses (JPY): JPY 130,000 ((37,730-40,330) x 50 yen/contract)
Conversely, investors who remain optimistic that risks highlighted above will not materialize in the near-term, may consider taking a long position in the Nikkei 225 as demonstrated in chart 9.
Chart 9: Hypothetical long position in CME Micro Nikkei-225 (Yen) futures expiring in September
Source: TradingView as of 06 June 2025
The investor could consider placing a stop-loss at the support level of 36,280, which was tested in March, based on Chart 9. This would represent a maximum hypothetical loss of JPY 72,500 ((36,280 – 37,730) × 50 yen/contract).
Assuming Nikkei 225 rises to 40,330, the previous high set in February, the hypothetical long position could yield JPY 130,000 ((40,330 – 37,730) × 50 yen/contract).
Hypothetical Long Position:
Entry: 37,730
If Nikkei 225 Rises: 40,330
Stop Loss: 36,280
Potential Gains (JPY): JPY 130,000 ((40,330-37,730) x 50 yen/contract)
Potential Losses (JPY): JPY 72,500 ((36,280-37,730) x 50 yen/contract)
Directional views on the Nikkei 225 come with inevitable uncertainty. Investors can opt for spread positions to reduce it.
A spread comprising a long position in the Nikkei 225 and a short position in the S&P 500 allows investors to maintain a bullish view on the Nikkei 225 while stay hedged against a potential drawdown through the short S&P 500 position.
We covered the hypothetical spread trade in detail in a previous paper . In brief, this spread trade helps the traders seize opportunities in the relative outperformance of Japan equities due to capital flows to Japan while remain insulated in case of a drawdown.
Foreign funds have been net buyers of Japanese stocks for seven weeks in a row as of May 2025.
Chart 10: Net weekly foreign investment in Japan stocks continues to ramp up
Chart 11: Hypothetical spread between CME Nikkei-225 (USD) and CME E-mini S&P 500 expiring in September
Source: TradingView as of 6 June 2025
Investors can deploy CME Micro E-mini S&P 500 futures alongside CME Micro Nikkei 225 (USD) futures to express this view. Alternatively, the standard E-mini S&P 500 and Nikkei 225 (USD) contracts can also be deployed.
A position consisting of 3 x MNKU2025 ($56,595 = 3 x 0.50 x 37,730) in notional) and 2 x MESU2025 ($60,250 = 2 x 5 x 6,025) in notional) roughly balances notional on both legs, allowing for a purely relative outperformance-based trade.
In this hypothetical trade-setup, the Micro Nikkei 225 (USD) contract is used to maintain P&L on both legs in the same currency, simplifying spread execution.
Looking at Chart 11, the Nikkei 225/S&P 500 ratio previously reached a high of 6.800 last July before retracing. If an investor exits at that level, the potential gain could range from $4,760 to $4,860, as outlined below.
To manage risk, the investor could set a stop-loss at the bottom of the spread range which hit a low of 5.890 in early 2022. This would imply a potential loss between $3,364.5 and $3,810.
www.phillipnova.com.sg
For now, Sayonara!
Micro Nikkei 225 (USD) and Micro E-mini S&P 500 spread tracks the performance of the standard contract spread.

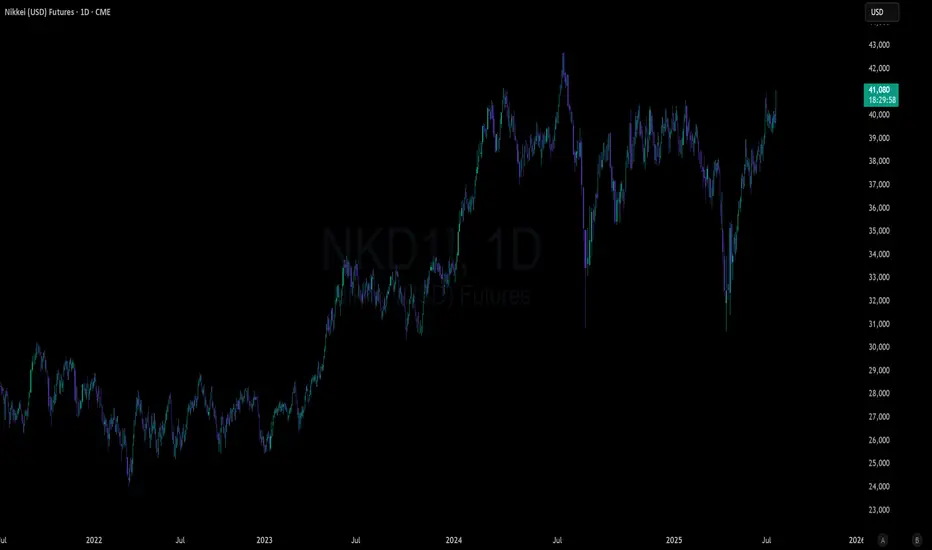
Japanese Yield Surged to Record High 3.2% - Nikkei OutlookAre Japanese markets still a buy after rising 170% since the pandemic, surpassing their roaring 1980s levels?
The reason why Japanese stocks have become some of the best-performing equities in Asia is largely due to the falling yen — a depreciation of around 60%. A weaker yen boosts Japan’s major exporters (like Toyota, Sony, and Panasonic), as their overseas earnings convert into higher yen profits.
But what’s the downside? - Inflation
Yes, they wanted inflation, below 2% yoy will be ideal, but not at this rate of growth at 3.5%.
Another key reason for the stock rally starting in 2020 was that, just like the U.S., the Bank of Japan (BOJ) unleashed massive monetary stimulus, flooding markets with liquidity during the pandemic.
Although the yen has fallen sharply, it seems to have stalled since 2024, that was when the BOJ started raising interest rates from –0.1% to the current +0.5%.
With inflation continuing to rise, the BOJ will likely maintain a hawkish stance on interest rates.
This could cause the yen to strengthen or push USD/JPY lower.
I am also observing a potential head and shoulders formation on the USD/JPY. And if the yen strengthens, this may cause the Japanese stocks to meet its road block.
Nikkei 225 performance since the post WWII to its roaring 80s, to its collapsed, and now rebounded.
Even though prices have breached the 80s level in 2023, it could represent a false breakout, as prices continue to fall back below that historic resistance the last 2 years.
My assessment: The Japanese stocks are still testing their 80s high — a major psychological level.
With money printing, the yen weakened; and a weaker currency fueled inflation.
With inflation, yields and interest rates rise, borrowing costs are increasing across the different tenures — and that’s not good news for stocks.
The 30-year yield is now at around 3% — a level surpassing the deflationary years and that’s something most Japanese would not have imagined just a few years ago.
With a raising interest rate and a stronger yen, let’s see how this will impact the Nikkei 225.
Since the BOJ began raising interest rates at the beginning of 2024, the market has literally stalled within a wide 10,000-point range.
And there is a key support level at 30,000, we can see it was a resistance in the past.
Currently, the BOJ is trying their best in managing the yen and inflation very carefully, to maintain financial system stability. Based on this sentiment, I believe the market will likely continue moving within this wide range — though it may gradually narrow over time.
Make sure to keep monitoring the direction of the Japanese yen, yields, and inflation.
If the yen strengthens too quickly, or if yields and inflation rise too sharply, it could push the market to break below this range and start trending downward.
And if it is all well, market will likely to continue its upward momentum.
Another key factor I am watching closely is tariffs.
The direction of the Japanese stock markets will also be influence by the tariff agreements ultimately with US, and as well as how quickly they can forge potential trading partnerships and alliances — just like other nations, they are racing against time.
Micro Nikkei Futures
Ticker: MNI
Minimum fluctuation:
5.00 index points = ¥250
Disclaimer:
• What presented here is not a recommendation, please consult your licensed broker.
• Our mission is to create lateral thinking skills for every investor and trader, knowing when to take a calculated risk with market uncertainty and a bolder risk when opportunity arises.
CME Real-time Market Data help identify trading set-ups in real-time and express my market views. If you have futures in your trading portfolio, you can check out on CME Group data plans available that suit your trading needs www.tradingview.com
Trading the Micro: www.cmegroup.com
www.cmegroup.com

Japanese Markets: Still a Buy?Are Japanese markets still a buy after rising 170% since the pandemic, surpassing their roaring 1980s levels?
The reason why Japanese stocks have become some of the best-performing equities in Asia is largely due to the falling yen — a depreciation of around 60%. A weaker yen boosts Japan’s major exporters, as their overseas earnings convert into higher yen profits.
But what’s the downside? Inflation. (expand)
Yes, they wanted inflation, below 2% yoy will be ideal, but not at this rate of growth at 3.5%.
Micro Nikkei Futures
Ticker: MNI
Minimum fluctuation:
5.00 index points = ¥250
Disclaimer:
• What presented here is not a recommendation, please consult your licensed broker.
• Our mission is to create lateral thinking skills for every investor and trader, knowing when to take a calculated risk with market uncertainty and a bolder risk when opportunity arises.
CME Real-time Market Data help identify trading set-ups in real-time and express my market views. If you have futures in your trading portfolio, you can check out on CME Group data plans available that suit your trading needs www.tradingview.com
Trading the Micro: www.cmegroup.com
www.cmegroup.com

Nikkei 225 Wave Analysis – 21 May 2025
- Nikkei 225 reversed from the resistance level 38280.00
- Likely to fall to support level 36000.00
Nikkei 225 index recently reversed down from the pivotal resistance level 38280.00 (former top of wave 4 from the start of this year).
The downward reversal from the resistance level 66.00 created the daily Japanese candlesticks reversal pattern, Shooting Star.
Given the strength of the resistance level 38280.00, Nikkei 225 index can be expected to fall to the next support level 36000.00.

Capital Rotation: A Value Play Amidst Tariff HeadwindsNikkei 225 – Capital Rotation: A Value Play Amidst Tariff Headwinds
By Pranay Yadav, Portfolio Analyst, Mint Finance
The US Liberation Day announcement on April 2 sent Nikkei 225 plunging. Subsequent tariff pause led to a strong rebound. Since then, Nikkei has recouped the losses.
Significant risks remain, making renewed weakness possible if tariffs are reinstated after the pause. Major Japanese stocks are heavily reliant on exports to the US. Any disruption significantly hurts their revenues. While examining the tariff impact through the shift in Bank of Japan (BOJ)’s monetary policy, the paper also unpacks recent trend of capital rotation into Japan market.
Chart 1: Nikkei 225 price action on tariff and its pause
Tariffs & Shifting BOJ Outlook
Trade tensions have cast a long shadow over Japan’s economic outlook. At its May 1 meeting, the BOJ held its short-term interest rate at 0.5%, while sharply cutting upcoming growth forecasts.
Market expectations of BoJ rate trajectory have shifted. In a recent Reuters poll, expectation of a rate hike in Q3 2025 declined from nearly two-thirds to just over 50%. Meanwhile, 84% of respondents do not anticipate any rate hikes at BoJ’s June meeting.
Chart 2: The outlook of BoJ rate hikes has been pushed further out, but the terminal rate by the end of 2025 remains unchanged.
The BOJ halved the projected GDP growth for fiscal 2025/26 (to 0.5%) and pushed back the timeline for hitting its 2% inflation target by a full year to 2026.
Governor Kazuo Ueda warned that “recent developments surrounding tariffs will weigh on Japan’s economy by slowing global growth, hurting corporate profits, and prodding households and companies to hold off on spending”.
Policymakers struck a cautious tone, noting “extremely” high uncertainty around the outlook and indicating they will gauge data carefully before adjusting rates.
Downside Risks from Export Weakness
Nikkei has heavy weighting toward major exporters. U.S. tariffs pose a significant risk to their revenues.
Beyond the direct revenue impact, exporters feel the heat of a strong yen. A weaker yen boosts profits when foreign earnings are converted, but as the yen strengthens, the profits tend to shrink due to currency effects.
According to Toyota, one yen change in the USD/JPY currency pair impacts its operating profit by 50 billion yen.
Chart 3: Yen has appreciated 8.8% against the dollar YTD but remains 25% weaker from its 2022 level.
Chart 4: Historically, the Nikkei 225 has shown weaker performance when export volume losses coincided with yen-driven margin compression.
In particular, the tariffs risk impacting the Nikkei 225’s heavy technology exposure.
Chart 5: The Nikkei 225 is dominated (47% weightage) by the tech sector
In an earnings update, Tokyo Electron Management (which has a 5.6% weight) indicated a flat business environment for the year, citing a “lull in both automotive and power semiconductor investment, and investment by emerging Chinese manufacturers.” Strong growth is only expected in 2026.
The retail industry – a major index component (14%) – is dominated by Fast Retailing, which holds the single largest individual weight in the index at 11%.
Fast Retailing the holding company of Uniqlo chains, has already trimmed second-half profit guidance by roughly 2%-3% after accounting for potential duties, despite sourcing most U.S. inventory from lower-tariff Southeast-Asian plants.
Capital Rotation to Japan Through the lens of P/E Convergence
Despite these challenges, global investors are increasingly rotating capital into international equities amid intensifying trade tensions.
EU defence stocks have surged. Chinese equities have risen. Japanese stocks stand to benefit too. Foreign funds were net buyers of Japanese stocks for three weeks in a row in April.
Chart 6: Net weekly foreign investment in Japan stocks has started to ramp up
Japan offers a compelling relative value story. The Nikkei 225 trades at a P/E ratio of 18.3, roughly 34% cheaper than the S&P 500 (27.9 P/E). This valuation gap stands at near multi-decade highs, suggesting room for P/E multiple convergence as Japan’s capital market attracts more inflows.
Chart 7: Nikkei 225’s P/E Ratio is substantially lower than S&P 500, suggesting the potential for P/E convergence
Conclusion
The tariff impact on Japanese equities is multi-faceted. Delay in BoJ rate hikes offers near-term support for the equity market, potential long-term effects on growth & inflation could offset these gains. Moreover, given Japan’s export-dependent economy, tariffs pose a significant revenue risk—particularly for firms with a high index weighting in the Nikkei 225. Many of these companies are already issuing more conservative outlooks for the year ahead.
Chart 8: Technical signals point to a bullish sentiment on Nikkei 225 although resistance is on the horizon
Investors expecting a favourable trade deal may opt for a long position on the Nikkei 225. A hypothetical trade setup is outlined below. In this case, the yen-denominated Micro Nikkei Futures contract could further enhance the profit in USD due to the anticipated strengthening of the yen.
Chart 9: Hypothetical long position on CME Micro Nikkei 225 (Yen) futures expiring in June
Entry: 36,700
If Nikkei 225 rises: 38,500
Stop Loss: 35,200
Potential Gains (JPY): JPY 90,000 ((38,500 – 36,700) x 50 yen/contract)
Potential Losses (JPY): JPY 75,000 ((35,200 – 36,700) x 50 yen/contract)
Reward-to-Risk: 1.2x
Conversely, investors anticipating the continuation of tariffs may consider taking a short position on the Nikkei 225.
Chart 10: Hypothetical short position on CME Micro Nikkei 225 (Yen) futures expiring in June
Entry: 36,700
If Nikkei 225 falls: 34,500
Stop Loss: 38,200
Potential Gains (JPY): JPY 110,000 ((36,700 – 34,500) x 50 yen/contract)
Potential Losses (JPY): JPY 75,000 ((36,700 – 38,200) x 50 yen/contract)
Reward-to-Risk: 1.47x
For investors seeking to avoid directional exposure amid trade uncertainty, a spread trade may be suitable – going long CME Micro Nikkei 225 futures (USD-denominated) and short CME Micro E-mini S&P 500 futures.
Why choose a spread trade? It helps reduce outright risk amid near-term uncertainty. With trade disruptions still unresolved, the outlook remains unclear.
A spread trade taps into the relative outperformance through P/E convergence, limiting downside while capturing divergences in equity performance.
Spread trades help hedge global market shocks—such as the one in early April—while still offering meaningful upside potential.
Chart 11: Nikkei 225/S&P 500 spread protects against a sharp decline during risk events
Largest Decline (Past Year):
Nikkei 225 (Yen) Futures -6.0%
E-Mini S&P 500 Futures -6.1%
Spread -4.5%
Largest Increase (Past Year):
Nikkei 225 (Yen) Futures 7.8%
E-Mini S&P 500 Futures 9.0%
Spread 3.0%
A position consisting of 3 x MNKM2025 ($55,170 in notional) and 2 x MESM2025 ($56,650 in notional) roughly balances notional on both legs, allowing for a purely relative outperformance-based trade.
In this trade setup, the Micro Nikkei 225 (USD) contract is used to keep the P&L on both legs in the same currency for simpler spread execution.
Chart 12: Hypothetical spread position between CME Micro Nikkei 225 (USD) and CME Micro E-mini S&P 500 expiring in June
Scenario 1:
Sell 2 MESM2025 , Buy 3 MNKM2025,
MESM2025: 5,665 -> 5,409
MNKM2025: 36,780 (Unchanged)
Ratio: 6.8
Hypothetical Profit/Loss: USD 2,560 (5665-5409) x 5 x 2
Scenario 2:
Sell 2 MESM2025 , Buy 3 MNKM2025,
MESM2025: 5,665 (Unchanged)
MNKM2025: 36,780 -> 38,522
Ratio: 6.8
Hypothetical Profit/Loss: USD 2,613 (38522-36780) x 0.5 x 3
Scenario 3:
Sell 2 MESM2025 , Buy 3 MNKM2025,
MESM2025: 5,665 -> 5,885
MNKM2025: 36,780 (Unchanged)
Ratio: 6.25
Hypothetical Profit/Loss: USD -2,200 (5665-5885) x 5 x 2
Scenario 4:
Sell 2 MESM2025 , Buy 3 MNKM2025,
MESM2025: 55,665 (Unchanged)
MNKM2025: 36,780 -> 35,406
Ratio: 6.25
Hypothetical Profit/Loss: USD -2,061 (35406-36780) x 0.5 x 3
Trade Nikkei 225 Futures from 10 Cents/Lot*
Trade Nikkei 225 Futures from just 10 cents/lot. Learn more here and access this low-cost opportunity to start trading CME Micro Nikkei 225 with ease.
The author’s views are independent and do not represent that of Phillip Nova. For applicable terms and conditions and a full risk disclaimer, please refer to www.phillipnova.com.sg. This advertisement has not been reviewed by the Monetary Authority of Singapore.

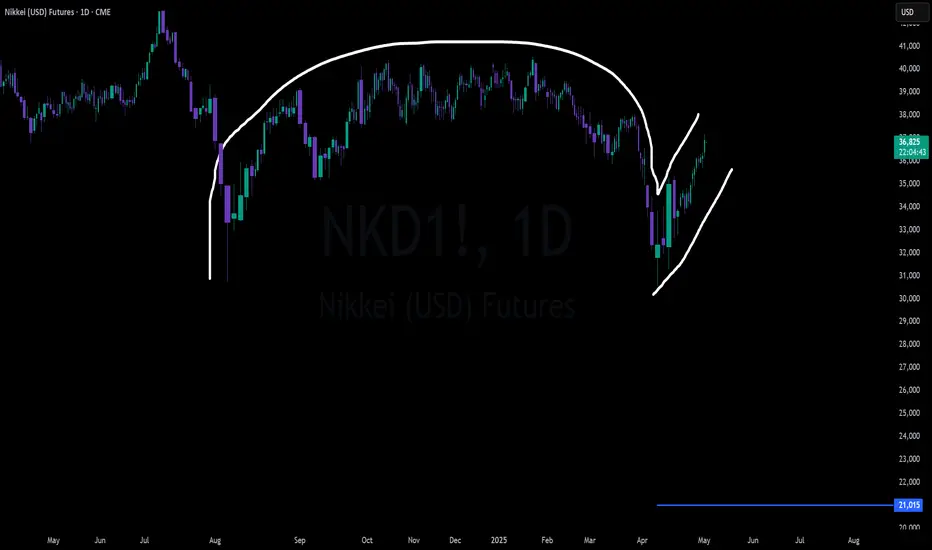
Nikkei Futures (NKD/Nikkei 225) Inverse Cup and HandleNikkei futures have setup an inverse cup and handle on the daily. A somewhat rare pattern as most of them turn into double bottoms or sideways consolidation. Maximum downside target for the pattern is 21,000
- Global macro trends continue to worsen
- BOJ stuck between saving the Yen and helping the dollar
- Japan economic fundamentals may allow BOJ to allow inflation to run hot
- Possible US recession could spread around the world
- Yen carry trade still in play although most likely only blows up in catastrophic situation
- Japan has seen the benefit of US monetary and fiscal policy, Trump admin likely to try to pressure Japan into spending money on US goods such as food and weapons
Overall sentiment on NKD is that it has followed US markets especially the Nasdaq for some time. DXY moving up takes pressure off the Yen carry but could be a sign of now US firms taking profit on a very large run up in the past few weeks. Regardless of outcome, volatility is expected.
Nikkei 225 Bounce Zone Holds AgainTraders should pay close attention to Nikkei 225 futures if the price returns towards 30,400. We’ve now seen decent bounces from around that level five times, including earlier today upon the resumption of trade after the weekend.
While momentum signals are firmly bearish, with RSI (14) and MACD both trending lower, the former now sits at its most oversold level since the pandemic plunge in early 2020. That means the market may be vulnerable to even a minor shift in the prevailing bearish sentiment. For now, the preference remains to sell rallies over buying dips.
A clean break of 30,400 would open the door for a run towards 28,400 or 25,600 — the latter a key technical level given how often it thwarted bearish moves in 2022. On the topside, resistance may be encountered around 33,300, marking where the price rout stalled last Friday. A break of that would put 35,120 on the radar.
Good luck!
DS

The Nikkei (NKD) poised to continue its broader corrective trendThe Nikkei (NKD) has been trending lower since its peak on July 8, 2024. We indicate this decline follows a “double three” Elliott Wave pattern, characterized by a series of distinct movements. After reaching that high, the index fell to 30,720, rebounded to 40,675, and is now progressing downward in a zigzag formation as the internal within “wave y.” The index dropped to 36,275, rose to 38,029 with intermediate fluctuations, and has since resumed its downward trajectory.
This ongoing move lower has already reached 33,525, followed by a recovery to 34,975. We anticipate the index will extend further downward to complete this phase. Afterwards, a temporary rally is expected to provide a correction before the next decline resumes. We anticipate the index will extend further downward to complete this phase. Afterwards, a temporary rally is expected to provide a correction before the next decline resumes.
In the near term, as long as the high of 38,029 remains intact, any upward movements are likely to be limited, setting the stage for additional downside. Investors should monitor these developments closely as the Nikkei continues to navigate this pattern

Bullish Nikkei Faces Formidable HeadwindsJapan’s lost decades are behind us. Many long-term factors are driving resurgence in Japanese equities. Economic growth is accelerating – driven by strong domestic consumption. Radical market reforms have made Japan attractive for domestic and global investors. As a result, the benchmark Nikkei 225 set a new all-time-high after four decades.
However, the rally is facing challenges. Tightening monetary policy, trade uncertainties, and waning impact of corporate efficiency reforms pose near-term headwinds that could push the benchmark into a correction, followed by a period of consolidation.
BOJ’s rates hikes
The Bank of Japan (BoJ) plays a crucial role in the performance of Japanese equities. Since 2016, the BoJ instituted negative rates to support economic growth which boosted equity markets.
Chart 1: From 2015 to 2025, loose monetary policy boosted the Nikkei 225, but equities have stagnated since rates began rising
However, in March 2024, the BoJ hiked rates for the first time after two decades. Subsequently, rates were lifted twice, up to 0.5%, the highest since 2008. Crucially, it intends to raise rates further as part of a broader return to neutral policy rate – one that’s neither too restrictive nor too accommodative.
Chart 2: The Nikkei 225 tends to rise slightly before BoJ meetings but falls sharply afterward, especially following rate hike (2024 to Present)
The BoJ is expected to hike rates by 50 basis points by end of March 2026 according to a Reuters poll . Two-thirds expect the next rate hike in Q3, likely in July this year. Traditionally the wage hikes in spring serve as a critical indicator for the BOJ, influencing its decision to continue raising interest rates as part of its shift towards a more neutral monetary policy. This year, many economists expect the wage hikes to match or exceed 5.1% as seen in 2024. With yen’s slide halting, the BoJ will have more room to manoeuvre. Consequently, a rate hike seems likely forming additional headwinds to Japanese equities.
Fading impact of Corporate Reforms
Nikkei’s ascent is also thanks in part to TSE’s corporate reforms. For years, Japanese equities were seen as “value trap,” dissuading investors.
In 2023, to unlock the value trap, the TSE embarked on a campaign to enhance capital efficiency among listed Japanese firms to attract wider investment. New listing rules “urge” firms to deploy their capital better – either through shareholder returns or CAPEX.
These reforms were effective in the near-term, boosting key valuation metrics such as P/B and P/E ratios. However, the improvements from these reforms are starting to slow.
Chart 3: Japan’s Prime Market weighted average Price-to-Book ratio has fallen back to pre-reform levels over the past year (2023 to Present)
Average P/B and P/E ratios of the prime market firms listed on the TSE is back to pre-reform levels. The large short-term bump from these policies have faded, no longer providing an immediate tailwind.
Chart 4: Japan’s Prime Market weighted average Price-to-Earnings ratio has fallen back to pre-reform levels over the past year (2023 to Present)
Tariff Risks Haunt Markets
Perhaps the largest near-term risk facing the Nikkei 225 is the potential for trade disruptions.
Chart 5: Nikkei 225 daily returns show a sharp drop on the day tariffs were announced
Trump has announced a steep 25% tariff on imported cars, set to take effect on April 2, a dramatic 10-fold increase from the current 2.5%. Additionally, he has raised the steel and aluminium tariffs to 25%, with no exemptions or exceptions—a significant blow to Japan, one of America's key trade and security allies. Despite Japan’s trade minister Yoji Muto lobbying for relief in Washington, the U.S. has yet to offer any concessions.
US remains Japan’s largest export market, accounting for ¥21 trillion ($140. 6 billion) in trade, with automobiles making up nearly 28% of that figure. The impending tariff spike is expected to dent Japanese exports, slash domestic production, and squeeze profit margins.
Trade tariffs, especially those impacting some of the largest companies in the Nikkei 225 present a significant risk for investors.
Additionally, the tariffs are likely to lead to a shrinking trade surplus for Japan which may weaken the yen and further exacerbate inflationary pressures, prompting the BoJ to hike rates.
Nikkei 225 is Weighted Towards Exporters
The Nikkei 225 index is dominated by technology firms which makes up almost half of the index. This sector includes both Electronic Manufacturing firms and Software & Communications companies. Notable firms within this sector are Tokyo Electron (5.9%), Advantest (5.7%), Softbank Group (4.2%), and KDDI (2.5%).
Chart 6: Nikkei 225 sector weightings shows large weightage towards technology firms
Other notable categories are Consumer Goods and Materials. Consumer Goods is dominated by Fast Retailing, the single largest component of the index with a weight of 10.7%. The index is impacted substantially by trade given its heavy tilt towards manufacturing. Rising input costs from imports and reduced demand for exports can both stifle performance
Chart 7: Nikkei 225 Sector wise 1Y performance.
Over the past year, Finance has been one of the strongest sectors in the index. Contrastingly, Producer Manufacturing, which has a high weightage in the index, has been among the underperforming sectors. This trend is likely to continue, with trade disruptions and a slowing AI rally posing headwinds to major index components.
CME Group Nikkei 225 Futures
CME Group’s suite of Nikkei 225 futures provide a range of instruments to express views on Japan’s benchmark equity index. Futures are available in two different contract sizes – Standard and Micro. More information on these can be found at the Nikkei 225 Futures page .
Particularly, the newly launched Micro Nikkei 225 contract presents interesting possibilities for both trading & hedging exposure. Due to the smaller size, the contract requires lower margin, boosting capital efficiency for traders. For risk managers, it allows for precise hedging, reducing unwanted residual exposures.
A crucial use case of these futures is the expanded trading hours in the week. Investors can trade CME Group’s Nikkei futures 23 hours a day, 5 days a week, significantly longer than the underlying cash market. This allows futures to be an effective overnight hedging tool.
Chart 8: CME Micro Nikkei futures cumulative volume growth
The Micro Nikkei futures are available both as a yen-denominated, and USD-denominated product. Both provide for compelling use-cases to hedge FX volatility.
Investors can use the USD-denominated contract to negate any risk from movements in the yen, and trade directly using USD.
Conversely, the yen-denominated contract can be deployed strategically to benefit from a strengthening yen.
Technicals Signal Near-Term Bearishness
Technical summary of Nikkei 225 index shows a bearish outlook on the 1D chart timeframe. This suggests potential downside in the near-term.
Chart 9: Nikkei 225 technical indicator signals short-term bearish outlook
In the longer-term (1-month timeframe) Nikkei 225 technical indicators show a bullish signal.
Chart 10: Nikkei 225 long-term technical indicator signals bullish outlook
Looking at specific technical indicators, the rebound following the tariff related decline seems to be fading with MACD and RSI, signalling a weakening trend. With Nikkei 225 trading below a key support/resistance level, strong momentum may be required to pass this level. At present, that momentum is lacking.
Chart 11: Nikkei 225 RSI, Bollinger Bands, and MACD signal emerging bearish trend
Hypothetical Trade Setup
While Nikkei 225 has multiple long-term drivers that support secular growth, near-term risks are palpable. Tariff uncertainty, BoJ policy, and fading impact of the TSE market reforms support a short-term bearish view on the Nikkei 225.
Investors can express this view by deploying a short position on Micro Nikkei (JPY) denominated futures expiring on June 13 (MNIM25). The following hypothetical trade setup provides a reward to risk ratio of 1.8x. The same view can be expressed using CME Group’s standard Nikkei (JPY) denominated contract which would scale the below P&L by 10x.
Crucially, this position’s P&L is denominated in yen. The yen appreciation due to BoJ policy will further boost the USD value of this P&L, enhancing overall returns.
Chart 12: Shorting Micro Nikkei (JPY) futures expiring in June (hypothetical trade setup)
Entry: 37,650
Target: 36,300
Stop Loss: 38,400
Profit REACHED at Target: JPY 67,500 = ((37,650-36,300) x JPY 50), which is around ~USD 450
Loss at Stop: JPY 37,500= ((37,650-38,400) x JPY 50), which is around ~USD 250
Reward to Risk: 1.8x
Trade Nikkei 225 Futures with Phillip Nova from 10 Cents/Lot*
Start trading Nikkei 225 Futures with Phillip Nova from just 10 cents/lot*. Since its inception in 1983, Phillip Nova (formerly Phillip Futures) has become one of the region's top brokerages, offering access to Futures, Stocks, CFDs, Forex. ETFs and Commodities. With clearing memberships in 21 global exchanges, including CME, HKEX, SGX, and more, Phillip Nova offers you a seamless trading experience.
Trade CME Micro Nikkei 225 with a lower barrier to entry.

classic wykoff distributionDropping as long as SP is dropping.
technicals are calling for 30k and 24k


NIKKEI LongNIKKEI is now net long on the regression break.
I am considering my EA options on this Index.
