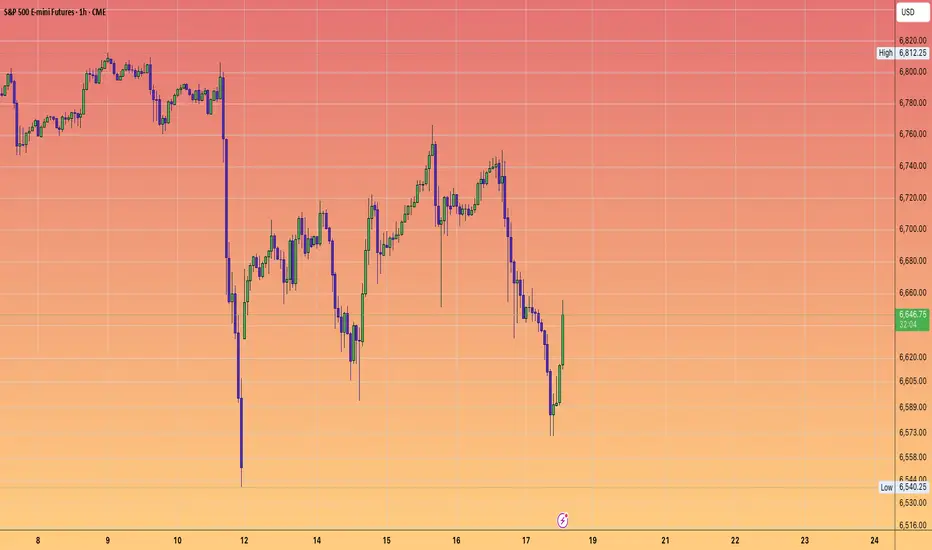
SP500 | High Volume Zone, Watching for Retest and TrapWeeks ago, I marked the blue box as a potential demand zone — you can still see it in my earlier analyses.
Now that price has reached it, the question is simple: will I buy here? Absolutely not.
CDV looks terrible, showing no sign of accumulation. If this zone fails and we get a retest from below, I’ll consider a short position.
It’s also possible that price makes a new ATH just to trap late buyers before reversing — and I’m willing to take that risk.
The last weekly candle was a high-volume bar, and anyone familiar with my methods knows what that means.
When these bars are retested, they often produce high-probability trades. My retest zone sits between 6702 and 6773 dollars.
In short: I expect one more potential push higher before any major correction, but the structure favors waiting for confirmation rather than guessing bottoms.
Trade ideas

S&P 500 E-mini: Approaching Key Resistance Zone with Bullish MomThe S&P 500 E-mini is showing signs of recovery with price approaching a significant resistance zone near 6,800. The 4-hour MACD indicates growing bullish momentum, while the 30-minute chart suggests a potential push toward the resistance area. Traders should watch for a breakout above this level to confirm continuation or a rejection that could signal a pullback.

Smaller range day for MondayThe expectation is a smaller inside the only slightly lower movement in the daily chart of the S&P 500 for Monday's price action

Day 51 — Trading Only S&P Futures | +$177 Testing a New StrategyRecap & Trades
Day 51 — I started late today since I had stuff to take care of in the morning. By noon, I decided to test a new “buy-the-dip” setup.
The idea: if the market drops over 100 points from its highs without panic, I’ll start building long positions with a wide 100-point stop and multiple profit targets.
Today was my first run testing it, and it worked pretty well — small win, but a big step in strategy development.
Lesson & Mindset
The key lesson: once you’ve built consistency, the next step isn’t more aggression — it’s refinement.
Testing new setups helps expand your edge while maintaining control.
News & Levels
Headline: Trump declared “We’re in a trade war with China now” — a reminder that volatility can return anytime.
Tomorrow’s levels: Above 6700 bullish, below 6655 bearish.

ES UpdateLooks like there were some itchy trigger fingers on the sell button. Looked like a classic pump and dump setup with MFI hitting overbought, and a few firms hit the sell button because Trump said something about Chinese cooking oil.
You gotta figure they can't tank futures 2 days in a row, so the market has to gap up a little. Might short something tomorrow.
S&P 500 Testing Key Support: What Traders Need to Know About SupThe S&P 500 delivered a fascinating signal on Friday, one that technical traders should be paying close attention to.
The market's behavior at this critical juncture reveals important clues about the ongoing battle between supply and demand forces, and what we might expect in the coming sessions.
Friday's trading bar displayed two critical characteristics: a high-volume signature combined with a strong demand tail. This combination points to an attempt to bounce at a key support level, suggesting that buyers are stepping in aggressively. The entire price action pattern indicates a significant testing process is underway in the S&P 500.
The demand tail itself was substantial—approximately 75 S&P points.
That's a considerable move that demonstrates demand instantly producing an upward result on what was otherwise a down bar. When we see this kind of opposing force emerge during a decline, it creates the expectation of some kind of reaction higher.
Looking at comparable bar patterns as analogs, we can start to form expectations about what comes next. If we treat these formations as mirror analogs, there's a particular sequence worth noting.
Following the previous pattern, the next bar was a non-follow-through to the upside, which developed into a testing bar.
Now, we're expecting an up bar as a mirror image of that earlier pattern. However, volume behavior will be crucial here.
We know that volume needs to fall during this phase, and we're seeing more volume declining than in the previous comparable case. This volume characteristic suggests we should be expecting some kind of retest first before any sustained move higher.
The current structure is considerably more complex than simple pattern recognition might suggest.
We could see several different scenarios unfold:
First, there's the possibility of testing today's lows. If the market proves stronger than expected, we could simply continue the sequence of up bars without further downside testing. So far, demand is coming into the market and we're attempting to improve the technical picture.
The question remains: could we experience another down day? That possibility certainly exists, but the demand characteristics we've observed suggest buyers are becoming more aggressive at these support levels.
As tomorrow's session unfolds, traders should focus on volume patterns and price behavior relative to Friday's low. The interaction between supply and demand at this support level will determine whether we see a simple retest or a more complex consolidation pattern before the next directional move.
The key takeaway for S&P 500 traders is that we're in an active testing phase where demand has shown its hand with significant force. How supply responds to this demand will shape the market's near-term trajectory and provide valuable clues about the strength of this support level.
Day 49 — Trading Only S&P Futures | +$640 Cooling OffRecap & Trades
Day 49 — after Friday’s crazy volatility, I decided to slow things down. The market was still moving 2–3× its normal range, so I only took setups around large moving averages and key Gamma zones.
Executed clean, locked profits early, and ended the day +$640.
Lesson & Mindset
The main lesson today: discipline isn’t only about cutting losses — it’s about knowing when to press pause.
After a big week of volatility, patience and smaller positions keep you in the game.
News & Levels
Headline: Bessent said the U.S.–China relationship remains strong — which helped keep markets steady today.
Tomorrow’s levels: Above 6735 bullish, below 6665 bearish.

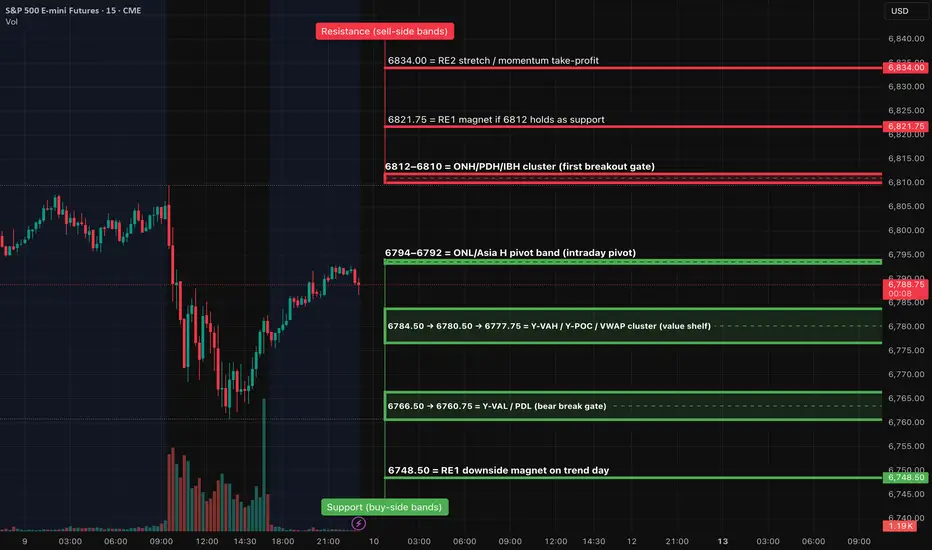
ES (SPX, SPY) Analyses, Key Zones, Setups Fri (Oct 10)Session Roadmap (London → NY)
London (02:00–05:00 ET): Expect balance 6792–6807. A sustained London hold above 6802–6805 increases odds of a pre-NY probe into 6809–6812. A London slip below 6784.5 shifts risk to a VWAP check 6777–6780 and potentially 6766–6761 into NY AM.
NY AM (09:30–11:00): Two-way opening likely unless 6812 converts rapidly; watch 9:45–10:05 for the sentiment print impulse.
NY PM (13:30–16:00): If morning sets a trend, expect continuation toward RE1/RE2; otherwise back-to-value rotations inside 6780–6795.
TIER-1 (A++) — Breakout LONG above PDH/ONH
Trigger: 15m full-body close above 6810–6812, then a 5m hold/re-close with HLs.
Entry: 6810.75–6812.25 on the first clean retest/hold.
Invalidation (hard SL): 6804.75 (below retest & today’s open region).
TPs: TP1 6821.75 (RE1), TP2 6834.00, TP3 6841.25.
TIER-1 (A++) — Breakdown SHORT through Y-VAL/PDL
Trigger: 15m full-body close below 6766.5 and then 6760.75, with a 5m retest 6764–6766 that fails.
Entry: 6764.00–6766.00 on the rejection.
Invalidation (hard SL): 6772.50 (back above value shelf).
TPs: TP1 6748.50, TP2 6736.50, TP3 6729.00.
TIER-2 (A+ Bounce) — Quick-reclaim LONG at Value Shelf
Trigger: Fast flush into 6777–6780 with a 1m reclaim of 6780.5 and 5m re-close above.
Entry: 6778.00–6780.50 after the reclaim.
SL: 6771.25.
TPs: TP1 6792.75 (Asia H pivot), TP2 6805.50 (today’s open/nearby shelf), runner eye 6810–6812 if momentum.
TIER-3 (A Bounce) — Exhaustion-flush LONG at PDL
Trigger: Liquidity sweep 6758–6752 that reclaims 6761 on 1m and 5m holds.
Entry: 6754–6756 on the reclaim.
SL: 6750.75.
TPs: TP1 6777.75 (VWAP), TP2 6789–6792 (pivot band).
===
Price-Path Scenarios (most to least likely)
Balance → Break Probe: Early churn inside 6792–6807; successful lift through 6810–6812 post-10:00 unlocks 6821.75 (RE1).
Fade to Value: Early rejection at 6809–6812 leads to a drift back into 6784/80 → 6777.75; buyers defend value and keep the range intact.
Bear Extension (data-shock needed): Clean 15m close below 6766.5/6760.75 opens 6748.50 with potential follow-through to 6736.50.
NQ & ES Premarket Comment Thursday 16-10-2025Good morning everyone.
Today, we are trading within a Premium Zone, which indicates that any long opportunities should ideally emerge only after a retracement into one of the blue-marked demand areas highlighted on the chart.
The daily bias remains bullish, but given that price is currently positioned near the upper range, we may look for short-term countertrend setups, with the first blue zone serving as a potential short-term downside target.
Possible scenarios:
Scenario A: Price retraces to the first blue zone, where we’ll monitor for bullish confirmation signals to establish long positions.
Scenario B: Price extends deeper into the second blue zone, offering a more favorable long entry.
If neither scenario materializes, we’ll remain on the sidelines — patience and selectivity are key.
It’s important to approach short setups with caution. Trading against the dominant trend requires experience, precise execution, and algorithmic-level accuracy. Even in that case, risk should remain limited, as countertrend positions inherently carry higher exposure.
As the market opens, we’ll closely monitor the initial price action. Once volatility stabilizes and provided that price evolves in line with our outlined scenarios, the market structure will become clearer, giving us a defined framework for execution.
Avoid placing blind Buy Limit orders at the marked support levels. Instead, wait for clear confirmation of support and a shift in momentum before engaging.
The primary upside target for long setups remains yesterday’s high, followed by the all-time highs of the corresponding indices, should bullish momentum extend further.
Each session is an opportunity to sharpen our discipline, patience, and market awareness. Sit calmly in front of your charts, observe price action, learn from its behavior, and let the market guide you. If the anticipated setup does not unfold, treat that as valuable screen time rather than a missed opportunity.
Wishing everyone a focused and disciplined trading day — we’ll revisit and update our outlook in the afternoon commentary.
It doesn’t matter if price initially runs above the previous day’s high (PDH) — we still need price to retrace back into the predefined zones before considering any long entries. Wait for structure, not impulse.
PF

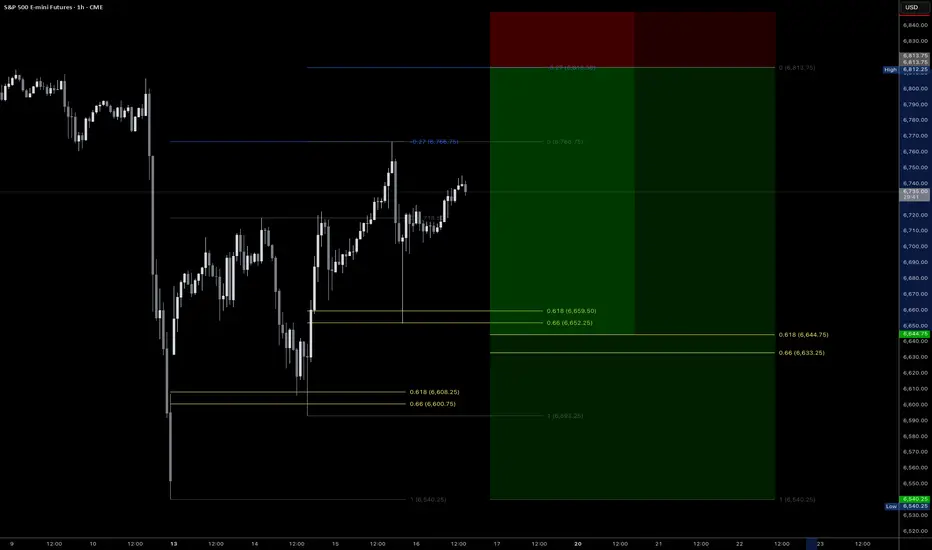
ES UpdateES and NQ are a lot closer to the gap fill.
I leave open the possibility that RSI goes deeper into oversold so that at least ES and NQ can fill the gap then bounce.

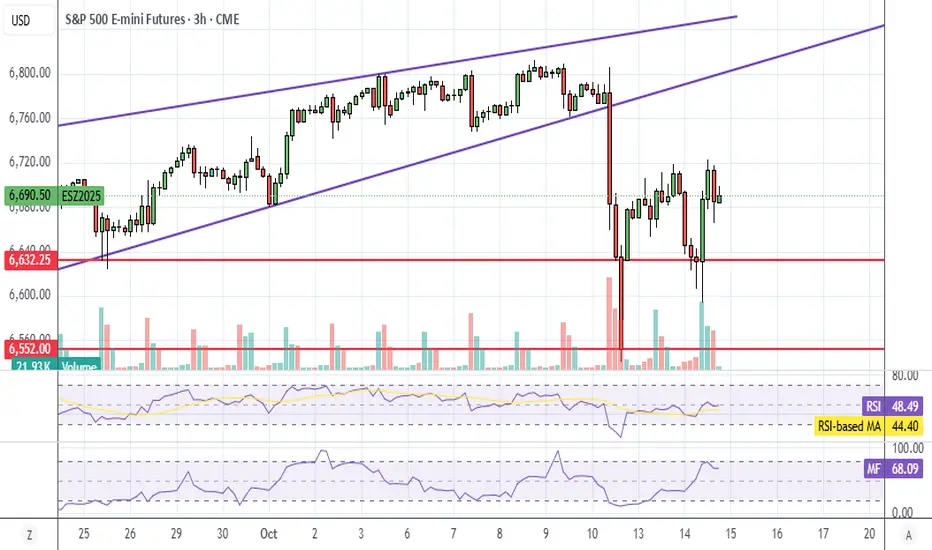
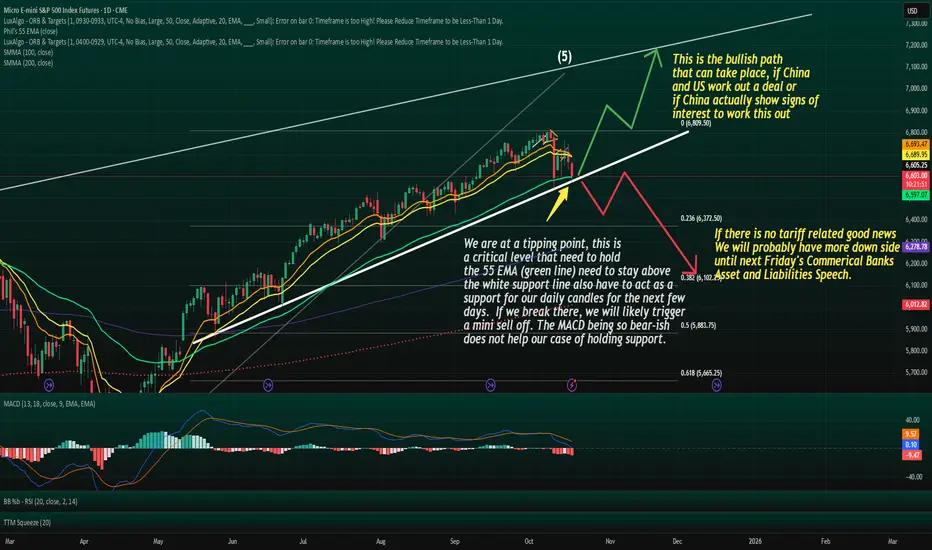
We are at a tipping point that can potentally trigger a bear run
The 55 EMA is widely watched by institutions and swing traders as a medium-term trend gauge.
When price tests this line after a strong run or selloff:
Holding above often leads to trend continuation or strong bounce as seen in the path on my chart.
Losing it convincingly tends to signal a deeper correction or even a trend reversal.
Right now, ES is coiling around the 55EMA, which is the kind of tension point where volatility can explode.
Lower Trend Line = Structural Support
The fact that the EMA test with the lower trend line can adds weight to the downward movement.
When a support trend line and EMA level line up, it becomes a confluence zone meaning breakouts or breakdowns from here are often decisive.
A breakdown of this confluence could open the door to:
A larger corrective Wave A or C leg down.
Possibly a multi-month correction into year end if macro news doesn’t provide support.
Fundamental Catalyst Is Lurking
Tariff or trade-deal headlines can be the kind of fundamental catalyst that aligns perfectly with this technical pressure point.
That alignment is classic in Elliott Wave:
The technicals create the setup.
The news provides the spark.
The breakout or breakdown is fast and aggressive.
⚠️ This is why these zones are dangerous for complacent positioning both bulls and bears can get steamrolled when the move starts.
Two Clear Scenarios
Bullish: candle hold above 55 EMA + trend line then bounce toward upper channel, possibly Wave B or new Wave 3
Bearish: clean daily close below support with 55 EMA dropping below can trigger a multi week(s) correction, potential acceleration downward if no positive news
Bull case → initial target near upper trendline / Fib extension levels.
Bear case → retest of previous swing lows or even 0.618 retrace of the entire rally.
Risk Management Matters Most Here
This is the kind of zone where:
Stops should be clearly defined — not “mental.”
Position size should respect that a big move can be triggered fast.
Targets should be realistic, because reactions off the 55 EMA can be sharp.
“When technicals and fundamentals line up, the market doesn’t tiptoe, it sprints.”
NQ & ES Premarket Comment Wednesday 15-10-2025Good morning everyone.
Today, we’re operating within a Premium Zone. The daily bias remains bullish, but price action needs to retrace to lower levels before resuming its rally toward the all-time highs (ATHs) of the indices. This setup offers potential short-term short opportunities.
Possible scenarios:
Scenario A: Price pulls back to the first blue zone, finds support, and then resumes higher toward the ATHs (weekly target).
Scenario B: Price extends lower into the second blue zone before continuing the rally upward.
In either case, we’ll be looking for short opportunities while price trades in this upper zone. Once price reaches the first blue line, we’ll assess whether strong buying interest appears — that will help determine if this is the swing low before the next leg higher.
Today could present multiple opportunities — first catching the initial pullback, and later positioning for the reversal to the upside.
If price approaches the first blue area, remain cautious with long positions. The market might find temporary support there, push slightly higher, and then break below that zone, targeting the lower blue region.
As the session opens, we’ll closely monitor early price action. Once volatility settles and price holds within these levels, we’ll start looking for short setups with clearly defined risk parameters.
This is shaping up to be a solid day for high-probability setups. Stay patient, disciplined, and aligned with your trading model. Approach the charts calmly — don’t chase every move, as doing so can lead to both financial and psychological damage.
Wishing everyone a profitable and focused trading day.
We’ll review and update the outlook in the afternoon session.
Note: If price continues to rise without a pullback, we will remain on the sidelines and take no action.
PF

Options Blueprint Series [Intermediate]: ES Condor in the Clouds1 — The Market in a Cloud Layer
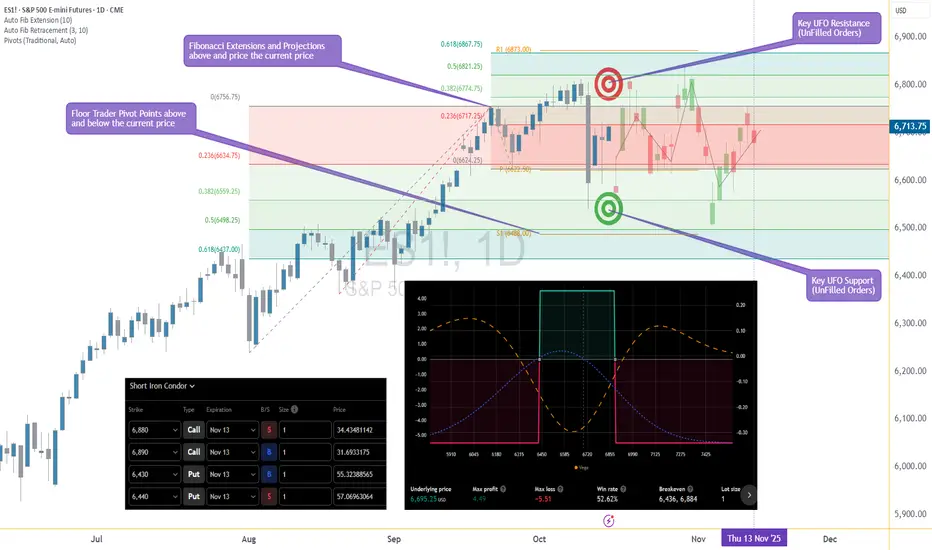
The S&P 500 (E-mini and Micro E-mini) futures have recently been caught in a curious atmospheric pattern — not of weather, but of price action. After a strong sell-off shook the market a few days ago, both Fibonacci extensions and retracement zones now cluster densely above and below the current price. When these are joined by multiple Floor Trader Pivot Points and Unfilled Order (UFO) zones sitting in similar regions, a clear message emerges: this market is potentially trapped in a range.
Resistance has been repeatedly observed near 6,873, while the lower boundary around 6,437 continues to attract buyers. The index seems to be trapped between Fibs — a typical post-volatility consolidation phase.
For traders who understand that sideways markets can be just as valuable as trending ones, this environment presents an opportunity. Instead of chasing direction, the goal becomes to capture time decay while staying within defined risk limits.
2 — The Strategy: Short Iron Condor Fundamentals
A Short Iron Condor combines two credit spreads:
A short call spread above current price
A short put spread below current price
Together, they create a “no-fly zone” for the underlying — a region where the trader earns maximum profit if price remains between the inner strikes.
This position benefits from:
Stable or neutral price movement
Time decay (theta)
Declining implied volatility
The Iron Condor offers defined risk and defined reward, making it a powerful candidate for range-bound markets like the current ES setup. While the maximum gain is limited to the net premium collected, the maximum loss is also capped, making this a risk-defined non-directional strategy.
Because this structure has both call and put spreads, it offers low Vega exposure — meaning it’s not overly sensitive to volatility shocks. For intermediate traders, this makes it a comfortable way to step beyond simple single-leg strategies and into the world of multi-leg, theta-driven structures.
3 — The Setup: Building the ES Condor
For this idea, we’re looking at the ES (E-mini S&P 500 Futures) options expiring on November 13.
The structure is built as follows:
Sell 6880 Call @ 34.43
Buy 6890 Call @ 31.69
Buy 6430 Put @ 55.32
Sell 6440 Put @ 57.07
This results in a net credit, generating the potential for a maximum profit of 4.49 points (per spread), while the maximum risk stands at -5.51 points. The reward-to-risk ratio comes to approximately 0.8:1, with a statistical win rate of 52.6% based on the current volatility surface, and the Breakeven points: 6,436 and 6,884.
As long as the ES price remains between these levels by expiration, the structure will achieve profitability. The Iron Condor works best when volatility remains stable or contracts — a condition currently supported by the post-drop equilibrium visible in implied volatility readings across near-term expirations.
4 — Chart Context: Technical Landscape Supporting the Range
The chart of the E-mini S&P 500 Futures (ES) reveals a tight compression zone forming between Fibonacci extensions and retracement levels above @ 0.618 (≈6,868) and below @ 0.618 (≈6,437). This overlap with Floor Trader Pivots — specifically R1 at 6,873 and S1 at 6,488 — paints a classic range structure. This setup can be the natural habitat for an Iron Condor.
While directional traders may feel frustrated by sideways movement, option sellers can see this as a period of controlled opportunity — where theta decay compensates for the market’s hesitation.
In other words, as long as ES continues to “hover in the clouds,” the Condor quietly collects premium.
5 — CME Product Specifications and Margins
Understanding the underlying contracts is essential when selecting between E-mini S&P 500 Futures (ES) and Micro E-mini S&P 500 Futures (MES) for this options setup.
E-mini S&P 500 (ES) Futures
Tick Size: 0.25 = $12.50 per tick
Trading Hours: Nearly 24 hours (Sunday–Friday, CME Globex)
Margin (approx.): $21,000 per contract
Micro E-mini S&P 500 (MES) Futures
Contract Size: 1/10 of ES
Tick Size: 0.25 = $1.25 per tick
Margin (approx.): $2,100 per contract
(Margins may vary slightly depending on volatility and broker policies.)
For smaller accounts or for traders looking to practice scaling and hedging, the MES provides a highly capital-efficient alternative to ES.
When executing the Short Iron Condor, traders may also consider margin offsets if the structure is risk-defined — a benefit when using portfolio margin accounts. However, margin usage will vary by broker and account type.
6 — Risk Management: Keeping the Condor in the Clouds
Every Iron Condor begins with a disciplined approach to risk.
Here’s how it can be managed:
Position Sizing: Determine exposure based on the maximum loss, not the credit received. For instance, risking 1–2% of account equity per structure keeps risk contained even during volatility spikes.
Exit Before Expiration: Avoid gamma risk in the final days. Closing the trade when 50–60% of the maximum profit is achieved can reduce time risk while locking in gains.
Adjustments: If price nears a breakeven zone (6,436 or 6,884), traders can consider rolling the threatened side further away or closing half of the position to reduce delta exposure.
Volatility Awareness: A volatility spike can temporarily pressure the mark-to-market value.
Because the Iron Condor is short Vega, it benefits from a calm or contracting volatility regime.
When markets are calm, this strategy works beautifully; when storms approach, it’s time to bring the Condor to the ground.
When charting futures, the data provided could be delayed. Traders working with the ticker symbols discussed in this idea may prefer to use CME Group real-time data plan on TradingView: www.tradingview.com - This consideration is particularly important for shorter-term traders, whereas it may be less critical for those focused on longer-term trading strategies.
General Disclaimer:
The trade ideas presented herein are solely for illustrative purposes forming a part of a case study intended to demonstrate key principles in risk management within the context of the specific market scenarios discussed. These ideas are not to be interpreted as investment recommendations or financial advice. They do not endorse or promote any specific trading strategies, financial products, or services. The information provided is based on data believed to be reliable; however, its accuracy or completeness cannot be guaranteed. Trading in financial markets involves risks, including the potential loss of principal. Each individual should conduct their own research and consult with professional financial advisors before making any investment decisions. The author or publisher of this content bears no responsibility for any actions taken based on the information provided or for any resultant financial or other losses.
NQ & ES After Hours Comment Tuesday 14-10-2025As you can see, right after the market opened, price finally swept London’s low and then triggered a strong rally, hitting both of our projected targets for the day — at least on the ES.
The NQ, however, is still struggling to reach yesterday’s high. Hopefully, you managed to capture some profits today. Nothing more needs to be said — the chart speaks for itself.
Back here tomorrow at 08:45 AM NY time (45 minutes ahead of the market open).
PF

ES (SPX, SPY) Analysis, Key Levels, Setups For Fri (Oct 17)MACRO SCHEDULE (ET) — confirmed not impacted by shutdown
• NY AM: No confirmed 8:30 ET U.S. government releases (data blackout continues).
• 16:15 — Fed H.8 (weekly bank data) — after cash close; limited intraday impact.
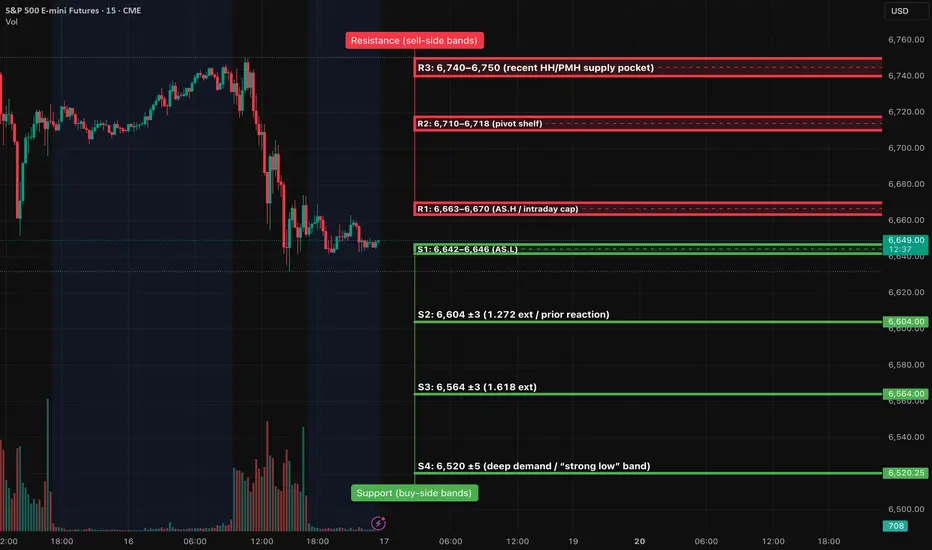
BIAS:
• Short-term momentum is down; price sits in the lower half of this week’s range.
• Expect a liquidity probe lower in London, then a bounce attempt into NY AM if key demand holds.
SETUPS — Level-KZ Protocol (15m→5m→1m)
Tier-1 (A++) — Continuation SHORT from R1/R2
Trigger: 15m rejection back below 6,663–6,670 ➜ 5m re-close below with LH ➜ 1m first pullback fails.
Entry: 6,658–6,662.
SL: Above 15m trigger wick +0.25–0.50.
TP1: 6,604 (≥2.0R gate). TP2: 6,564. TP3: 6,520.
Tier-1 (A++) — Acceptance SHORT below S1
Trigger: 15m full-body close < 6,642 ➜ 5m pullback holds below ➜ 1m LH entry.
Entry: 6,638–6,641.
SL: Above 6,646 +0.25–0.50.
Targets: TP1 6,604; TP2 6,564; TP3 6,520. Management as above.
Tier-2 (A+ Bounce) — Quick-Reclaim LONG at S2
Trigger: Fast sweep below 6,604 with immediate 15m reclaim ➜ 5m hold/re-close above ➜ 1m HL entry.
Entry: 6,605–6,609.
SL: 6,596–6,598 (15m wick low −0.25–0.50).
TP1: 6,663; TP2: 6,690–6,700. Size ¾.
Tier-3 (A Bounce) — Exhaustion LONG at S3
Trigger: Flush into 6,564 ±3 with capitulation wick and 15m momentum pivot ➜ 5m HL ➜ 1m trigger.
SL: Below 6,556–6,558.
TP1: 6,604; TP2: 6,663. Size ½.
INVALIDATION:
• Invalidate long bias if 15m accepts below 6,564 (two 15m bodies or one decisive close ≥1.5pt).
• Invalidate short bias if 15m accepts above 6,718 and holds.
• Max 2 attempts per level per session; stop trading at −2R net or after +3R net.
NEWS / HEADLINE NOTES
With government data paused, price will be more technically driven. Fed headlines can spark brief moves; prioritize level reactions over narrative.
Earnings/gamma flows may add noise near R1 (6,663–6,670) and R2 (6,710–6,718).
NQ & ES After Hours Comment Wednesday 15-10-2025After the market opened, price action moved sharply higher, with the NQ taking out Monday’s high.
Following that move, and after 11:00 AM New York time (post our session, which runs from 9:30–11:00 AM), price started to retrace, pulling back into the second blue zone. Notice the market’s sensitivity and responsiveness around those levels.
There was no high-probability setup for me during that window, so I stayed on the sidelines. Later, however, price developed exactly as outlined in the second scenario from this morning’s commentary.
I hope you found the analysis insightful.
See you all tomorrow—45 minutes before the market open.
Stay well, everyone.
PF

Condor in the Clouds: When the S&P 500 Takes a Nap1 – The Setup Nobody Expected
The S&P 500 just pulled a classic “I’m tired” move. After that big drop, it stopped running and started hovering between 6,437 and 6,873 — a cozy sideways zone filled with Fibonacci levels, Floor Trader Pivots, and UFOs (yep, UnFilled Orders, not flying saucers).
Markets do that sometimes — they sprint, then nap. And when they nap, option sellers quietly collect theta while everyone else wonders when the action will come back.
2 – The Play: Short Iron Condor
When the market’s stuck in the middle, the Short Iron Condor is like putting walls on both sides of the price. Here’s the idea — you get paid if ES stays in between.
How it’s built:
Sell a Call above resistance
Buy a Call a little higher (that’s your safety net)
Sell a Put below support
Buy a Put a little lower (another safety net)
Boom — now you’ve boxed the market. If it behaves, you earn. If it doesn’t, your risk is capped.
3 – Why It Works Right Now
The Condor thrives when volatility chills out. That’s exactly what ES is doing — taking a breath after chaos.
Theta decay: your invisible ally, eating away at option value day by day.
Range stability: resistance ≈ 6,873, support ≈ 6,437.
Low Vega: volatility tantrums matter less.
You don’t need fireworks — you need patience. This trade doesn’t scream, it hums.
4 – The Fine Print (a.k.a. Risk Management)
Keep it real:
Size positions by max risk, not by excitement level.
Don’t wait for expiration — grab 50–60% profit and fly away.
When the market is calm, the Condor glides. When storms build, fold your wings.
5 – For the Data Nerds
If you love precision:
ES tick = $12.50
MES tick = $1.25
Margins ≈ $21k and $2.1k respectively (subject to volatility).
And yes — theta doesn’t care which one you trade; it just wants time to pass.
6 – The Takeaway
Markets don’t always trend. Sometimes they just drift — and that’s okay.
In those moments, the Short Iron Condor turns boredom into strategy.
So, if the S&P 500 keeps “floating in the clouds,” don’t chase it — collect from it.
Want More Depth?
If you’d like to go deeper into the building blocks of trading, check out our From Mystery to Mastery trilogy, three cornerstone articles that complement this one:
🔗 From Mystery to Mastery: Trading Essentials
🔗 From Mystery to Mastery: Futures Explained
🔗 From Mystery to Mastery: Options Explained
When charting futures, the data provided could be delayed. Traders working with the ticker symbols discussed in this idea may prefer to use CME Group real-time data plan on TradingView: www.tradingview.com - This consideration is particularly important for shorter-term traders, whereas it may be less critical for those focused on longer-term trading strategies.
General Disclaimer:
The trade ideas presented herein are solely for illustrative purposes forming a part of a case study intended to demonstrate key principles in risk management within the context of the specific market scenarios discussed. These ideas are not to be interpreted as investment recommendations or financial advice. They do not endorse or promote any specific trading strategies, financial products, or services. The information provided is based on data believed to be reliable; however, its accuracy or completeness cannot be guaranteed. Trading in financial markets involves risks, including the potential loss of principal. Each individual should conduct their own research and consult with professional financial advisors before making any investment decisions. The author or publisher of this content bears no responsibility for any actions taken based on the information provided or for any resultant financial or other losses.

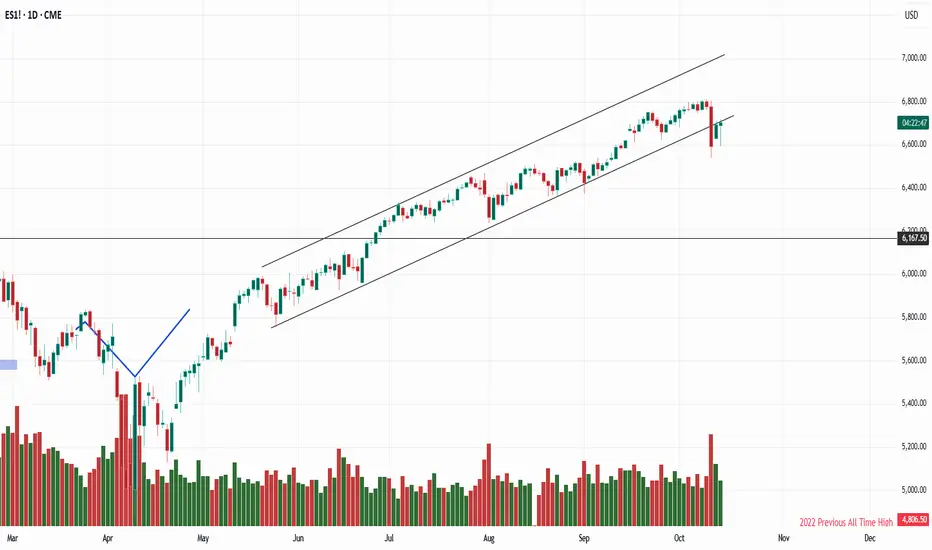
Watch out for 3 drives patternWith the last two retracements to the 0.618 and a perfect touch of the 0.272, we currently have an ideal setup for a potential three drives pattern.
If it hits the final 0.272, it will coincide with CME_MINI:ES1! reaching new all-time highs before reversing for a possible 150-point drop.
Let's see how it evolves.
TRUMP TWEET: High Tariffs on china will NOT remain.I expect a deal with Xi to be announced at the APEC meeting
#ES
#STOCKS
#SPX
ES - 10/6 & Week 41The highest timeframe is a weekly box in grey
A daily red box is last friday's high , low and median range
4hr timeframe levels and trends are in orange
1hr timeframe is yellow and 15min timeframe levels are blue.
Strength should favor the higher timeframe.
BS and FS levels are support
Inv. BS and Inv. FS levels are resistance.
It all paints a fractal story through time if you put it all together. This is the science of Technical Analysis - 4 candles create 6 levels that evolve through timeframes which can be navigated with if/ then statements making the the system methodical and data driven.

Uncertainty in the marketThe daily chart in the S&P 500 implies a market that wants to go higher but it lacks conviction on the close for Monday and the Asia session that is just starting for Tuesday so looking for a market that continues lower the next objective for this market is 6771.

ES (SPX, SPY) Weekly Game Plan (Oct 6–10)Big Picture
Price is leaning into the 6,788–6,800 ceiling after a steady grind higher. Underneath, you’ve got stacked shelves: 6,778, 6,771/6,760, and 6,754. Lose that 6,754 floor and there’s an air pocket toward the 6,720s → 6,680s demand band. Expect rotations until the market either gets above 6,800 and sticks (trend-up week) or gets swatted back (rotate lower into value).
Weekly Bias & Likely Paths
Base case: Rotational around 6,788–6,800 until proven otherwise.
Bull path: Get above 6,800 and stick → pit stops 6,818–6,825 (TP1) → 6,856–6,862 (TP2) → stretch 6,895–6,905.
Bear path: Pop-and-fail at 6,800 → drift to 6,778 → 6,771/6,760 → 6,754.
Trend-down only if we close below 6,754 and fail the check-back, opening the 6,720s → 6,680s window.
Tomorrow’s Playbook — Level-KZ Protocol (15/5/1)
(NY AM window 09:30–11:00 ET; PM window 13:30–16:00 ET. Two tries per level max.)
Pop-and-Go LONG over 6,800 (Tier-1, full size)
Trigger: 15m close above 6,800 → 5m holds 6,788–6,792 and re-closes up → 1m higher high to enter.
Entry: 6,799–6,804 on the re-break.
Stop: Below the 15m trigger wick −0.5.
• Targets: TP1 6,818–6,825, TP2 6,856–6,862, TP3 6,895–6,905.
Management: No partials before TP1. At TP1 take ~70%, set runner to BE, no trail until TP2. Time-stop 45–60m if flat.
Pop-and-Fail SHORT at 6,788–6,800 (Tier-1, full size)
Trigger: Wick above 6,800 that can’t stick → 15m close back under 6,788, 5m confirms down → 1m lower high to enter.
Entry: 6,786–6,792.
Stop: Above the rejection wick +0.5.
• Targets: TP1 6,778, TP2 6,771.5–6,760.5, TP3 6,754 → 6,742.
Note: If TP1 prints in <10m, take ~50%, consider re-adding on a 5m LH.
Quick-Reclaim Bounce LONG at 6,758–6,754 (Tier-2, ¾ size)
Trigger: Flush into 6,758–6,754 that snaps back → 15m close back over 6,760, 5m holds → 1m HL entry.
Entry: 6,758–6,762.
Stop: 6,749–6,752 (below the sweep low −0.5).
• Targets: TP1 6,778, TP2 6,788, TP3 6,800.
Continuation SHORT under 6,754 (Tier-1, full size)
Trigger: 15m body under 6,754 plus a failed check-back into 6,754 on 5m.
Entry: 6,751–6,754 on the failed retest.
Stop: 6,762.
• Targets: TP1 6,736–6,728, TP2 6,720–6,700, TP3 6,685–6,680.
Price Action Road Map for NY Trading Session
Opening Analysis:
- We'll begin by monitoring if the price can hold above the 6,788 level. If it does, look for a push toward 6,800. If the price gets rejected at this level, we will shift our strategy to Scenario B.
Bearish Scenario:
- If the price slips below 6,760, anticipate a potential stop run targeting the 6,758 to 6,754 range.
Response Strategies
- If we observe a quick snap back from this region, be prepared to target the VWAP area, along with revisiting the 6,788 and 6,800 levels.
- Should we fail to reclaim these higher levels, prepare for a move down towards the 6,720s and potentially the 6,680s.
Afternoon Strategy:
- In the afternoon session, if we establish a clear comfort zone during the morning, consider fading the extremes until we see a definitive 15-minute body break from this zone.
Stay focused on these levels and remain adaptable to the market's behavior throughout the session. Good luck!

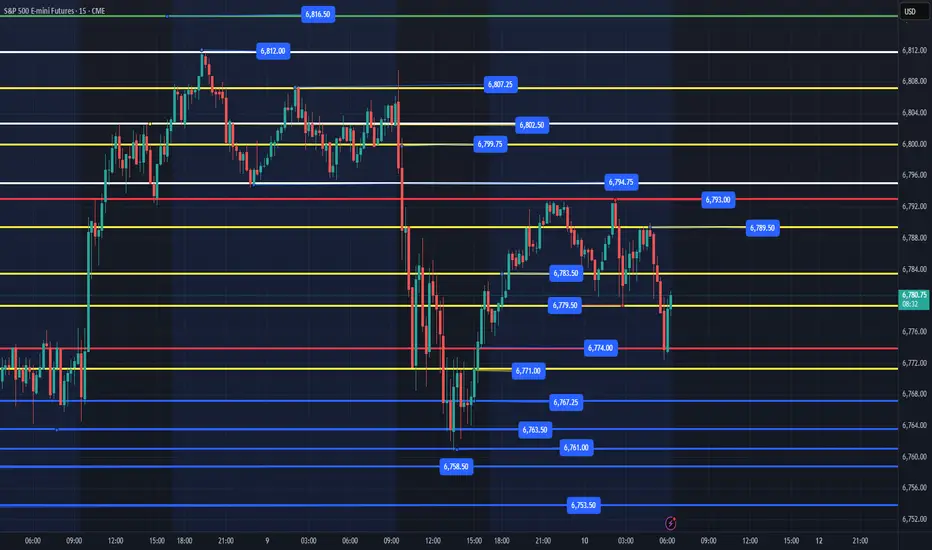
ES - October 10th - Daily Trade PlanOctober 10th- 6:20am EST
*Before reading this trade plan, IF, you did not read yesterdays, or the Weekly Trade Plan take the time to read it first! (You can see both posts in the related publication section) *
If my posts provide quality information that has helped you with your trading journey. Feel free to boost it for others to find and learn, also!
My daily trade plan and real-time notes that I post are intended for myself to easily be able to go back and review my plan and how I did from an execution perspective.
-----------------------------------------------------------------------------------------------------------------
Yesterday, we had our first sell off that was lower than most of the local levels we have been seeing the dips bought at. It took price a couple of hours of basing in the afternoon before the 3pm rally. When price sells off like yesterday, it is important to remember that you do not have to rush in at every level. It is also important to make sure you take profits at the next level up. Depending on your strategy, Ideally, you will have a minimum of 2 contracts that you buy, with 1 being sold at the first level and the other being a runner. This way you can catch the move up, while still being profitable.
-----------------------------------------------------------------------------------------------------------------
The overnight high is 6793 and we just made a new overnight low at 6773. Price needs to reclaim 6790-92 to continue higher. IF, price loses 6773, we will need to come back down and retest yesterday's low at 6761. I have mentioned in the weekly trading plan and in my note yesterday at 4pm -
"Price found a nice low at 6760 and built a base this afternoon and broke out to back test the overhead resistance at 6783. Any flush and reclaim of 6763 this evening is a good immediate spot. Price will most likely hold 6766-70 level and continue higher. 6750-56 is a key level for price to hold tomorrow. IF, we close below that level tomorrow, we may need to go all the way back down to 6729, 6705 to continue higher. IF, price loses 6756 overnight, I would wait until 6729 area as first good spot, IF, that area cannot clear 6756-58 on any back test, it may need to see 6705."
We should get some opportunities today at some quality points.
Highest Quality setups are the following:
1. Flush and reclaim of 6773
2. Flush and reclaim of 6761-63 area, with 6767 being the safer spot to enter with price clearing 6774 being bullish.
3. Flush and reclaim of 6753
4. Flush and reclaim of 6741
IF, price gets below 6741, we will need to look at 6729, 6705.
Key Support Levels - 6773, 6767, 6761, 6753, 6747, 6741, 6729, 6705
Key Resistance Levels - 6783, 6789, 6793-95, 6802, 6807, 6812
As of writing, we are in a clear downtrend with price on the 15 min chart. Any base that is built above 6773 and the reclaim of 6789 would be bullish in the current range.
I still think we need to find liquidity lower by flushing the 6761 level with a reclaim of 6763-65 being a great spot to try for some points.
I will post an update around 10am EST.
----------------------------------------------------------------------------------------------------------------
Couple of things about how I color code my levels.
1. Purple shows the weekly Low
2. Red shows the current overnight session High/Low (time of post)
3. Blue shows the previous day's session Low (also other previous day's lows)
4. Yellow Levels are levels that show support and resistance levels of interest.
5. White shows the trendline from the August lows