Day 64 — Trading Only S&P Futures | 6/7 Signal AccuracyRecap & Trades
Day 64 — a clean, structured trading day.
Started small with team trades from Bia’s setups, and when we hit the bottom of the day, I saw the double bottom support and multiple buy signals align.
That was the cue. I went long, set a 20-point trailing stop, and let the algo handle the r
About S&P 500 E-mini Futures
S&P 500 — short for Standard and Poor's 500, is a United States stock market index based on the market capitalizations of the top 500 companies that have common stock listed on the New York Stock Exchange or NASDAQ. With its headquarters in New York City and dating back to 1860, Standard and Poor's has offices in 23 countries and maintains the SP 500 index. Over $1.25 trillion USD is indexed to Standard and Poor's portfolio of indices, which includes the S&P 500. The S&P 500 index seeks to reflect the status of the whole stock market by tracking the return and volatility of the 500 most commonly held large cap company stocks on the NYSE, capturing approximately 80% of total market capitalization. The 500 companies comprising the SP500 span all major industries and are selected based on their market capitalization, liquidity, ability to be traded, as well as other factors. Additionally, the importance of the SP500 is highlighted by its use as an economic indicator of the health of the United States economy.
Related futures

Trading Rejection Strategy- A Visual Backtest💡 Overview
Here is everything you need to know about the strategy. But before you study it any further, all the visuals are at the end of this post- so don't miss that part.
This setup is built upon simple beliefs:
▶Price always remembers its key levels- Previous Day’s High (PDH), Previous Day’s
I Made $911 Trading S&P Futures | Day 65 Market BreakdownI made $911 today trading S&P Futures.
It didn’t come easy — I barely slept last night, and my overnight orders failed around 3 AM.
So I reset, stepped back, and waited for the one setup I’ve been tracking all week — the 6666 support bounce.
Here’s how it played out, and what the VX Algo system show

ES UpdateRTY filled the gap, ES left open a small 1 pt gap, and NQ did not fill the gap at all. Really strange.
Anyways, 3 hr indicators moving up and Europe rallying. I'm not bullish though, might just take the week off.

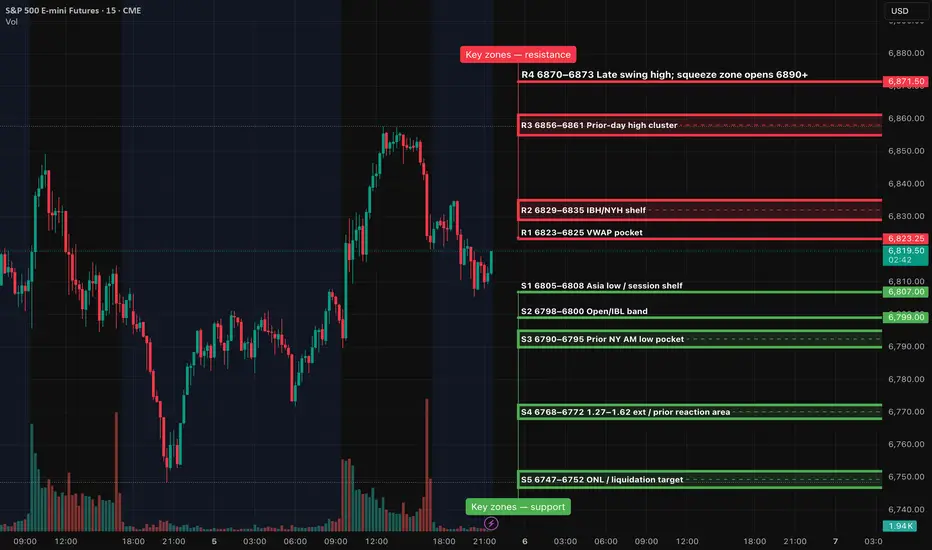
ES (SPX, SPY) Analysis, Key Zones, Setups for Thu (Nov 6)The daily trend has softened following the formation of a lower high. Analysis of the 4-hour chart indicates a bounce that encountered resistance near the 6860–6870 range, subsequently retreating to the 6810 support level. As we look ahead to tomorrow's trading, consider the 6805–6808 range as the k
ES (SPX, SPY) Key Levels, Analysis and Setups for Fri (Oct 7th)EVENTS (ET, unaffected by shutdown): 3:00am NY Fed Williams speech; 7:00am Fed Vice Chair Jefferson speech; 10:00am Univ. of Michigan Consumer Sentiment (prelim); 2:00pm Fed G.19 Consumer Credit. Employment Situation report is postponed due to the shutdown (treat as no 8:30am print).
SETUPS (Leve
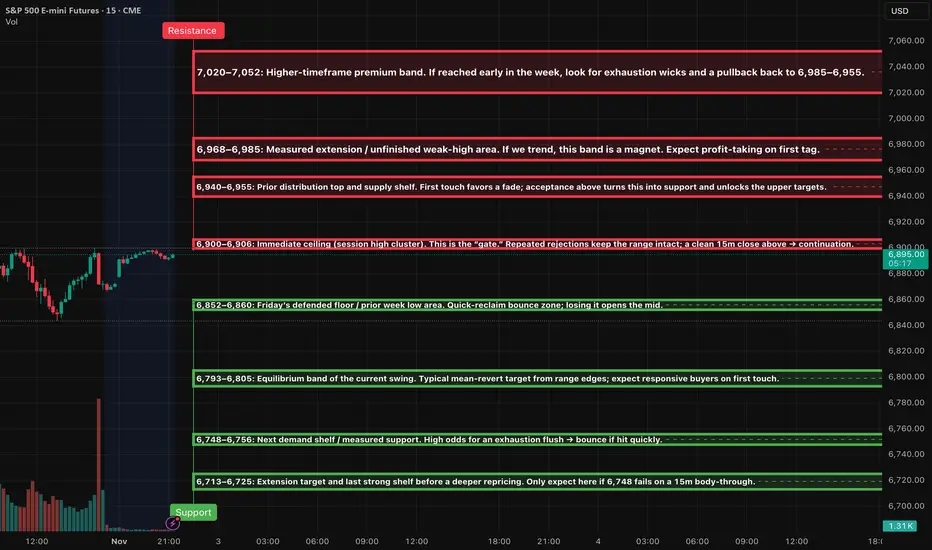
ES (SPX, SPY) Week Ahead Analysis, Nov 3rd - Nov 7thMarket Context
The price is currently positioned just below a key near-term resistance level at 6,900–6,906, following a sharp reversal on Friday from around 6,845. The daily and 4-hour structures indicate an incomplete "weak-high" area above, but the 1-hour momentum has just shifted upward from ov
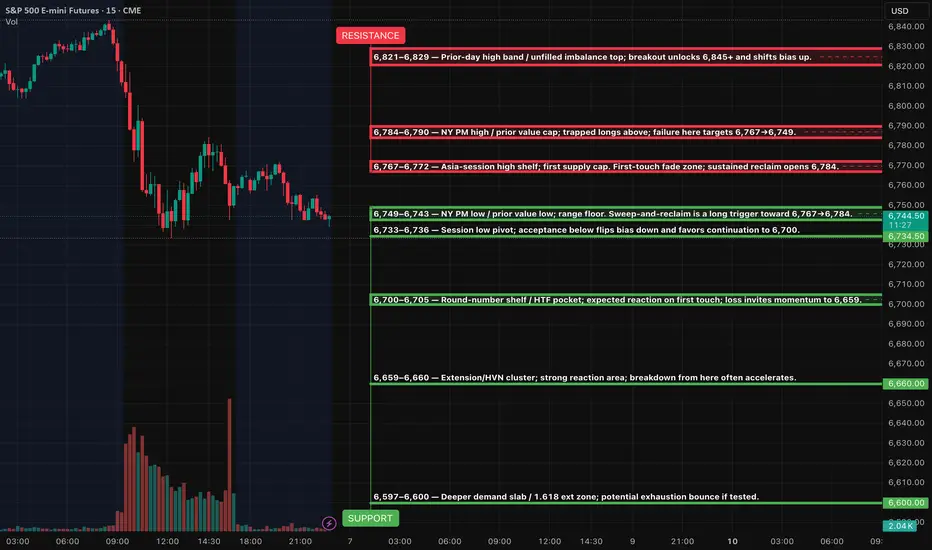
ES (SPX, SPY) Analysis, Levels, Setups for Wed (Nov 5th)News & timing (ET): ADP 8:15; ISM Services PMI 10:00; EIA Crude 10:30. Release status: all three are scheduled to run (not shutdown-affected).
Bias & context: Short-term trend remains lower after a sequence of 15m lower-highs/lows and failure to hold 6,793–6,805. Expect dip-buys to be sold unle

Week 11.03 - 11.07 Prep Last Week :
Last week we opened on a gap above Value and made a push over Edge top where we found our top and larger sellers for the week. Return to above VAL provided selling back into and eventually under the Edge. Holding under the Edge got us under MAs and changed the trend from uptrend to down

ES - November 6th - Daily Trade PlanNovember 6th- Daily Trade Plan - 6:25am
*Before reading this trade plan, IF, you did not read yesterdays, or the Weekly Trade Plan take the time to read it first! (You can see both posts in the related publication section) *
If my posts provide quality information that has helped you with your tra

See all ideas
Summarizing what the indicators are suggesting.
Neutral
SellBuy
Strong sellStrong buy
Strong sellSellNeutralBuyStrong buy
Neutral
SellBuy
Strong sellStrong buy
Strong sellSellNeutralBuyStrong buy
Neutral
SellBuy
Strong sellStrong buy
Strong sellSellNeutralBuyStrong buy
A representation of what an asset is worth today and what the market thinks it will be worth in the future.
Displays a symbol's price movements over previous years to identify recurring trends.
Frequently Asked Questions
The current price of S&P 500 E-mini Futures is 6,753.75 USD — it has risen 0.09% in the past 24 hours. Watch S&P 500 E-mini Futures price in more detail on the chart.
The volume of S&P 500 E-mini Futures is 2.04 M. Track more important stats on the S&P 500 E-mini Futures chart.
Open interest is the number of contracts held by traders in active positions — they're not closed or expired. For S&P 500 E-mini Futures this number is 1.94 M. You can use it to track a prevailing market trend and adjust your own strategy: declining open interest for S&P 500 E-mini Futures shows that traders are closing their positions, which means a weakening trend.
Buying or selling futures contracts depends on many factors: season, underlying commodity, your own trading strategy. So mostly it's up to you, but if you look for some certain calculations to take into account, you can study technical analysis for S&P 500 E-mini Futures. Today its technical rating is sell, but remember that market conditions change all the time, so it's always crucial to do your own research. See more of S&P 500 E-mini Futures technicals for a more comprehensive analysis.