ES - December 4th - Daily Trade PlanDecember 4th- Daily Trade Plan - 8:30am
*Before reading this trade plan, if you did not read yesterday's take the time to read it first! (You can view the posts in the related publication section) *
If my posts provide quality information that has helped you with your trading journey. Feel free to
About S&P 500 E-mini Futures
S&P 500 — short for Standard and Poor's 500, is a United States stock market index based on the market capitalizations of the top 500 companies that have common stock listed on the New York Stock Exchange or NASDAQ. With its headquarters in New York City and dating back to 1860, Standard and Poor's has offices in 23 countries and maintains the SP 500 index. Over $1.25 trillion USD is indexed to Standard and Poor's portfolio of indices, which includes the S&P 500. The S&P 500 index seeks to reflect the status of the whole stock market by tracking the return and volatility of the 500 most commonly held large cap company stocks on the NYSE, capturing approximately 80% of total market capitalization. The 500 companies comprising the SP500 span all major industries and are selected based on their market capitalization, liquidity, ability to be traded, as well as other factors. Additionally, the importance of the SP500 is highlighted by its use as an economic indicator of the health of the United States economy.
Related futures
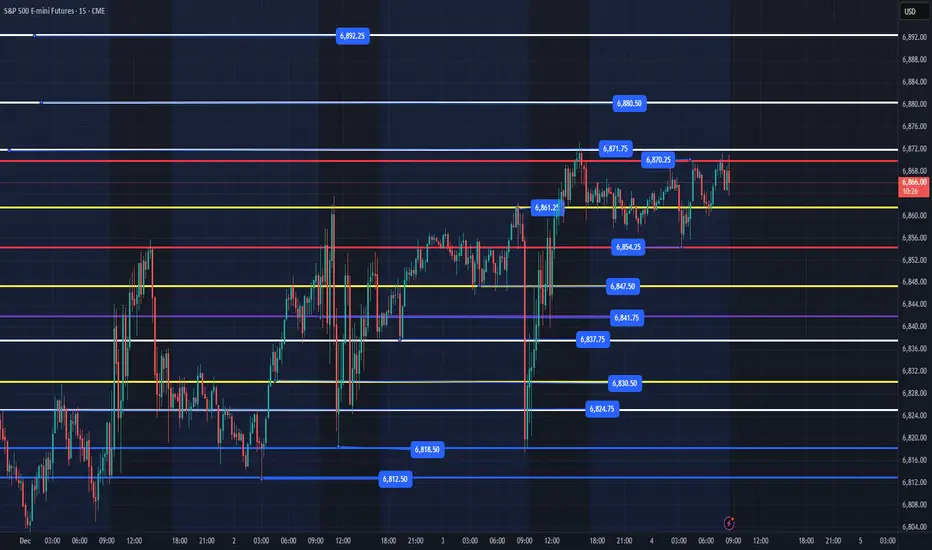
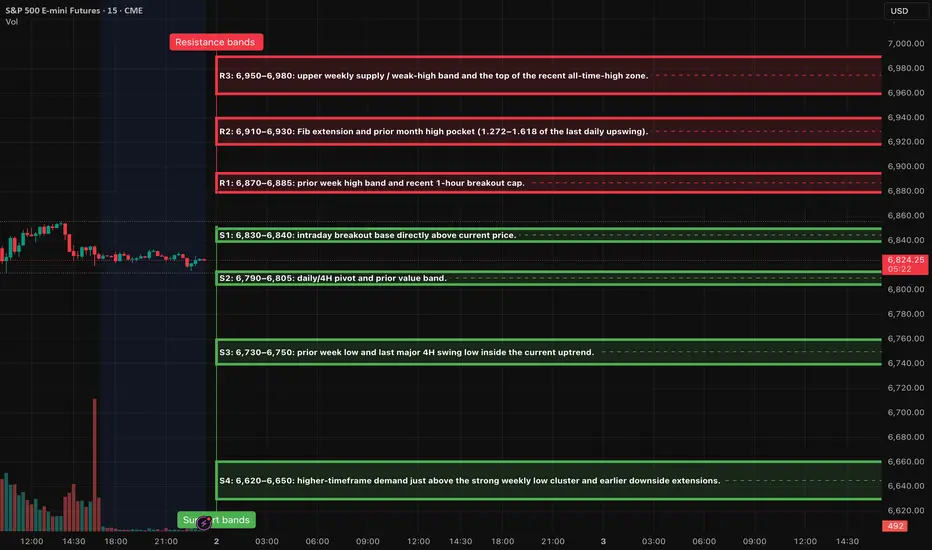
ES UpdateIs the melt up over? I dunno, probably staying out at least another day. Trying to avoid the whipsaw.
The problem with a melt up is that indicators won't tell you when it's gonna be over. What I can tell you is that the gap from last week filled, as expected.
I don;t think I want to go long unt

Day 78 — Surviving the Chop: When Nothing WorksEnded the day +$36.64 trading S&P Futures. Today was super stressful despite the small green finish. The market structure was flipping up and down constantly, with no real trend and moving averages/zones failing to hold. It honestly felt like one of those days where the Market Makers are specificall

ES - December 2nd - Daily Trade PlanDecember 2nd- Daily Trade Plan - 6:20am
*Before reading this trade plan, if you did not read yesterday's take the time to read it first! (You can view the posts in the related publication section) *
If my posts provide quality information that has helped you with your trading journey. Feel free to
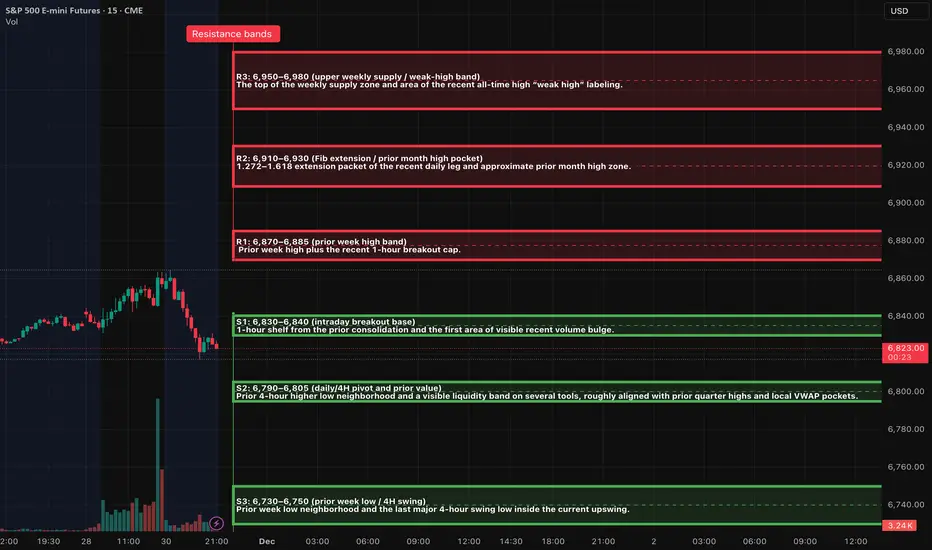
S&P 500 Key Levels to Monitor:Trading Approach:
If you're LONG now: Consider taking partial profit or tightening stop
If you're FLAT: Wait for retest at 6,814-6,780 to enter long
If it bounces hard at 6,814: That's your buy signal for 7,000 target
You're reading the chart well — the rejection at 6,864 + weak 15-min candle = rete
S&P Futures Trading Day 77 — Locking Gains in a Scary MarketEnded the day +$247.39 trading S&P Futures. I came into the session with a bullish bias thanks to the market structure, and initially, things looked great as I caught a nice move breaking over the 1-minute MOB. However, the market had some tricks up its sleeve—I got stop-hunted trying to play the br

ES (SPX, SPY) Deep Analyses for Upcoming Week (Dec 1st - 5th)Multi-Timeframe Market Structure Analysis
Weekly Trend Overview
The E-mini S&P 500 (ES) continues to reflect a robust bullish trend on the weekly chart, characterized by a series of higher highs and higher lows. The most recent swing low is situated in the mid-6,500s, while prices are currently
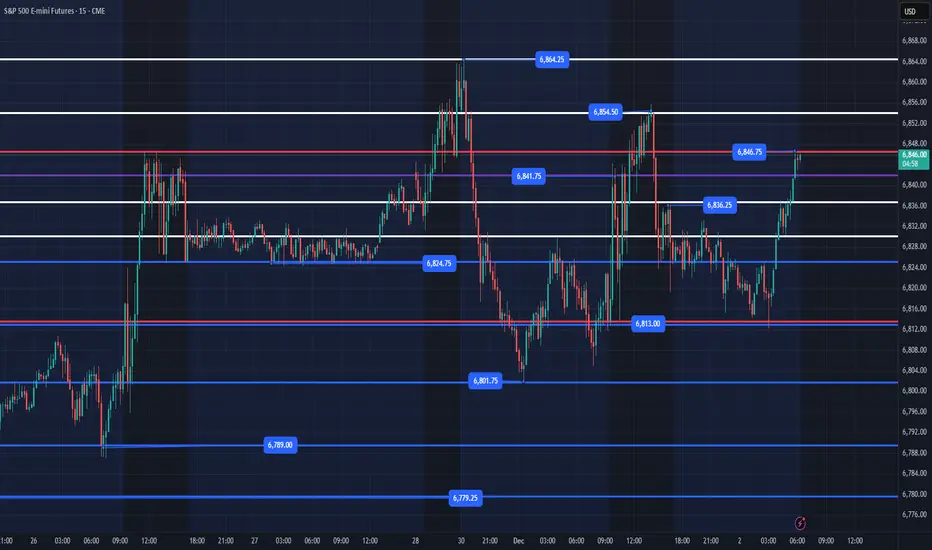
ES UpdateIndicators still show a melt up, but there's a gap below and usually the market has a red day after a holiday pump week, so watch out for Monday.
Opted to sell my GLD calls and going cash for the weekend.
It's usually not a good idea to place any trades on a half day anyways.

ES (SPX, SPY) Analysis, Levels, Setups for Tue (Dec 2nd)The market structure remains optimistic on the higher timeframes, bolstered by a significant rebound from the 6,520 levels. Currently, prices are fluctuating in the upper range of this move, consolidating between the intraday support and the previous weekly high. Although momentum indicators are str
ES Gap AlertIndex futures all threw a gap up on the Thanksgiving break. If it doesn't fill Friday, it'll probably fill Monday.
Don't recommend going long on the half day trading.

See all ideas
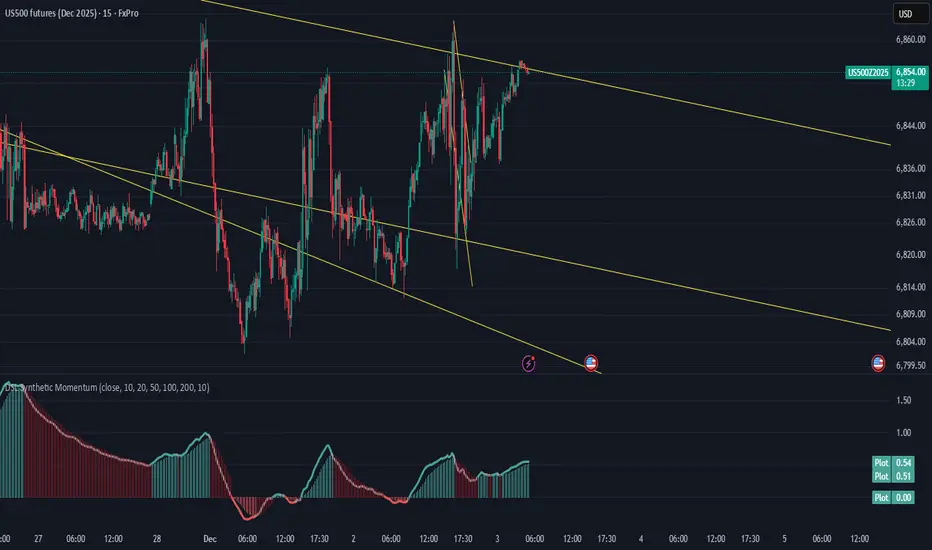
Summarizing what the indicators are suggesting.
Neutral
SellBuy
Strong sellStrong buy
Strong sellSellNeutralBuyStrong buy
Neutral
SellBuy
Strong sellStrong buy
Strong sellSellNeutralBuyStrong buy
Neutral
SellBuy
Strong sellStrong buy
Strong sellSellNeutralBuyStrong buy
A representation of what an asset is worth today and what the market thinks it will be worth in the future.
Displays a symbol's price movements over previous years to identify recurring trends.
Frequently Asked Questions
The current price of S&P 500 E-mini Futures is 6,881.50 USD — it has risen 0.24% in the past 24 hours. Watch S&P 500 E-mini Futures price in more detail on the chart.
The volume of S&P 500 E-mini Futures is 51.13 K. Track more important stats on the S&P 500 E-mini Futures chart.
Open interest is the number of contracts held by traders in active positions — they're not closed or expired. For S&P 500 E-mini Futures this number is 2.01 M. You can use it to track a prevailing market trend and adjust your own strategy: declining open interest for S&P 500 E-mini Futures shows that traders are closing their positions, which means a weakening trend.
Buying or selling futures contracts depends on many factors: season, underlying commodity, your own trading strategy. So mostly it's up to you, but if you look for some certain calculations to take into account, you can study technical analysis for S&P 500 E-mini Futures. Today its technical rating is buy, but remember that market conditions change all the time, so it's always crucial to do your own research. See more of S&P 500 E-mini Futures technicals for a more comprehensive analysis.