ES - December 4th - Daily Trade PlanDecember 4th- Daily Trade Plan - 8:30am
*Before reading this trade plan, if you did not read yesterday's take the time to read it first! (You can view the posts in the related publication section) *
If my posts provide quality information that has helped you with your trading journey. Feel free to boost it for others to find and learn, also!
My daily trade plan and real-time notes that I post are intended for myself to easily be able to go back and review my plan and how I did from an execution perspective.
--------------------------------------------------------------------------------------------------------
You can review my trade plan from yesterday and the daily note updates to see which levels we grabbed points from.
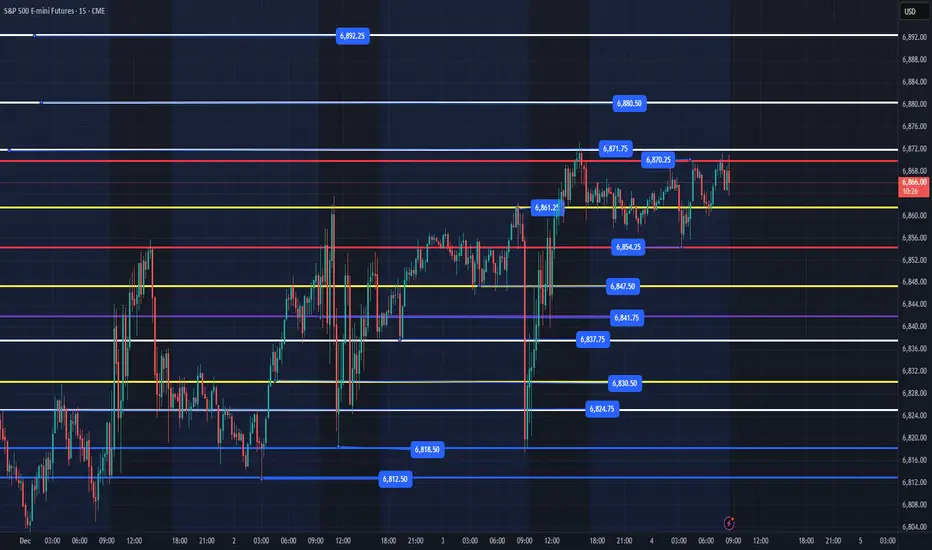
Overnight we have been building a nice bull flag between 6854-6870. Looking at the bigger picture price looks like it wants to go higher and break out of this range we have been. My general lean today is that we have a flush and reclaim of 6854 before heading up. We might only get as low as 6861. IF price loses 6818 then we should move lower.
Key Levels Today
1. 6861 flush and reclaim
2. 6854 flush and reclaim
3. 6847 flush and reclaim
4. 6837 flush and reclaim
5. 6818 flush and reclaim (wait for reclaim of 6824)
Below these levels and price will most likely be selling off and I would be getting out the way and let price find a level below to reclaim and move higher.
I will post an update around 10am EST
----------------------------------------------------------------------------------------------------------------
Couple of things about how I color code my levels.
1. Purple shows a current or prior weekly low
2. Red shows the current overnight session High/Low (time of post)
3. Blue shows the previous day's session Low (also other previous day's lows)
4. Yellow shows core support/resistance levels
5. White shows overhead resistance/targets
Trade ideas
Day 80 — From Green to Red: The Danger of OverstayingEnded the day -$256 trading S&P Futures. I was actually up +$250 early in the session, but I made the mistake of itching for more after playing it safe with small gains all week. I decided to size up to 6 contracts on a Buy signal that looked solid, but the market had other plans. We saw a "flash crash" out of nowhere that stopped me out, only for price to rip all the way back up after tagging the 10-minute MOB. It felt scammy, stressful, and honestly, it ruined the day. It’s a harsh reminder that right now, the longer you stay in this market, the more dangerous it gets.
🔔News Highlights: *S&P 500, NASDAQ END HIGHER, VIX FALLS AS INVESTORS BRACE FOR KEY INFLATION DATA
📈
Key Levels for Tomorrow:
Above 6840= Bullish Level
Below 6830= Bearish Level

ES UpdateIs the melt up over? I dunno, probably staying out at least another day. Trying to avoid the whipsaw.
The problem with a melt up is that indicators won't tell you when it's gonna be over. What I can tell you is that the gap from last week filled, as expected.
I don;t think I want to go long until FDAX goes oversold anyways.

Day 78 — Surviving the Chop: When Nothing WorksEnded the day +$36.64 trading S&P Futures. Today was super stressful despite the small green finish. The market structure was flipping up and down constantly, with no real trend and moving averages/zones failing to hold. It honestly felt like one of those days where the Market Makers are specifically trying to break trader psychology and force mistakes. Usually, when I see this kind of chop and manipulation, it signals that a big directional move is brewing for later in the week.
📰 News Highlights
OPENAI DECLARES ‘CODE RED’ AS GOOGLE NASDAQ:GOOGL CLOSES IN
🔑 Key Levels for Tomorrow
Above 6830 = Bullish Below 6800 = Bearish

ES - December 2nd - Daily Trade PlanDecember 2nd- Daily Trade Plan - 6:20am
*Before reading this trade plan, if you did not read yesterday's take the time to read it first! (You can view the posts in the related publication section) *
If my posts provide quality information that has helped you with your trading journey. Feel free to boost it for others to find and learn, also!
My daily trade plan and real-time notes that I post are intended for myself to easily be able to go back and review my plan and how I did from an execution perspective.
--------------------------------------------------------------------------------------------------------
I was on vacation with my family last week and received a lot of messages asking about my daily trade plan. I have not posted since the 25th as I was travelling and enjoying time with my family. I hope you had a great Thanksgiving and spent time with your families!
Let's get into today!
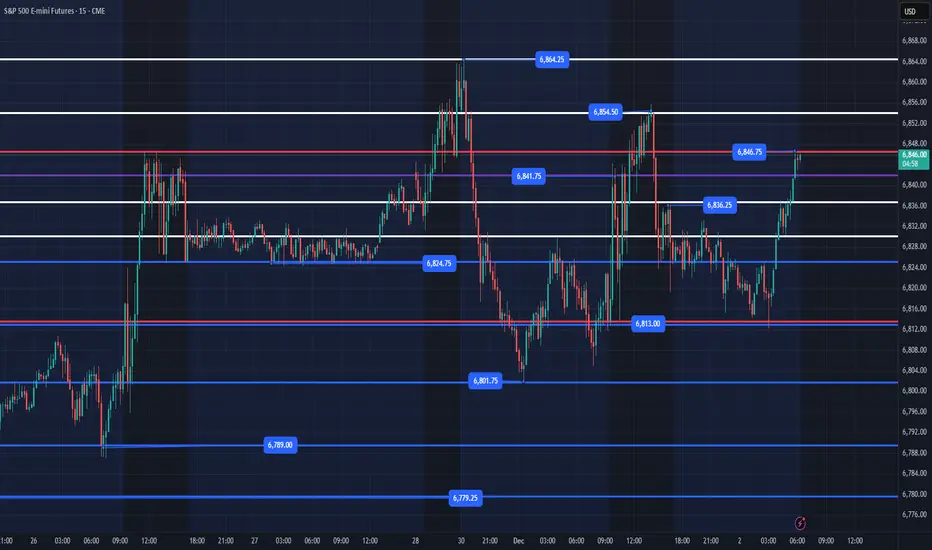
The overnight low is 6813 and overnight high is 6846. Since my last daily trade plan, we have been consolidating between 6789 - 6864. We have had some great trades around the 6800-6815 level that has been a magnet over the past sessions. We still have not made a higher high during this time. Until we clear 6854, 6864 we are technically in a range that has been bought and sold between 6813-6864. Price should continue higher and I do not expect price to lose 6779 (lowest) for us to continue higher. IF price loses 6779, we will most likely need to head lower to find levels to engage to take us higher. Until then, let's look at areas that could produce some points today.
Key Levels Today
1. 6813 flush and reclaim
2. 6801 flush and reclaim
3. 6789 flush and reclaim
Below these levels and price will most likely be selling off and I would be getting out the way and let price find a level below to reclaim and move higher.
I will post an update around 10am EST
----------------------------------------------------------------------------------------------------------------
Couple of things about how I color code my levels.
1. Purple shows the weekly Low
2. Red shows the current overnight session High/Low (time of post)
3. Blue shows the previous day's session Low (also other previous day's lows)
5. White Levels are previous day's session High/Low
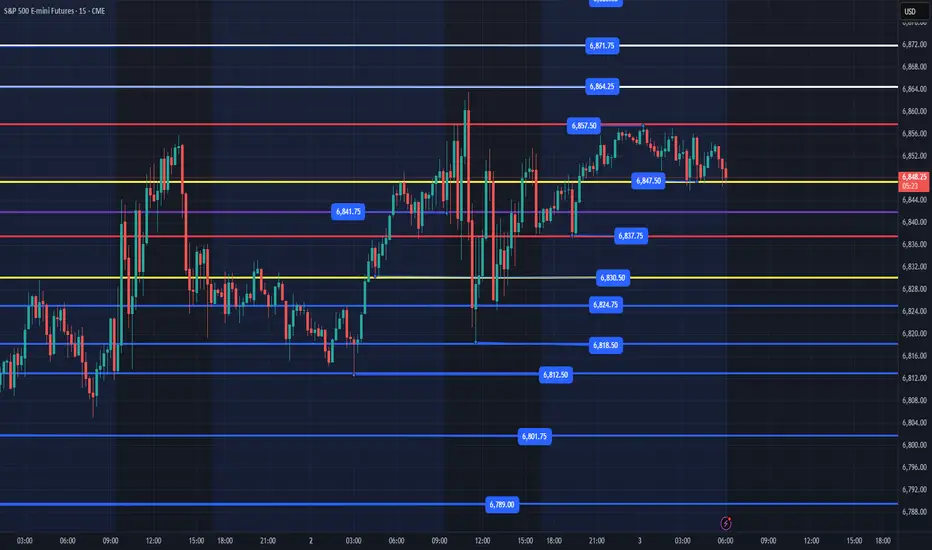
ES - December 5th - Daily Trade PlanDecember 5th- Daily Trade Plan - 7:30am
*Before reading this trade plan, if you did not read yesterday's take the time to read it first! (You can view the posts in the related publication section) *
If my posts provide quality information that has helped you with your trading journey. Feel free to boost it for others to find and learn, also!
My daily trade plan and real-time notes that I post are intended for myself to easily be able to go back and review my plan and how I did from an execution perspective.
--------------------------------------------------------------------------------------------------------
We had a nice push higher into the close yesterday and set the overnight low at 6861. This low produced a nice bounce for about 25pts into the overnight high of 6886. Technically we continue to make higher highs and higher lows. We are coming into some key resistances that will determine if this consolidation range has been distributing or accumulating by the institutions this week.
We can see clearly on a 1hr time frame chart that 6836 was our last big dip yesterday that produced a nice rally yesterday afternoon and into the overnight session. Price needs to hold 6818 for this trend to continue. Ideally, we can get one more big flush below 6836 and quickly reclaim for a quality failed breakdown. Flush and reclaim of the overnight low at 6861 is another quality level to look for. 6874 is the lowest quality level but might be all we get.
Key levels today
1. 6874 flush and reclaim (lower quality)
2. 6861 flush and reclaim (high quality)
3. 6847 flush and reclaim (Can wait for reclaim of 6861 for higher quality)
4. 6836 flush and reclaim (might only get to 6841 or 6847)
IF price does clear 6897-6900, we should continue higher into the 6952 and then ATH's. IF price loses 6836 and cannot quickly recover then we could be in for a strong sell off below. I will with 6812, 6801, 6790 being the top 3 levels I will be looking for points.
Below these levels and price will most likely be selling off and I would be getting out the way and let price find a level below to reclaim and move higher.
I will post an update around 10am EST
----------------------------------------------------------------------------------------------------------------
Couple of things about how I color code my levels.
1. Purple shows a current or prior weekly low
2. Red shows the current overnight session High/Low (time of post)
3. Blue shows the previous day's session Low (also other previous day's lows)
4. Yellow shows core support/resistance levels
5. White shows overhead resistance/targets

S&P 500 Key Levels to Monitor:Trading Approach:
If you're LONG now: Consider taking partial profit or tightening stop
If you're FLAT: Wait for retest at 6,814-6,780 to enter long
If it bounces hard at 6,814: That's your buy signal for 7,000 target
You're reading the chart well — the rejection at 6,864 + weak 15-min candle = retest is likely beginning. Stay patient! 🎯
S&P Futures Trading Day 77 — Locking Gains in a Scary MarketEnded the day +$247.39 trading S&P Futures. I came into the session with a bullish bias thanks to the market structure, and initially, things looked great as I caught a nice move breaking over the 1-minute MOB. However, the market had some tricks up its sleeve—I got stop-hunted trying to play the breakout zone at 6828, giving back some profits. I didn't let that rattle me, though; I went long again at support off the 11:10 signal, made the money back, and hit my ~$250 goal. With how "scary" and fragile everything feels lately, I decided to just lock in the smaller gains and call it a day.
📰 News Highlights
*BITCOIN TUMBLES 5% TO $86K AMID CRYPTO SELLOFF
🔔 VX Algo Signals
9:00 AM — MES Market Structure flipped bullish (X3) ✅
11:10 AM — VXAlgo NQ X1DP Buy Signal ✅
2 out of 2 signals worked — 100% accuracy today.
🔑 Key Levels for Tomorrow
Above 6830 = Bullish Below 6800 = Bearish

Day 81 — 100% Signal Accuracy & Back in RhythmEnded the day +$287.49 trading S&P Futures. After the stress of the last few sessions, I’m finally feeling better and getting back into a solid rhythm. Today was one of those rare days where the system was absolute perfection—we went 6 for 6 on the signals. With the market clinching a 4-day winning streak ahead of the Fed meeting, it was all about trusting the data, following the market structure flips, and executing cleanly without overthinking it.
🔔News Highlights:*DOW ENDS UP 100 POINTS, S&P 500 AND NASDAQ CLINCH 4-DAY WINNING STREAK AHEAD OF FED MEETING
📈Key Levels for Tomorrow:
Above 6855= Bullish Level
Below 6842= Bearish Level

ES (SPX, SPY) Deep Analyses for Upcoming Week (Dec 1st - 5th)Multi-Timeframe Market Structure Analysis
Weekly Trend Overview
The E-mini S&P 500 (ES) continues to reflect a robust bullish trend on the weekly chart, characterized by a series of higher highs and higher lows. The most recent swing low is situated in the mid-6,500s, while prices are currently testing the previous weekly high zone around the high-6,800s, accompanied by a labeled weak high band overhead.
In terms of market positioning, prices reside firmly in the upper half of the annual range, trading within a premium supply band rather than at a discount. Momentum indicators are showing signs of a slowdown, with the weekly oscillator retreating from overbought conditions and gently sloping downward, even as prices hold near their highs. This situation exemplifies early-stage negative momentum divergence, suggesting that while the overarching trend remains intact, any upside progress is now slower and increasingly susceptible to pullbacks.
The structural bull market on the weekly timeframe is still valid, but the current price action falls into a costly zone, placing the onus on buyers to maintain upward momentum.
Daily Trend Analysis
Following a notable decline in November from the all-time high, ES established a higher low around the mid-6,500s, coinciding with a key extension bundle. Subsequently, it rebounded through the mid-6,700s, successfully reclaiming the essential daily midrange. The latest price action reflects a sequence of lower lows (LL), higher lows (HL), and a higher high, signaling a short-term bullish trend within a broader sideways pattern just beneath the recent highs.
The active daily range is delineated between 6,650 and 6,900, with current trading situated in the upper third. The daily momentum oscillator has sharply ascended from oversold territory and sits comfortably in the 60s—nearing overbought conditions but not quite there yet.
The daily trend indicates an uptrend initiated from a higher low, now testing resistance levels. Trend-following participants are positioned long, though late entrants may find themselves crowded near the upper edge of the trading range.
Four-Hour Structural Insights
The 4-hour chart reveals a strong reversal from a low around 6,525, where price structure has formed a clean stair-step of higher highs and higher lows. The latest 4-hour higher low rests in the high-6,700s. The recent impulse leg from this higher low has driven prices into the prior week's high and supply band near the high-6,800s. Observations indicate that candles are narrowing while wicks are extending, typically signaling an impending maturation of the current price leg.
While this remains largely an impulse move rather than a complete correction, the risk-to-reward ratio for entering fresh long positions at these levels appears unfavorable without a corrective pullback.
The 4-hour trend is decidedly bullish, yet this leg is maturing. A retracement toward the last observed higher low band in the high-6,700s would be both typical and healthy for the ongoing progression.
One-Hour Intraday Context
The 1-hour chart indicates a prolonged consolidation phase in the low-to-mid-6,800s, succeeded by a breakout thrust toward the prior week’s high. Recent micro-structural developments show small higher highs with diminished follow-through into the resistance zone. The emergence of upper wicks on the 1-hour candles suggests we're in the later stages of this move which originated from Friday’s New York low.
For intraday traders, entering new positions at this stage carries poor asymmetry. Strategies may involve either capitalizing on a potential exhaustion spike higher or considering buys only after a reset lower.
The intraday price leg is nearing maturity; anticipate either a minor mean reversion back into the breakout base or a final overshoot into the overhead extension band, followed by a more substantial pause.
Oscillator Insights on Weekly and Daily Timeframes
On the weekly front, the oscillator is rolling over from overbought levels, keeping prices near previous highs. While this in itself does not constitute a sell signal, it does imply that any additional advances will likely become increasingly challenging and volatile. Conversely, the daily oscillator remains robust, exhibiting positive momentum and trending upwards, although already sitting at mid-to-high levels. While there remains potential for one more uptick toward resistance, the risk of a sharp downturn looms larger should market news or flows fail to meet expectations.
Bottom Line: The primary timeframe indicators (weekly/daily) maintain a bullish outlook, while the active swings on the 4-hour and 1-hour charts are showing maturity and extension into resistance. The upcoming trading week will likely focus on navigating this late-stage upswing, either through fading exhaustion at the range's peak or by purchasing on controlled dips into well-defined demand zones.
Market Overview: Key Levels and Dynamics
Trend Boundary Analysis: 6,780 Area
The pivotal threshold for discerning between a healthy pullback and a significant trend reversal lies around the 6,780 mark. A sustained daily close below this level—specifically under S2 and near the last daily higher low—would signal a transition from what appears to be a “healthy pullback in an uptrend” to a more pronounced “daily correction.” In contrast, remaining above 6,780 allows for the interpretation of pullbacks as buyable dips into existing demand. However, should the market close below this threshold with consistent acceptance evidenced by multiple 4-hour closes and significant volume, the prevailing sentiment would shift towards anticipating a larger trading range or an early trend change.
Volatility Metrics Overview
The volatility index (VIX) closed at approximately 16.35 on Friday, a considerable drop from the mid-20s earlier in the month, indicating a low-to-moderate equity volatility regime. The options market appears relaxed rather than panicked. The VIX term structure has returned to contango, with the front month trading cheaper than the back month, supporting a risk-on environment without veering into euphoria. On the treasury front, the MOVE index remains elevated at around 69, having retreated from mid-80s spikes earlier in November, signaling that rate volatility has cooled yet remains high compared to pre-2022 standards.
The recent readings suggest that the fear that overshadowed the mid-month selloff has largely been priced out. Both equity and rate volatility have begun to mean-revert, typically favoring range trading and a more orderly trend rather than severe sell-offs. However, it’s important to note that the current state makes protective measures inexpensive, hinting that abrupt corrections could emerge unexpectedly.
Options Positioning Dynamics
The total put/call ratio is hovering around 0.70 for the latest session, suggesting a slight tilt towards puts relative to longer-term averages. The equity put/call ratio stands at about 0.44, indicating a bullish, call-heavy sentiment among traders, predominantly in single-name options. The 10-day moving average of the put/call ratio is roughly 0.92, slightly below neutral, indicating some short-term complacency, although not excessively stretched.
The SKEW index has stabilized around 143, down from the 160s a year ago but still above the traditional baseline of 120-130. This points to an inclination for tail hedging that is present but not extreme. Given the mid-teen VIX levels and a neutral total put/call ratio combined with a low equity put/call ratio, it is reasonable to deduce that dealers are likely not heavily short gamma at current spots. They may be positioned closer to long or flat gamma within the 6,750-6,900 range, which generally dampens intraday volatility and suggests a tendency toward mean-reversion. Conversely, movement outside this band—specifically above 6,950 or below 6,730—could alter the gamma positioning and pave the way for more significant directional shifts.
Market Breadth and Internal Strength
The S&P 500 concluded the week with a modest 0.5% gain on Friday, reflecting small gains throughout the month, while the Nasdaq faced a 1.5% decline, primarily driven by weakness in large technology stocks. The S&P 500 remains above both its 50-day and 200-day moving averages, having reclaimed the 50-day line last week after an earlier dip, suggesting renewed market participation beyond just a few mega-cap stocks.
Sector performance varied notably, with technology facing headwinds throughout November—most notably from AI-linked companies—while sectors such as energy, consumer cyclicals, and certain areas of healthcare and financials saw positive movements towards month-end. Despite an earlier warning from indicators like the McClellan Oscillator suggesting internal weaknesses, the recent rebound has begun to improve breadth. However, concerns linger that this rally might be more fragile than typical broad-based advances, given its rotational and choppy nature.
Credit and Funding Landscape
The high-yield index (HYG) hovers around 81, near recent highs, indicating generally favorable credit conditions as it has progressively climbed through November. High-yield spreads are tightening relative to recent standards, reinforcing a “risk-on” attitude within credit markets. There are no apparent signs of acute funding stress; previous operational disruptions in futures markets were not indicative of systemic issues.
Currently, credit markets are not signaling alarms. As long as HYG remains above approximately 79, equity dips are more likely to be viewed as buying opportunities rather than triggers for widespread liquidation.
Sentiment and Investor Positioning
In the latest AAII survey, the bull-bear spread stands at around -11%, indicating a modest bearish sentiment, with bears outnumbering bulls by approximately 11 percentage points—below the historical mean of +6%. Conversely, the low equity put/call ratio suggests that traders are actively pursuing upside positions in individual equities.
In summary, while survey data points to cautious investor sentiment, options markets illustrate a preference for call buying and a diminishment of fear. This dichotomy often results in uneven uptrends with the potential for sudden pullbacks when complacency is inevitably challenged.
Global Risk Sentiment and Cross-Asset Overview
In the cryptocurrency sector, Bitcoin has stabilized around 90-91k following a significant correction earlier in the month, with modest recovery observed in the past week. This development underscores a risk-on atmosphere among investors.
Macro and data-calendar context
• The coming week (Dec 1–5) is busy but not as pivotal as the mid-December CPI/Payrolls
• Key events:
• Monday: ISM Manufacturing and construction spending.
• Tuesday: JOLTS job openings.
• Wednesday: ADP employment and ISM Services, plus several PMI and industrial-production figures.
• Thursday: Challenger job cuts, weekly jobless claims, and trade balance.
• Friday: Critically, the delayed PCE and core PCE inflation data for September, pushed back by the recent government shutdown.
• Fed communication: The Fed is effectively entering its pre-meeting quiet period; Powell’s upcoming speech is one of the last major remarks before the December meeting.
Macro narrative: Markets are leaning heavily toward another Fed rate cut in December and a benign inflation path.  Given that, negative surprises in PCE or labor data could trigger a sharp repricing.
The late-November rally appears to be a recalibration of positioning and sentiment following a mid-month scare within the tech sector, rather than a direct response to any significant data shock. This week's major macroeconomic event is Friday's PCE report; other data releases are expected to influence intraday fluctuations rather than alter the overarching trend.
Scenario Analysis and Probabilities
These scenarios represent probabilistic outcomes rather than certainties.
Primary Path — “Controlled Grind with Dip-Buying” (Approximately 50%)
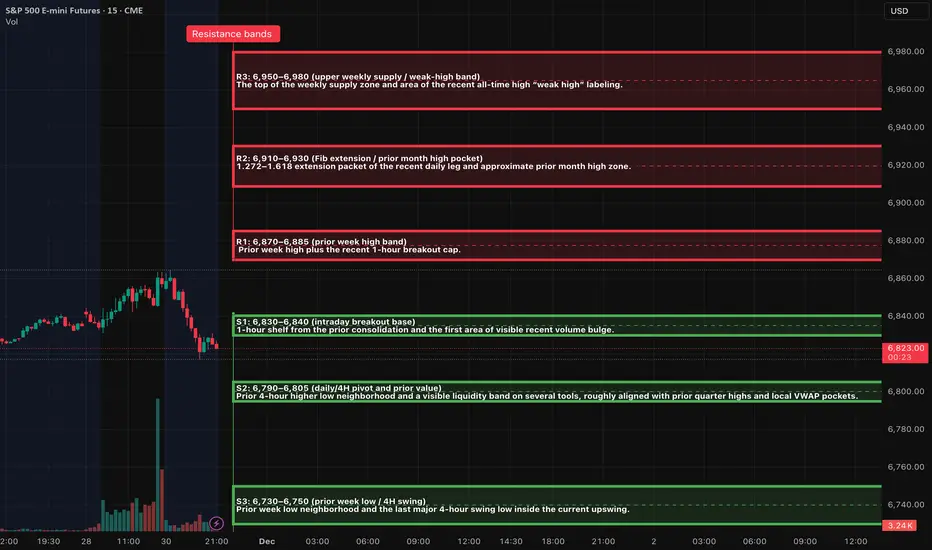
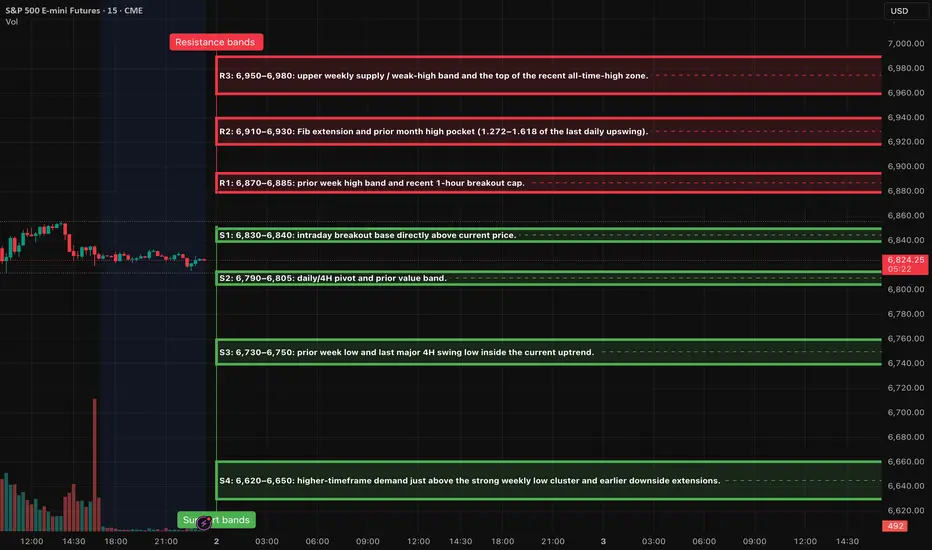
As we enter Monday, expect a modest pullback from Friday's late gains, with overnight Globex trading projected to fluctuate between 6,820 and 6,880. Early in the week, the market may test support levels S1 (6,830–6,840) or potentially S2 (6,790–6,805), ultimately leading to renewed attempts to breach resistance at R1 and possibly R2. By the week’s end, prices are anticipated to oscillate within a broad range of 6,790–6,930 ahead of Friday's PCE announcement, with only temporary moves outside this zone.
Confirmation Criteria: This path will be validated if we observe rejections below the 6,780 level holding firm on a closing basis, accompanied by repeated failures of sellers to maintain downward pressure beneath S2.
Bear-Extension Path — “Deeper Reset Before Year-End” (Approximately 30%)
This scenario is triggered by a failed breakout above R1/R2 early in the week, coupled with a significant intraday reversal and a decisive 4-hour close beneath S2 and potentially S3. Initial price action may feature a spike into the 6,910–6,930 range followed by swift sell-offs, leading to a rapid retreat back through S1 and S2, particularly if the PCE data comes in above expectations or labor statistics surprise on the upside, prompting a re-assessment of potential Fed rate cuts.
Target Area: The initial aim would be the 6,650–6,700 region (near S4), with the possibility of a complete reversal down toward the more robust 6,620–6,650 band.
Confirmation Criteria: Continuous acceptance below approximately 6,730 on a 4-hour basis, combined with a daily close under the 6,780 threshold, would indicate a return to the narrative of a higher low for November.
Bull-Surprise Path — “Breakaway Into New Highs” (Approximately 20%)
This scenario is set in motion by a clear 4-hour and subsequent daily close above R2 and R3, driven by exceptionally benign PCE numbers and a supportive stance from the Federal Reserve. Initial price action should reflect minimal pullback in the early part of the week, steadily climbing past R1 and R2, ultimately resulting in a trend day that aggressively squeezes shorts above the 6,950 mark.
Target Area: The market will likely gravitate toward the extension zone of 7,050–7,100.
Confirmation Criteria: Sustained trading above 6,930 without significant reversals, robust market breadth, and a VIX that remains comfortably anchored in the mid-teens or lower will serve as key indicators for this bullish outlook.
Two A++ setups for the week
A++ Setup 1: Rejection short from R2
Fade spike into 6,910-6,930; Entries, SL, TPs
Entry zone: 6,890–6,900 on the first clean 1-minute pullback after the 5-minute lower high.
Initial stop: Above the rejection high plus a small buffer; planning number ~6,935. That is about 35-45 points of risk if filled near 6,895-6,900; refine to the actual 15-minute wick when it forms.
TP1: 6,830-6,840 (S1 / breakout base). From a 6,895 entry, that is roughly 55–65 points, giving at least 1.3-1.5R with the conservative stop and significantly more if the wick is tighter.
TP2: 6,790-6,805 (S2 demand pocket).
TP3 (runner): 6,730-6,750 (S3), only if tape is heavy (e.g., PCE or data shock).
A++ Setup 2: Continuation long from S2
ES Long (A++) - Buy reclaim of 6,790–6,805; Entries, SL, TPs
Entry zone: 6,805-6,815 on the first 1-minute higher-low after the 5-minute confirmation.
Initial stop: A few points below the spike low; planning number ~6,780, which gives about 25–35 points of risk.
TP1: 6,870-6,885 (R1 / prior week high band). From a 6,810 entry, that is roughly 60–75 points, delivering comfortably more than 2R with the planned stop.
TP2: 6,910-6,930 (R2 extension band).
TP3 (runner): 6,950-6,980 (R3 / upper weekly supply) if PCE and flows are supportive.
Good Luck !!!
ES (SPX, SPY) Analysis, Levels, Setups for Tue (Dec 2nd)The market structure remains optimistic on the higher timeframes, bolstered by a significant rebound from the 6,520 levels. Currently, prices are fluctuating in the upper range of this move, consolidating between the intraday support and the previous weekly high. Although momentum indicators are stretched, they have yet to indicate a reversal, suggesting a potential continuation toward resistance levels R1 and possibly R2, provided that buyers can uphold the nearest support zones. Conversely, a failure to maintain support at S1 and S2 could pave the way for a deeper corrective phase targeting S3.
The levels are remain the same from yesterday analysis.
A++ SETUP 1 - LONG FROM S2 RELOAD BAND (6,790-6,805)
look for an overnight or early NY flush into 6,800 ± 10 points, followed by a strong rejection: wick below S2 on 15m, close back inside the band, plus a higher low on 5m.
Entry zone: 6,800-6,795 (inside S2 once rejection shows).
Hard stop: 6,780 (below the lower edge of S2 and recent wick structure).
TP1: 6,845-6,855 (back through S1 into the middle of the current range).
TP2: 6,870-6,885 (R1 test).
A++ SETUP 2 - SHORT LIQUIDITY SWEEP INTO R1 (6,870-6,885)
during London or NY AM, price spikes through 6,870 into the 6,870-6,885 band, takes out prior highs, but then prints a rejection: 15m candle with an upper wick and close back below about 6,875, plus a lower high on 5m.
Entry zone: 6,875-6,880 after the rejection is confirmed, not on the first blind touch.
Hard stop: 6,895 (above the top of R1; acceptance above there suggests a push toward R2).
TP1: 6,835-6,840 (back into S1).
TP2: 6,800-6,795 (retest of S2).
Key Events and Data to Watch on Tuesday
Tomorrow's U.S. session will be pivotal, focusing on key indicators of manufacturing and construction. The final S&P Global U.S. Manufacturing PMI will be released at 9:45 a.m. ET, followed closely by the ISM Manufacturing Index at 10:00 a.m. ET—both crucial for assessing factory activity and the momentum of economic growth. Concurrently, the Commerce Department will unveil October Construction Spending figures, a vital metric for understanding demand in infrastructure and housing sectors. Additionally, domestic vehicle sales data will be published, providing further insight into consumer strength.
Moreover, the OECD's latest Economic Outlook will present updated global growth projections, which could significantly influence market risk appetite. As markets remain attuned to indicators of decelerating economic activity, any surprises in these reports could lead to notable shifts between support levels (S2) and resistance levels (R1/R2), potentially reinforcing expectations for a rate cut from the Fed in December.
S&P500: Futures Stuck in Tight Range S&P 500 futures traded mostly sideways yesterday, remaining confined within a tight range. In our primary scenario, however, we anticipate that magenta wave (4) will soon resume its downward move. During this phase, the index is expected to initially break below the support levels at 6540 and 6371 points. We then look for the final low of the wave (4) correction to occur within our green Long Target Zone between 6163 and 5912 points. Once this low is established, the subsequent wave (5) should propel prices above resistance at 6952, marking the peak of the broader blue wave (III). Immediately after, we expect the onset of magenta wave (1), which should kick off a significant corrective phase. However, if the index continues to fall below the Long Target Zone, our alternative scenario may come into play (probability: 31%). In that case, it would suggest that the alternative blue wave alt.(III) has already completed and the major correction is already in progress.

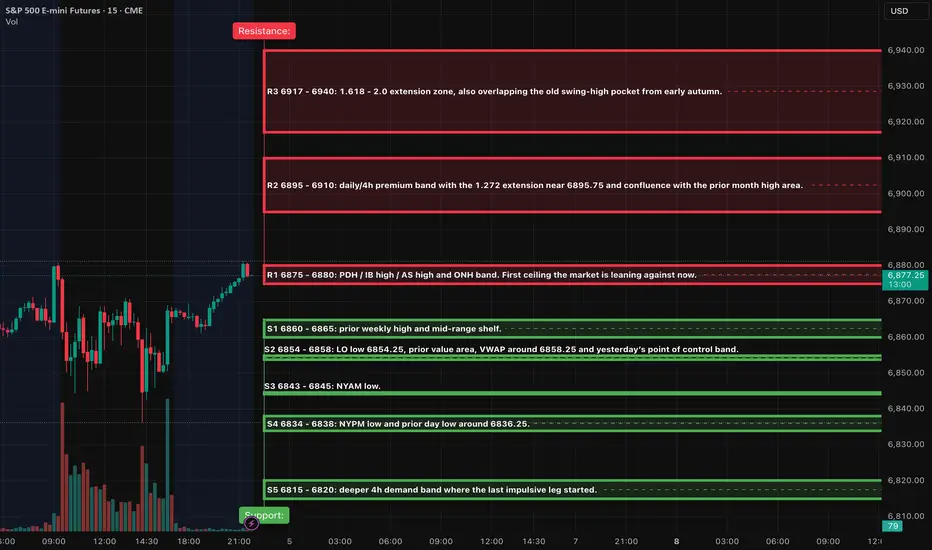
ES (SPX, SPY) Analysis, Key-Zone, Setups for Fri (Dec 5th)Market Overview
The daily trend remains firmly upward, with prices pressing against the November swing-high band, characterized by a sequence of higher lows and a gradual ascent toward previous peaks. Momentum indicators on both the daily and 4-hour charts are on the rise, yet they have not entered extreme levels, suggesting a likelihood of continued upward movement into the upper premium band rather than an imminent substantial reversal.
On the 4-hour and 1-hour charts, the E-mini S&P 500 (ES) has been consolidating in a narrow range, roughly between 6835 and 6880, as it builds energy just below the prior high. This range coincides with the 1.272 to 1.618 Fibonacci extension zone, located around 6895 to 6917. Given this setup, the outlook for tomorrow appears slightly bullish, provided the price remains above the mid-range support levels.
Market Brief: Key Developments for December 5, 2025
As we approach the final Federal Open Market Committee (FOMC) meeting of the year scheduled for December 9 -10, market participants are increasingly pricing in a substantial likelihood of a 25 basis point rate cut, along with further easing anticipated in the coming year.
For tomorrow, however, it’s important to note that the widely followed November employment situation report (including Non-farm Payrolls and the unemployment rate) has been officially postponed to December 16 due to the ongoing government shutdown. While some generic calendars may still reflect the original December 5 date for the payroll figures, this information has become outdated. At this time, it appears unlikely that any partial wage data will be released in lieu of the full report.
Nevertheless, many calendars are still marking U.S. hourly earnings and related labor indicators for the morning session. Expectations are set for hourly earnings, nonfarm payrolls, and unemployment rate placeholders around 8:30 AM ET, alongside the University of Michigan consumer sentiment and inflation expectations reports at 10:00 AM ET.
In practical terms, traders should expect regular liquidity levels in Asian and London markets. However, be prepared for potential volatility spikes around the 10:00 AM ET release of the U. Michigan data, especially if any unexpected headlines arise concerning the delayed labor report.
Market Outlook: Overnight Trends into New York Trading Session
As we head into the New York trading session, the key focus remains on the E-mini S&P 500 (ES). The base case scenario suggests that as long as ES maintains support above the significant range of 6854 to 6858 - often referred to as S2 - during any dips seen in the Asian and London sessions, we can anticipate a gradual upward movement. This trajectory would likely involve repeated testing of resistance levels around 6875 to 6880 (R1). Should we witness consistent hourly closes that approach this resistance with only modest pullbacks toward 6860, the likelihood of a breakout toward the premium zone of 6895 to 6910 increases, potentially occurring before or during the New York session.
On the other hand, the alternative scenario would unfold if the market decisively breaks below S2, resulting in a series of hourly closes beneath 6854. Such a development would signal a shift in sentiment and a potential rotation toward support levels S3 and S4, which target 6835. This would likely create a mean-reversion environment, with trading in New York focused more on the lower half of the 6835 to 6880 range rather than pushing for a breakout above resistance. Investors should tread carefully as these scenarios develop.
A++ setup 1 - Long breakout continuation above 6875
Bias: continuation long, only if we see real acceptance above R1.
Trigger conditions:
15m candle closes with a solid body above 6880, turning the 6875 - 6880 band from
Entry zone: 6878 - 6882 on the first 1m/5m higher low after that pullback holds.
Initial stop: 6869, tucked below the 6870 intraday pivot and just under the reclaimed band.
• TP1: 6904 - 6908, inside the 6895 - 6910 premium band, giving you roughly 2R or better if you are filled near the middle of the entry band and respect the tight stop.
• TP2: 6915 - 6918, near the 1.618 extension.
A++ setup 2 - Short reversal from failed break 6895 - 6910
Bias: high-quality fade only if the market runs stops into the premium band and then traps longs.
Entry zone: 6890 - 6896 on a retest of 6895 from below after that rejection is confirmed.
Initial stop: 6908, above the rejection high and inside the upper part of the premium band.
• TP1: 6858, back into the VWAP / prior value area pocket. That gives you roughly 2R or better if you are filled near mid-band with a 10 - 12 point stop.
• TP2: 6843 - 6845, test of NYAM low.
Tomorrow is shaping up to be a pivotal decision point following a robust advance in the market. As long as the support level around 6855 remains intact, any dips should be viewed as buying opportunities, particularly targeting the premium range of 6895 to 6917. However, a decisive rejection from this premium zone, with prices falling back through 6870, may signal an A++ short opportunity, potentially driving prices down toward 6858 and beyond.
Good Luck !!!
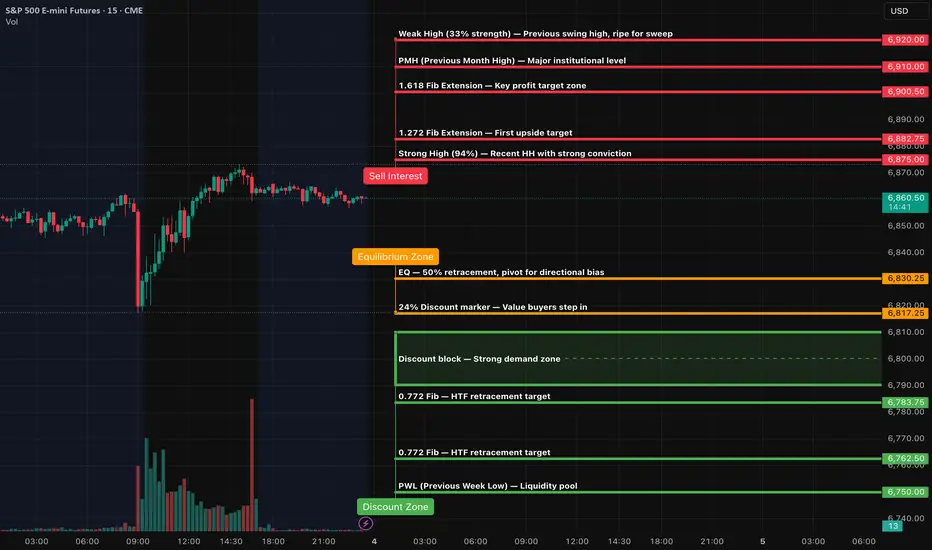
ES (SPX, SPY) Analysis, Levels, Setups for Thursday (Dec 4th)Market Outlook: Key Event and Trading Strategy
Main Event: Tomorrow's primary focus will be the release of US Initial Jobless Claims at 8:30 AM ET. Market participants should anticipate a significant increase in volatility during the premarket session surrounding this announcement. Notably, no other major US economic indicators of similar significance are scheduled to be released, which typically influence the E-mini S&P 500 (ES) as consistently as Jobless Claims does.
Investors should consider the 8:30 AM release as the initial decision point. It is advisable to allow for the initial volatility spike to materialize before assessing market levels as they begin to normalize. The A++ trading setups detailed below are designed to activate following the 8:30 move, ideally capitalizing on opportunities that arise during the morning session in New York.
Market Analysis: Current Landscape and Outlook
Daily Overview: The E-mini S&P 500 (ES) has maintained an upward trajectory, approaching the swing high levels from November. Currently, the price is positioned within the upper range of recent activity, just below a significant resistance zone situated in the high 6800s to low 6900s. While daily momentum indicators remain in positive territory, they are showing elevated levels, suggesting potential for upside continuation. However, the reward for initiating new long positions in proximity to resistance appears limited at this juncture.
An examination of the four-hour chart reveals a sideways trading band beneath the recent highs. Despite repeated attempts to breach the upper boundary, gains have not been sustained, though buyers continue to defend pullback levels. Below the current price, a notable demand zone exists between 6815 and 6825, with a deeper support area around 6780 to 6790. Should the 6815 level hold on a closing basis, the medium-term trend remains favorable.
Today’s price activity has formed a tight range, approximately between 6857 and 6865, with the previous day’s high located near 6873 and early lows today around 6820. The market appears to be consolidating near last week’s highs, with clear liquidity zones identified both above 6873 and below 6840.
For the overnight session extending into the New York trading day, the expectation is sideways-to-up as long as the price remains above 6815. This scenario suggests potential squeezes toward the 6885 to 6900 range before a more significant decision point emerges. Conversely, a decisive break and 15-minute close below the 6815 level would open the door to the 6780 to 6790 region and would likely temper the bullish outlook heading into Friday's session.
A++ Setup 1 - Short from upper band 6885-6898
Entry zone: 6882-6888 short on the first clean 5m lower high after the 15m rejection.
Initial stop: above 6898 (or 2-3 points above the rejection wick if that printed higher). From a mid-band entry, this is roughly 10-12 points of risk.
• TP1: 6860-6863 (return to the top of today’s box and prior week high zone).
• TP2: 6835-6840 (mid-band support).
• Optional runner TP3: 6818-6822 if 6840 fails and selling pressure accelerates.
Invalidation
A decisive 15m close above 6898 that then holds on a pullback. In that case, the short idea is downgraded and price is more likely aiming for 6915-6925.
A++ Setup 2 - Long from demand pocket 6815-6825
Entry zone: 6820-6826 long after the first clean 5m higher low and reclaim of 6825.
Initial stop: under 6808-6810, below the rejection wick and the lower edge of the pocket. From a 6823 entry this is about 13-15 points of risk.
• TP1: 6857-6860 (today’s box floor and first resistance on the way back up).
• TP2: 6868-6873 (prior day high and recent NYPM highs).
• Optional runner TP3: 6885-6895 if price continues squeezing toward the upper resistance band.
Invalidation
A 15m close beneath 6810 that is not reclaimed quickly. That opens the way toward 6780-6790 and downgrades the long.
Good Luck !!!
OB + RSI + MSS = WIN CME_MINI:MES1!
Today, I will present a large part of my strategy using three excellent example trades. It consists of various (SMC) concepts that I have combined.
Entry:
First, I look for an OB, BB, hidden divergence or liquidity sweep on the 1-hour chart. Then I go to the 15-minute and 5-minute TF and look for further RSI divergences, SMT divergences or OBs as confirmation and wait for an MSS.
(Important for hidden divergence: only enter after confirmation and leaving the divergence zone)
Take profit:
I set my take profit depending on the situation. Either just before a liquidity pool or on the Fibonacci extension zone 1 or just before zone 1.618.
Stop loss:
I set my stop loss just behind the OB or the candles of the RSI divergence zone, whereby I must achieve a CRV of at least 3 for each trade.
Feel free to give me feedback on my system and ask me questions!
Shoutouts to @Sirc255 through who I came upon RSI!

ES - December 3rd - Daily Trade PlanDecember 3rd- Daily Trade Plan - 6:10am
*Before reading this trade plan, if you did not read yesterday's take the time to read it first! (You can view the posts in the related publication section) *
If my posts provide quality information that has helped you with your trading journey. Feel free to boost it for others to find and learn, also!
My daily trade plan and real-time notes that I post are intended for myself to easily be able to go back and review my plan and how I did from an execution perspective.
--------------------------------------------------------------------------------------------------------
Yesterday we had some really good intraday levels that price continued to respect with no overnight session low that was flushed and reclaimed. You can see that we chopped around and have continued to maintain the range between 6812-6864.
Let's discuss today and what we are looking for. Our overnight session low is 6837 and our high is 6857. Price has been building a very tight range over the past few sessions, and we are getting close to a breakout or breakdown that could trigger today or tomorrow. Since we are not fortune tellers, we will need to focus on identifying levels we can grab points from today.
Key Levels Today
1. 6847 flush and reclaim (lower quality)
2. 6837 flush and reclaim (medium quality)
3. 6824 flush and reclaim (medium quality)
4. 6818 flush and reclaim (high quality)
5. 6812 flush and reclaim (high quality)
6. 6801 flush and reclaim (high quality)
Below these levels and price will most likely be selling off and I would be getting out the way and let price find a level below to reclaim and move higher.
I will post an update around 10am EST
----------------------------------------------------------------------------------------------------------------
Couple of things about how I color code my levels.
1. Purple shows a current or prior weekly low
2. Red shows the current overnight session High/Low (time of post)
3. Blue shows the previous day's session Low (also other previous day's lows)
4. Yellow shows core support/resistance levels
5. White shows overhead resistance/targets
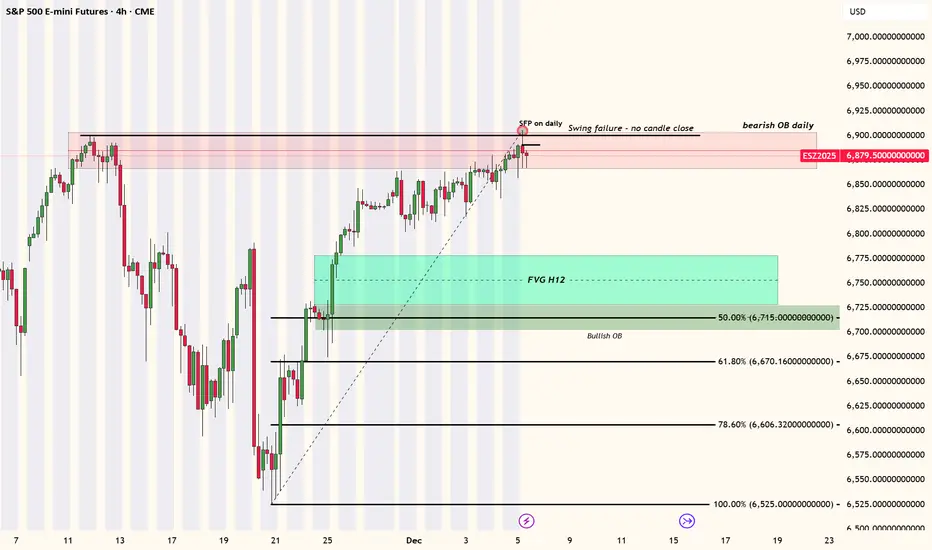
Short on ES1!Price was in a uptrend to an area where a bearish order block sits on the daily and weekly time frames. Additionally, there was a swing failure point from the previous range high to the current (area marked in red). Price may revisit the 12HR FVG with a bullish OB that sits right below it. Possible scenario - Price fills the FVG and may enter the bullish OB. The bullish OB also sits on the .50 fib from the range daily swing low to the current swing high.
S&P 500 (ES1!): Bullish! Look For Valid Buys!Welcome back to the Weekly Forex Forecast or the week of Dec. 1-5th.
In this video, we will analyze the following FX market: S&P 500 (ES1!)
The S&P500 rallied last week, closing strong! Look for follow through going into this week.
Go with the overall bullish trend until there is a bearish market structure break.
Enjoy!
May profits be upon you.
Leave any questions or comments in the comment section.
I appreciate any feedback from my viewers!
Like and/or subscribe if you want more accurate analysis.
Thank you so much.
Disclaimer:
I do not provide personal investment advice and I am not a qualified licensed investment advisor.
All information found here, including any ideas, opinions, views, predictions, forecasts, commentaries, suggestions, expressed or implied herein, are for informational, entertainment or educational purposes only and should not be construed as personal investment advice. While the information provided is believed to be accurate, it may include errors or inaccuracies.
I will not and cannot be held liable for any actions you take as a result of anything you read here.
Conduct your own due diligence, or consult a licensed financial advisor or broker before making any and all investment decisions. Any investments, trades, speculations, or decisions made on the basis of any information found on this channel, expressed or implied herein, are committed at your own risk, financial or otherwise.

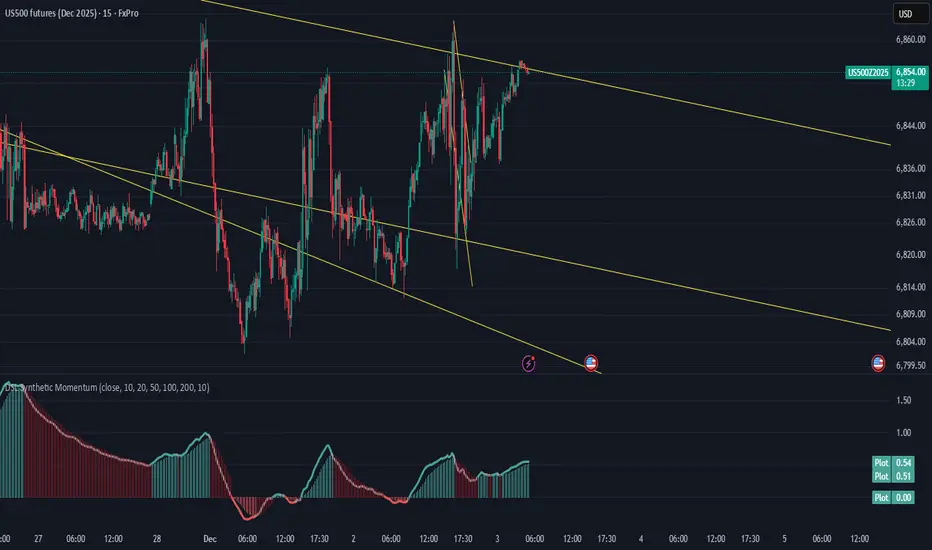
AI Stocks Weakness Could Spoil this Year’s Santa RallyAs December begins, traders worldwide are dusting off the same old question: Will we get a Santa Claus rally this year?
But 2025’s setup looks a little different. The market’s cheer seems to depend heavily on whether AI-related stocks can keep delivering miracles—and lately, the charts are suggesting they may be running out of steam.
When Tech Sneezes, the Market Catches a Cold
A quick look across U.S. equity futures shows a revealing pattern.
The E-mini NASDAQ 100 Futures (NQ), home to most AI and semiconductor giants, has posted a significantly lower monthly low compared to the prior month.
Meanwhile, the E-mini S&P 500 Futures (ES) declined much less, hinting at relative resilience, but also possible lagging weakness.
This divergence—NQ leading down while ES holds up—is a subtle warning. When the market’s growth engine (tech) loses traction, broader indices often follow with a delay. That’s the tension December traders are staring at: are we seeing the early signs of exhaustion before the holidays, or just a healthy pause?
Bearish Divergences Whisper “Caution”
The technicals are backing that cautious tone.
On the ES chart, the Commodity Channel Index (CCI) has been carving lower highs even as prices printed higher highs. This is a textbook bearish divergence, often an early sign that bullish momentum is fading.
The MACD histogram echoes the same message: momentum has been contracting through November despite new price highs, suggesting that underlying strength is eroding. Such divergences don’t predict direction on their own, but they do raise the probability of a short-term correction—or at least a choppy path into year-end.
The Price Map: Three Levels that Could Define December
Let’s outline the key technical zones traders are watching:
6,525.00: the prior monthly low—this is the first line of defense for the Santa Rally narrative. A break below this level would likely shift sentiment fast, especially if NQ continues under pressure.
6,239.50: the floor of a relevant UFO (UnFilled Orders) support zone. If ES dips below the prior low, this zone may become a “bear trap.” Many traders might short aggressively once 6,525.00 gives way, but those unfilled buy orders could absorb supply and trigger a sharp bounce. If the rally emerges from here, Santa might still make his visit.
4,430.50: a deeper UFO support cluster roughly 35% below current prices. If price were to cut through 6,239.50 and stay below it, the market would be entering a different regime altogether—likely accompanied by broken trendlines, volatility spikes, and a more defensive tone.
Reading Between the Lines: What the Divergence Means
Historically, the Santa Rally is powered by optimism, lighter volumes, and portfolio rebalancing. But this time, AI and semiconductor names—the champions of the current bull leg—are leading weakness.
That doesn’t mean doom; it means fragility.
The ES market may still rebound, but it’s doing so under reduced participation from the very sectors that drove prior gains.
Sizing the Trade Without Crossing the Line
For traders eyeing this setup through ES (E-mini S&P 500 futures) or MES (Micro E-mini S&P 500) futures, here’s a compliant, educational way to think about risk and position sizing:
Identify the Setup Zone: e.g., around 6,525.00 as potential demand, or below 6,239.50 as short-term breakdown.
Define Your Stop: the level where the technical picture is invalidated.
Set a Dollar Risk Limit: for instance, risking 1% of total account equity.
Derive Position Size: Divide your dollar risk by the price distance between entry and stop (converted into points). Then choose between the standard E-mini (ES) or Micro E-mini (MES) to match your risk tolerance and account size.
This framework lets traders adapt leverage responsibly—without needing the specific contract specs or margin figures, which vary by broker and time.
Risk Management: December Can Be a Trap
December is famous for emotional trading. The combination of holiday expectations, thinner liquidity, and year-end positioning can turn routine pullbacks into exaggerated moves.
That’s why focusing on risk before reward is critical.
The UFO support levels serve as reference zones where institutional activity might reappear, but they’re not guarantees. Managing stops, scaling out partial profits, and staying flexible matters more than trying to guess the market’s next headline.
ES and MES: Same Story, Different Scale
The Micro E-mini (MES) contract is a smaller version of the E-mini (ES), designed for traders who want the same price exposure but with lower notional size.
Both track the same index, tick for tick.
For traders exploring this December setup, the MES allows participation while controlling exposure more granularly—especially useful if volatility picks up and margin requirements shift.
Key Contracts Specs and Margins:
E-mini S&P 500 Futures (ES) with a point value = $50 per point.
Micro E-mini S&P 500 Futures (MES) with a point value = $5 per point.
As of the current date, the margin requirements for E-mini S&P 500 Futures and for the Micro E-mini S&P 500 Futures are approximately $22,400 and $2,240 per contract respectively.
Always verify the latest margin schedules and specifications directly with your broker or the exchange before entering trades, as those details update regularly and depend on market conditions.
Santa’s Setup: Scenarios to Watch
Scenario A — Santa Delivers: Price tests or slightly breaks the 6,525.00 low, finds support near 6,239.5, and rebounds into late December. Bearish divergences resolve sideways, and risk assets stabilize.
Scenario B — The Grinch Arrives: The 6,239.50 zone fails to hold, breaking trendline supports. The market slides toward 4,430.50, shaking off complacent longs and erasing part of the 2024-5 rally.
Both paths are technically valid. The difference will come from whether AI-heavy sectors regain strength—or confirm that this bull leg has indeed lost its engine.
Educational Takeaway
Divergences (CCI and MACD) highlight when momentum and price disagree—a sign of fatigue.
Intermarket analysis (ES vs. NQ) reveals where weakness may originate.
UFO levels identify potential institutional footprints—where traps or reversals often occur.
Discipline and risk control matter more than predicting whether Santa shows up.
Final Thought
Whether December brings gifts or grief may depend less on seasonal hope and more on how traders interpret these divergences.
If AI stocks can find footing again, the rally could revive. But if they keep sliding, this might be the year Santa takes a break.
When charting futures, the data provided could be delayed. Traders working with the ticker symbols discussed in this idea may prefer to use CME Group real-time data plan on TradingView: www.tradingview.com - This consideration is particularly important for shorter-term traders, whereas it may be less critical for those focused on longer-term trading strategies.
General Disclaimer:
The trade ideas presented herein are solely for illustrative purposes forming a part of a case study intended to demonstrate key principles in risk management within the context of the specific market scenarios discussed. These ideas are not to be interpreted as investment recommendations or financial advice. They do not endorse or promote any specific trading strategies, financial products, or services. The information provided is based on data believed to be reliable; however, its accuracy or completeness cannot be guaranteed. Trading in financial markets involves risks, including the potential loss of principal. Each individual should conduct their own research and consult with professional financial advisors before making any investment decisions. The author or publisher of this content bears no responsibility for any actions taken based on the information provided or for any resultant financial or other losses.

ES UpdateSeems like there is an up channel, but it's so shallow, I might just take a few days off this week. Basically a really slow melt up.
I'm only going to post an update if I see something interesting. If you have any stocks or commodities you want me to plot. let me know. Not really seeing much right now.
Maybe I'll get lucky and find a stock to play like last week.
Buyers made an attemptBuyers in the daily chart of the S&P 500 made an attempt to push the market to new lies but it failed to hold onto those highs and backed off to lower prices by the close. The expectation is buyers will make another attempt towards the upside with an objective of 6881.

ES UpdateRTY MFI hit oversold so small caps went straight up today. Expecting the same when ES MFI hits oversold. Something to keep an eye on.

#ES_F Daily TF Longer Outlook UpdateBack in October we broke down Daily Outlook after we had topping signals and strong trend break. When that was posted we were looking to two possibilities after the trend was broken, we either needed to get back under Smaller MA without reaching the top to show no acceptance in New Range to then proceed with trend change and a slower correction or stay above Smaller MA to push for higher VAH/Edge areas to make this our range for some time and possibly balance between VAH/VAL with pushes out of them finding their way back in.
What ended up happening is we got a push back into MA but closed over it and more buying came in to push and gap us over VAH into Range Top, of course we had no way of knowing that Range Edge would be the top but we pushed into it and showed clear topping/rejection from it.
This time Edge Top rejection was much stronger and got us back under VAH/Smaller MA, flushed VAL with Medium MA which again provided Temp Support and as mentioned we got that balancing action between VAL / VAH with pushes out rotating back in until we broke/closed under Medium MA and got more selling which took us under Range Edge Low, flushed Previous Range VAH and Large MA but as that was first tag of big MA after spending quite some time away it naturally provided buying to get us back in New Range which we showed acceptance in by Previously Tagging the Top which meant once price is back in, it doesn't need much big buying as it just wants to rotate back towards Supply which so happens to be at/over VAH.
Where can we go from here ?
The flush under Edge Low temporarily changed Medium Trend into correction but the bounce didn't let us stay in correction and instead we go that rotation into Supply and are now technically again in Up Trend over MAs.
Yes we can stay in up trend and continue with sideways/strength/inside days that will keep us up Over/Around VAH while we let Smaller/Medium MAs catch up and continue pushing us towards Edge Top and maybe even push us into New Range Above.
But few things we have to consider... We are at the top of Big Big area (under new price level of 7000), We had a huge run this year, We have showed multiple Topping Patterns here around 6800 - 6900 +/- Areas, We have showed good trend breaks and attempts at trend change, We are back in area of Supply where bigger failures/sellers have came in, We are extended from Medium and Small MAs which provide support in New/Untested areas and this time we are extended away into Supply Area not New area.
With all that in mind will we have strong buyers who will come in here and start buying the extension inside Supply ? Or was this extension all momentum buyers who aren't planning to hold us up.
My current bias is if we look at Cost Basis break out area up to our Top, then the Flush to Large MA and back up, to me it looks like one side of a bigger M topping pattern which happens at bigger tops. If that is the case then either Friday or somewhere close we should be marking our Lower High and if buyers from Last Week will not hold this then price will want to head back towards some sort of Support which would be Smaller MA as the first spot which means back under VAH. Something to be careful of is that since now VIX is down, Volume will be down as well with holidays coming which means even if we start moving down it might be more of the same way we got up here last week which was more of Slower Balance(Back and Forth) Up days. Way down could be similar with slower balance down days.
From there Smaller MA and areas under it can Provide Support and keep us in some sort of sideways action around it BUT as long as we keep holding under VAH 860s - and under Edge Top 920s then that will mean Weakness, we would look for a move under VAH that can stay under it even if it consolidates around, then into Mean where Medium MA should be by the time we get there, of course it could happen fast as well but have this feeling that it might be a drag this time around IF it happens.
We already have a week of fresh Supply up here from Last Week and if we again get under Smaller MA and can again change trend under Medium MA then that will bring in more weakness to continue for lower targets back towards VAL which could also provide holds BUT if trend stays in correction and we are to follow through with the M pattern then we will eventually see a move back under Range Edge Low and aim to take out the low we made on the last Flush Nov 21st which would be the M middle which could give us more weakness to take us towards our Correction Areas lower into the Cost Basis. Again if market has topped out and all the large selling for now is done, if this is to happen then careful of forcing for it to happen quick as this can play out over a longer period of time as market may need a longer breather/correction/consolidation before it can start a new stronger trend again.
If we don't end up getting a correction under Medium MAs under VAL/Edge then staying over VAL can keep price in balance with us going back and forth in 6700 - 6900s areas for some time, to not have a correction or prevent price balance and see more strength price would need to let some MAs catch up and push us over Previous High AND be able to stay above it, until then we will be looking at either more Balance or Balance with Weakness which can give us a correction.
