FED Rate Cuts Aren’t the Blessing You Think — History Proves ItIn this video I ll take you thru historical macro events and we will see how it all rhymes with current markets conditions.
Here is link to my initial article with the data
Remember: Macro takes time to play and price can be going for months before the crash happens watch charts Im mentioning and whole picture will starts to show to you.
Stay safe and protect your wealth and family. Next 5 years of the 4th Turning can be violent not only on the markets.
David Perk
ESM2022 trade ideas

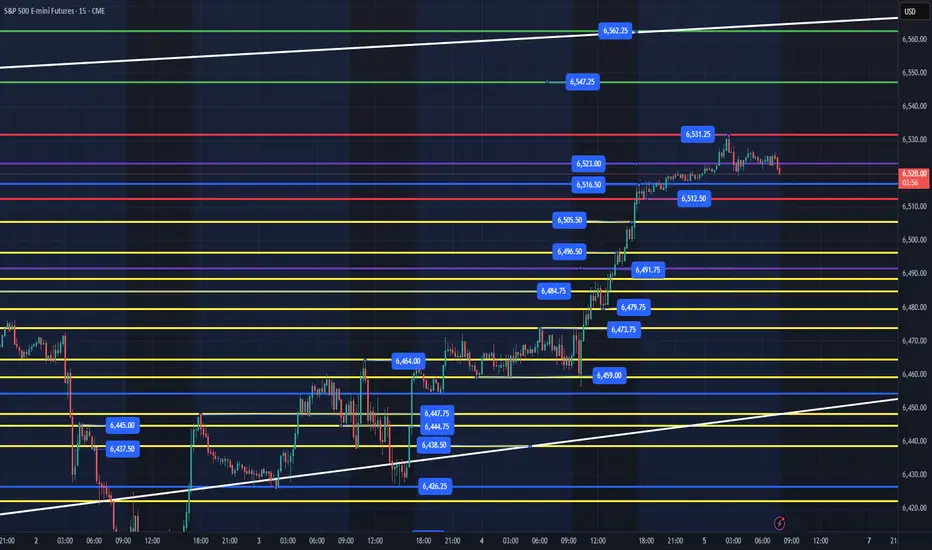
ES - September 5th - Daily Trade PlanSeptember 5th - 7:55am
Last night session I stated - "My lean is we grind sideways and up into the 6523 level overnight and then we will need to wait for the employment report and NYSE to try and get some level losses and reclaims to finish the week at our targets of 6547, 6563+."
Our overnight session has been rangebound between 6512 - 6531. Employment report and NYSE open will determine which direction we move. I will be waiting for price to settle down after initial reactions and look for the best levels that I will be looking for a flush and reclaim would be the 6491 level as it was the high of this week during the Sunday evening session. We could dip down to 6473/79 levels and then rally.
I will update around after employment report and around 10am.
-------------------------------------------------------------------------------------------------------------------
Couple of things about how I color code my levels.
1. Purple shows the weekly High/Low
2. Red shows the current overnight session High/Low (New chart out in am)
3. Blue shows the previous day's session High/Low
4. Yellow Levels are levels that show support and resistance levels of interest.
5. White shows the trendline from the August lows.
ES - September 9th - Daily Trade PlanSeptember 9th - 5:45am EST - Daily Trade Plan
Yesterday, I did not make a trade. I was waiting on price to flush a lower level and all we got in the afternoon was the 6493 level that was the 2am low and produced a low-quality setup based on my edge. When we are trading in such narrow ranges, it can be difficult to not get chopped around and my edge is focused on flushing high quality levels, reclaim and then enter after and ride up with the institutions. You can see that Institutions were buying yesterday and holding the 6493 level all day. I stated in my updated note at 11am - "Price broke above the overnight high and is testing the 6517 resistance." (We never got a back test that I could enter long) Any pullback needs to hold the 6508 level." Price didn't hold but also didn't flush lower than 6493.
I only mention this because this is what patient, disciplined trading looks like. FOMO is what will end your trading career. Do I want to trade and make money each day? Of course, but I have to be disciplined to wait for the best entries and not gamble all day long.
Now onto today! The overnight low was 6504 and high is 6523. We have been grinding higher since the Friday low. Any pullback will be health for this structure to continue higher. It cannot keep grinding higher and I am anticipating a pull back to keep us moving up the levels. Which levels should we be looking to engage in?
Key Support Levels - 6504-08, 6493, 6480, 6474, 6464, 6453 - Below Friday's low, I would wait for a level below to build a base around and reclaim.
Key Resistance Levels - 6517, 6523, 6531, 6542
The overnight low of 6504 is first level down to flush and recover and grab some points. Since the 6493 level has tested 3x yesterday, I don't think we will have much left in the tank, and I would expect price to flush a couple of levels. Waiting on 6493 to be reclaimed is the safest spot to enter. Everything between 6506-6516 is pure chop and will fake you out both directions. Be patient and wait for a flush of a level in red or blue and then the reclaim of that immediate level.
I will post an update around 10am EST.

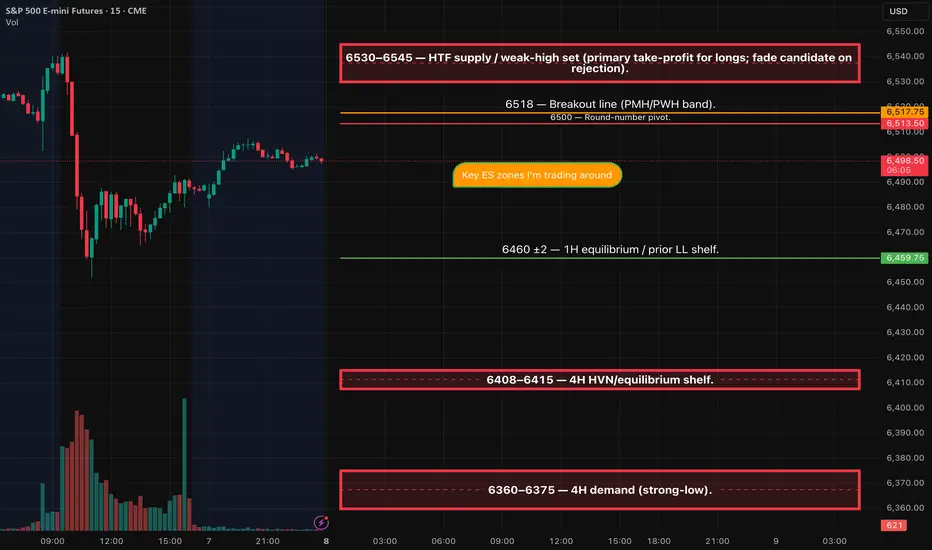
ES (SPX) Weekly: Levels & Setups - Sep 8-12, 2025Price is camped under a higher-timeframe supply/“weak-high” band. Trend remains constructive on the Weekly/Daily, but 4H/1H are coiling beneath resistance. I’m neutral into mid-week inflation data and will only engage on clean acceptance above the prior-high band or a rejection back into range.
Event stance: Two inflation releases hit 08:30 ET mid-week. I’ll be flat into the prints and wait for the first qualifying 15-minute close before arming anything
Key ES zones I’m trading around
6530–6545 — HTF supply / weak-high packet (primary take-profit for longs; fade candidate on rejection)
6518 — Breakout line (PMH/PWH band)
6500 — Round-number pivot
6460 ±2 — 1H equilibrium / prior LL shelf
6408–6415 — 4H HVN / equilibrium shelf
6360–6375 — 4H demand (strong-low)
Setup 1 — Breakout-Acceptance LONG
Trigger: 15m close > 6518, then two 5m bodies hold above.
Entry: 6520.5–6523.0 on the retest or break of bar-2 high.
Stop: tighter of (i) below the 15m trigger candle low, or (ii) below the last confirmed 5m swing; cap ≤ 6–8 pts.
• If neither option fits ≤ 8 pts from your fill, pass and wait for a cleaner micro HL.
TP1 (dynamic): first hard band (e.g., any workable print inside 6530–6545) that yields ≥ max(15, 2.5×SL) from your fill (front-run 0.25–0.5 pt if 2.5R is tight).
TP2/TP3: 6550, then 6570; trail by 15m/30m closes.
• Disqualifiers: any 5m body back ≤ 6518 before TP1; visible liquidity wall ≤ 5 pts beyond trigger; news window.
Setup 2 — SRR Rejection SHORT (Sweep → Recapture → Reversal)
Trigger: Sweep 6518–6530, fail, then 15m bearish close < 6518.
Entry: 6515.0–6518.0 on the retest from below.
Stop: tighter of (i) above the 15m trigger candle high, or (ii) above the last confirmed 5m LH; cap ≤ 6–8 pts.
• I f the correct structural stop is > 8 pts from your fill, skip until a micro LH tightens risk.
TP1 (dynamic): first hard band below that gives ≥ max(15, 2.5×SL) from your fill—usually 6500; if 2.5R isn’t met to 6500, promote to 6482, then 6460.
TP2/TP3: 6482, then 6460 (extend toward 6410 if momentum).
• Disqualifiers: no 15m bearish confirmation; any 5m body ≥ 6518–6522 after entry (use your exact line); news window.
Day 24 — Trading Only S&P Futures | +$264 Overnight WinWelcome to Day 24 of Trading Only S&P Futures!
Today was all about patience and levels. I noticed the market had already made a huge move yesterday, so I bet it couldn’t push much further overnight. I shorted at 6525 and woke up to a $250+ profit by market open.
That was enough for me — the plan worked perfectly, so I stayed mostly on the sidelines for the rest of the day. Both our overnight level and yesterday’s level played out exactly as expected, which made this a clean session.
Closed the day at +264.83.
📰 News Highlights
U.S. ADDS FEWER-THAN-EXPECTED 22,000 JOBS IN AUGUST, BOOSTING ODDS OF 50BPS CUT
🔑 Key Levels for Tomorrow
Above 6470 = Remain Bullish
Below 6450 = Flip Bearish

Day 26 — Trading Only S&P Futures | BLS Revision TradeToday’s session lined up perfectly with the news. I came in prepared, knowing the BLS jobs revision was coming, and expected the number to print bigger than forecast.
As the market opened, structure flipped bearish and we started trending down. I shorted resistance levels and traded the 1-min MOB for easy profits once the data came out — which confirmed the trade idea. Ended the day with +300.02.
📰 News Highlights
US 2025 BLS Payrolls revision: -911K jobs, biggest downward revision on record
🔑 Key Levels for Tomorrow
Above 6480 = Remain Bullish
Below 6465 = Flip Bearish
This is also one of the first weeks i am testing copytrading apps that allow me to trade 5-10 accounts at once and it just follows the first account.
But I set my other accounts with bigger drawdowns to trade 3x the leader account test test how things work and i have 1 account that locks out after $150s because based on my study, if i lock out after $150, i will have a high success rate for the month.
All of this is only possible after i tested run myself and my strategy where I am trading like a turtle and making sure I can trade for a full month with 70% + win rate and achieve consistency without blowing up the account.
Once that was achieve, I can use any copy trading app to multiple my $200/day trades into 1000 by having all my other account follow my leader account.
But don't rush to do this until you are successful.
Remember to WALK, before you run.

ES - September 5th - Daily Trade Plan - Evening SessionSeptember 4th - 7:15pm
In today's daily trade plan, I said - "Ideally, we lose 6454, flush and reclaim for a move higher. I expect another choppy day, and we need to clear 6491 to keep this rally moving higher."
At 10:16am price dropped down to 6456.25 and took off higher. You can look at a 4hr chart and see the institutional accumulation that has been happening. You can look at my weekly trading plan in which I stated -
"I do believe we can still rally up to 6547, 6563+ this week, but IF, we lose the 6369 level, that would be a big blow to bulls, and it would need to be sharp reclaim back inside the white trendline to keep momentum."
What did institutions do so far this week? Flush the white trendline, run stops, accumulate and we are heading higher. 6523 is the next big resistance with 6547, 6563 still in play. Price needs to hold 6473 with 6455 being the lowest for us to keep moving higher. Employment report out tomorrow am and usually the initial move will be a fake out. I don't trade prior to the employment report and usually wait until after the NYSE open to evaluate and find a spot to get some points. Since we have closed at highs on the day and we are just going sideways, the best levels that I will be looking for a flush and reclaim would be the 6491 level as it was the high of this week during the Sunday evening session. We could dip down to 6473/79 levels and then rally.
My lean is we grind sideways and up into the 6523 level overnight and then we will need to wait for the employment report and NYSE to try and get some level losses and reclaims to finish the week at our targets of 6547, 6563+.
I will post an updated chart tomorrow before 7am EST.
---------------------------------------------------------------------------------------------------------
Couple of things about how I color code my levels.
1. Purple shows the weekly High/Low
2. Red shows the current overnight session High/Low (New chart out in am)
3. Blue shows the previous day's session High/Low
4. Yellow Levels are levels that show support and resistance levels of interest.
5. White shows the trendline from the August lows.
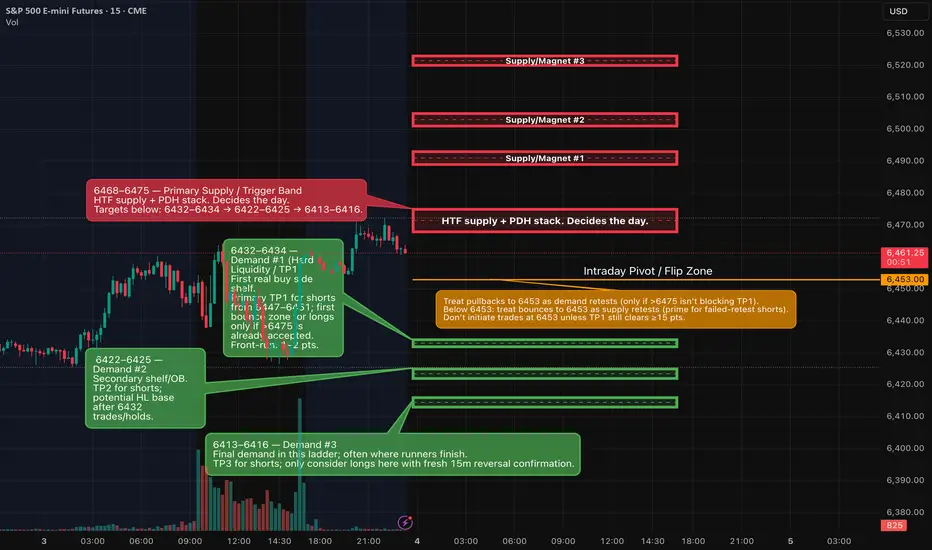
ES (A++) — Intraday Analyses & Setups for Thu, Sep 4, 2025 (ET)We’re parked beneath a well-defined 6468–6475 ceiling. Tomorrow the clean A++ is either: (A) Breakout-acceptance long > 6475 (retest holds), or (B) Rejection short after a test of 6468–6475 that sends price back through 6453 with 15-minute bearish confirmation. TP ladders are mapped to ~6490 / 6501 / 6520 above and ~6432 / 6422 / 6413 below. Trigger-Lock is ON: numbers are frozen once posted.
Weekly/Daily: Pressing prior distribution highs; repeated supply above ~6470–6485; upside extensions show 1.618 ≈ 6489 and 2.000 ≈ 6504 as next magnets.
4H/1H: Recovery from the 6.43k shelf, printing HLs into the ceiling; momentum constructive but unresolved under 6475.
30m/15m: Rangebound day resolved late; resistance band 6468–6475 capped advances; 6453 (Monday Low pivot) is your intraday toggle.
Hard levels to respect
• Ceiling / Trigger band: 6468–6475
• Pivot: 6453 (lose/reclaim toggles bias)
• First downside shelves: 6432–6434, 6422–6425, 6413–6416
• Upside magnets if accepted: 6489–6493, 6501–6505, 6520–6523
A++ Setups
1) Breakout-Acceptance LONG
• Trigger: First 5-minute close > 6475, then a quick retest that holds 6472–6475 (no reclaim < 6470).
• Entry: 6472–6479 on the hold.
• Initial SL: 6466–6468 (≤ 6–8 pts).
• TP1: 6490–6493 (≥ +15 from 6475 → 2.5R with 6-pt risk).
• TP2: 6501–6505
• TP3: 6520–6523
Invalidation: Any 15m close back inside 6468–6475 after acceptance.
2) Rejection-Failure SHORT
• Precondition: Price tests 6468–6475 and rejects.
• Confirm: 15m bearish close < 6466, then a 5m failed retest 6447–6451 (lower high).
• Entry: 6447–6451 on the failed retest.
• Initial SL: 6454–6456 (≤ 6–8 pts).
• TP1: 6432–6434 (≥ +15 from 6449).
• TP2: 6422–6425
• TP3: 6413–6416
Flip: Any 30m acceptance > 6475 cancels shorts and re-arms the long.
Tomorrow’s U.S. calendar (key times, ET)
• ADP National Employment Report: 8:15 am. 
• Initial Jobless Claims: 8:30 am (weekly, DOL). 
• S&P Global U.S. Services PMI (final): 9:45 am (standard PMI schedule). 
• ISM Services PMI: 10:00 am (third business day rule → Sep 4). 
• EIA Weekly Petroleum Status (holiday schedule): 12:00 pm ET (Labor Day shift). 
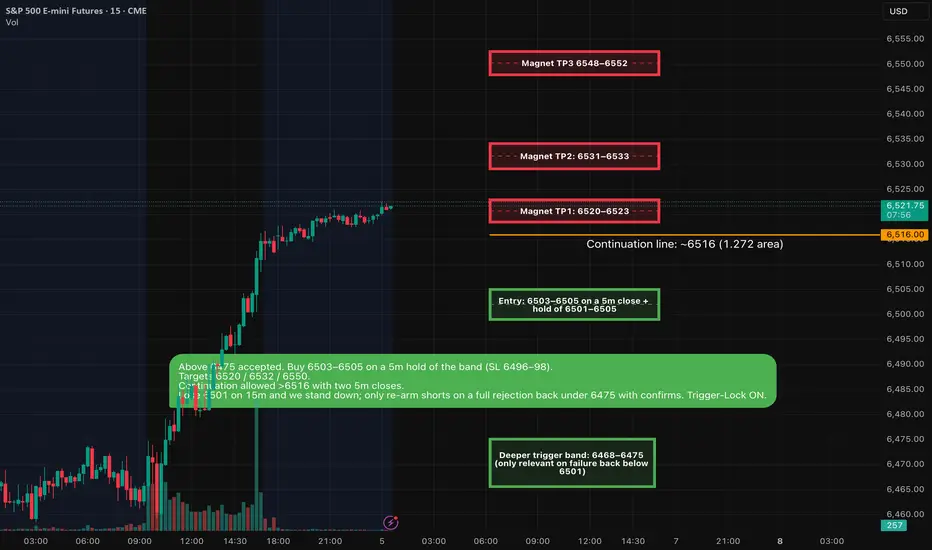
ES — Intraday Analyses & A++ Setups (Fri Sep 5, 2025) • Demand (reclaim): 6501–6505 — now support; Trigger-Lock ON
• Continuation line: ~6516 (1.272 area)
• Upside magnets: 6520–6523, 6531–6533, 6548–6552
• Deeper trigger band: 6468–6475 (only relevant on failure back below 6501)
A++ Long Setup
Retest-Hold LONG
• Entry: 6503–6505 on a 5m close + hold of 6501–6505
• SL: 6496–6498 (≤ 6–8 pts)
• TP1: 6520–6523
• TP2: 6531–6533
• TP3: 6548–6552
Invalidation: Any 15m close < 6501 after acceptance.
Failure / Flip path
• If 6501–6505 fails on a 15m close, expect a deeper probe toward 6475.
• Shorts are not active unless we get the full sequence: rejection of 6468–6475 → 15m bearish < 6466 → 5m failed retest 6447–6451 (then use 6432/6422/6413 TP ladder).
Its Non-Farm: How much will ES Move?Hi all - Happy Non-Farm Friday!
I haven't done this in a while and thought it might be helpful to share my process for estimating the size of the move that we may get on ES after the Non-Farm Payrolls data is released.
I'm not trying to make a prediction on direction here - but more understand where the boundaries could be so I can determine how to trade this (what trading tool I can pull out of my box) once the announcement comes out.
Hope it helps and please let me know if you find it useful and I'll create more posts .
Cheers,
Jeff

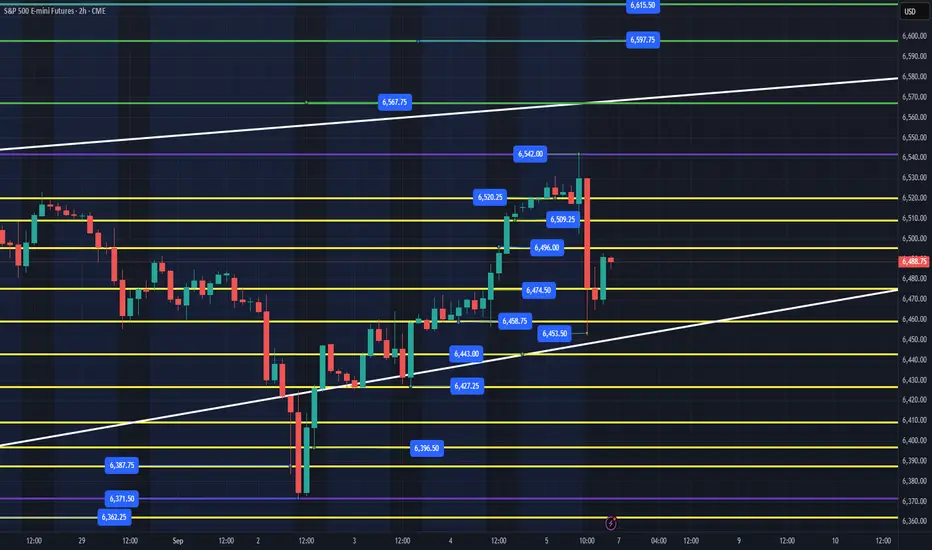
ES - Weekly Trading Plan - September 8th-12thSeptember 7th - 11:40am EST - Weekly Post
Recap of last week's plan - I stated on Saturday August 30th - "I do believe we can still rally up to 6547, 6563+ this week, but IF, we lose the 6369 level, that would be a big blow to bulls, and it would need to be sharp reclaim back inside the white trendline to keep momentum." (See Related Publications section)
We had a low volume Labor Day holiday, but when institutions came back on Tuesday around 10am EST we set the weekly low at 6371.75, reclaimed the white trend line and we climbed all week into our first target of 6547 and made a high of the week of 6542 on Friday and sold off.
(I post a more detailed daily plan - follow me so you don't miss my daily updates).
-----------------------------------------------------------------------------------------------------------------
What is the plan for this week? Remember, Institutions hunt for levels to run stops and then take that level higher or lower. You can review my daily trade plan from Friday and see that I was anticipating a potential sell off after the open. Retail traders were bullish, got caught offsides, Institutions start to sell, all the retail long stops got taken out and Institutions stepped in on Friday afternoon and flushed Thursday's low of 6458 while everyone thought we were going much lower, created a short squeeze and we ended Friday around the 6490 level.
Our weekly low was 6371.75 with a high of 6542 put in on Friday. The white trend line continues to be sold below and then taken higher. I anticipate trapping this week as we look towards the FOMC on 17th and Quarterly Window Dressing by Institutions with the following economic events this week:
Wednesday - September 10th - PPI
Thursday - September 11th - CPI
We have to stay bullish until proven otherwise, last week 6369 was the key level to hold and we did. This week 6410-6425 really needs to hold. I could see us pulling back into the 6425-6435 zone, trapping and moving us higher. The first big level I will be looking for a flush and reclaim is 6453-6458 area, that was last Thursday and Friday's levels. Since we have produced some nice rallies from this area, we could bounce, flush down to 6430-35, catch everyone offsides and then rally higher. (I will go into more detail on Monday Daily Trade Plan)
Key Support Levels - 6370, 6427, 6443, 6453-58
Key Resistance Levels - 6496, 6507-09, 6520, 6542
Target Levels for Week - 6567, IF, price wants it we could go higher to 6597, 6615 but those are not my main targets for the week as the white trendline around 6567 should be a strong resistance.
We could see a similar cycle to last week, drop Monday down to one of the key support levels, flush and take us higher to the white trendline (6567) area and then sell of Friday like we did this week.
Follow to read my daily trade plan - I will send out tonight's Sunday Session Open Trade Plan by 5pm EST.
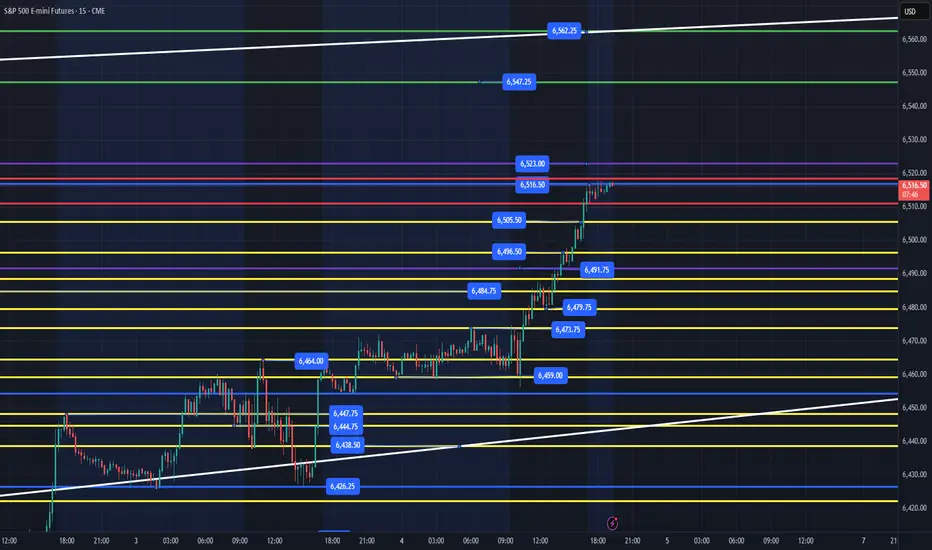
ES - September 3rd - Daily Trade Plan - UpdateSeptember 3rd - 7:25am EST
I wanted to provide an update on today's levels and what has transpired overnight. Price opened around 6448 and grinded down into the white trendline support. This trendline you can also see on the weekly chart (See Related Publications) and yesterday when we dropped below it, we then retested it at 6423 level, tested again in the afternoon to 6426, and we have then back tested it this evening down to 6426 and rallied from there, broke above the overnight high of 6448 and have come into resistance at 6460.
Couple of things about how I color code my levels.
1. Purple shows the weekly High/Low
2. Red shows the current overnight session High/Low
3. Zoom out on a 4hr, 6hr, chart and you will see a trendline from August 22 Low at 6364 which started the massive move to 6496. It is also the same trendline connecting the August 1st low that rallied to 6508. Both levels created rallies that lasted for 200+ pts. That does not mean we will see another rally like that, unless we can reclaim the weekly high of 6491 and then take it level to level from there.
Our first support down is the 6448 level. A flush and reclaim of this level, should take us higher. Each level in yellow are areas that price could flush, recover and climb level to level. My edge as a trader is to try and take 10pts+ out of the market and generally I am looking to do that by flushing a high-quality level, recover and ride it to the next level.
Immediate Resistances - 6460, 6472, 6476, 6485
Immediate Supports - 6448, 6437, 6426, 6412
Ideally, we need to hold the 6426 level or flush and reclaim quickly. IF, price can't rally above 6476, my lean is we are in the midst of a change in character of price, and I will be looking lower for levels to flush and reclaim.
I will send out an update around 10am.
ES - September 10th - Daily Trade Plan September 10th - 5:45am EST -
Volatility should arrive with PPI & CPI today and tomorrow. I will not go into too much detail about my trade plan yesterday as you can read it under the (Related Publication Section). A couple of highlights, 6493 & 6505-08 have been 2 key levels so far this week. Why? Institutions have been buying at these levels and price has kept moving higher. As you know by now, my edge is buying after the Institutions and riding the wave higher. I do NOT short ES as I wait for short squeezes as a safer way to enter and ride the waves up in bull/bear markets. The past couple of days have been pretty boring price action. We have chopped retail investors up all week as price has ping ponged back and forth between my levels, but more importantly between 6493-6523. We finally broke out overnight and hit our first target of the week, which was also last week's high at 6544.
What is the plan for today? 8:30am, we have a big data report. I will not be trading before the report and will be waiting on price to settle out after the NYSE open. That is one of my rules on data & volatility events.
Overnight low was 6526 with the high being 6544. We have to remain bullish until proven otherwise, so the targets in green above are still in play this week. How do we get to those targets? Ideally, we get a big flush, scare retail traders, let them pile in short, flip the script, short squeeze and ride higher. If you have been trading ES for any length of time you know that if price is flushing, you get out the way. Do not be a hero and try to pick when price will reverse. Identify levels that have high probabilities, watch the reaction at that level, then enter based on your edge.
Key Support Levels - 6530, 6526, 6523, 6517, 6504-08, 6490
Key Resistance Levels - 6544, 6549, 6555, 6562, 6578+
The white trend line is the magnet above that I believe we are heading for at some point this week or into the Fed meeting next week.
After the PPI release and by 9am, we should have a good sense for what price is looking to do. Any flush of 6526 and reclaim should be a good level for a move higher. We could see price sell off all the way down to the white trend line around 6474 area, flush and then recover a level in blue to continue higher.
IF, price does flush 6490 and we are accelerating into it, I would be patient and wait to see what it does. While yesterday we flushed, recovered for a nice 50 point move higher, we might get a nice bounce, but liquidity continues to be taken each time we visit this level and when we do lose the level, I anticipate a multi-level loss.
IF, price can flush and reclaim the red or blue levels, those are always my highest quality spots I am looking to ride higher. The yellow levels are very important support and resistance levels that you can get reclaims of and move higher. They can also be choppy and harder to enter without a short time frame edge for entry. It is all based on your strategy, goals and edge of getting points from ES.
Size down today, price could lose 100+pts or run 100+pts higher. Do not be a hero. Wait for your levels and edge to enter and make sure you take profits at the next level higher.
I will post updates after PPI and around 10am after NYSE has settled out.
-----------------------------------------------------------------------------------------------------------------
Couple of things about how I color code my levels.
1. Purple shows the weekly High/Low
2. Red shows the current overnight session High/Low (time of post)
3. Blue shows the previous day's session Low (also other previous day's lows)
4. Yellow Levels are levels that show support and resistance levels of interest.
5. White shows the trendline from the August lows.

ES - September 8th - Daily Trade PlanSeptember 8th - 8:50am - Update
In my post last night I stated, " Tonight's evening session, I think we can continue to build a base and work higher above the immediate 6492 resistance to 6505-6510 area. I could see us then setting up for a leg lower to flush the 6452 level (Friday's Low) maybe even get below the white trend line to the 6444, 6438 levels and then reclaim the 6452 level. IF not we might need to flush down to 6426 or just under and then reclaim that level to keep price moving higher."
The overnight low was 6479.50 and high is 6508. We have immediate support at 6493.50. While price can rally from here and we have tested the 6508 level 3x so far overnight. I think it needs a pull back to clear the 6508 resistance and overnight high. IF, price can flush 6592 (maybe down to 6488-90) then reclaim and rally, we could retest the 6508 resistances. Ideally, we flush the overnight low (6479.50) and use that level to reclaim and move higher.
IF, price is selling off pretty good and can't reclaim the overnight session low, the 6464, 6452 are key levels I will wait for a reaction, reclaim, and then follow up the levels.
Key Support Levels - 6493, 6479, 6464, 6453 - Below Friday's low, I would wait for a level below to build a base around and reclaim.
Key Resistance Levels - 6508, 6517, 6531, 6542
Since the 6508 level has tested 3x, IF, it does break out the back test of that level, should provide a good entry.
I will see how price is acting in the first 30 mins and will provide an update.

ES Futures Long Setup! Ride the Bullish Momentum!
🚀 **ES Futures Long Setup! Ride the Bullish Momentum!** 🚀
📊 **TRADE IDEA – E-mini S\&P 500 (ES)**
**💡 Direction:** LONG
**🎯 Entry Price:** 6489.75 (Market Open)
**🛑 Stop Loss:** 6440.60 (ATR-based, \~49 pts)
**📈 Take Profit:** 6588.06 (2:1 R\:R)
**📏 Position Size:** 1 contract (scale per risk tolerance)
**💪 Confidence:** 62%
**🔥 Trade Rationale:**
* Price above 10/20/50/200 SMAs & EMA9/21 → bullish alignment ✅
* ATR-aware stop protects against volatility ⚡
* Reward-to-risk ratio 2:1 for controlled upside 💹
* Cautiously bullish: MACD short-term mixed, but overall trend supports a long
**⚠️ Key Risks:**
* Negative MACD histogram → possible short-term pullback
* ATR high → dollar risk per contract larger
* Price near 20-day high → monitor for resistance
* Economic data releases can increase volatility
**📌 Execution Notes:**
* Enter at market open at 6489.75
* ATR-based stop below 6440.6
* Target 6588.06, consider scaling out or partial profit taking
💥 **Don’t miss this ES long trade with defined risk & high upside potential!**

Day 23 — Trading Only S&P Futures | +$200 & New Daily RuleWelcome to Day 23 of Trading Only S&P Futures!
I locked in +200.45 on my competition account by shorting the MOB overnight and walking away once my target was hit. Later in the day, I came back to watch and ended up losing on other accounts — which sparked an important realization.
From now on, I’m considering a rule: cap daily gains at 10% of account balance.
For example, with a $2,000 account, my daily target should be $200 max. Anything more means overtrading, staying in the market too long, and risking unnecessary drawdowns.
This might be the structure I need to keep consistent results.
📰 News Highlights
U.S. JOB CUTS TOTAL 85,979 IN AUGUST, HIGHEST FOR THAT MONTH SINCE 2020 — CHALLENGER
🔑 Key Levels for Tomorrow
Above 6470 = Remain Bullish
Below 6450 = Flip Bearish

Stock Index: The AI Bubble That Will Burst!ES
S&P 500 futures finishes up 0.23% as economic slowdown worries cloud rate-cut optimism. From a technical perspective, this week marks the third consecutive where ES has been trading inside of 11 Aug 25 bullish spinning top candle indicating weakness of bulls after reaching uncharted territory of $6,541.75 all-time highs.
Such signs point to a short-term retracement down into discount arrays but I am not here trying to guess the top. If it does occur, $6,355.00 is an area of interest but on an overall basis, I want to be neutral until Sunday’s opening price / opening gap.
NQ
Nasdaq follows with a 0.93% gain but with the same issue of price trading within a range, in this case, since the 4th Aug 25 weekly bullish marabozu was printed, I would not want to put my money on a continued run as of yet. Preeing short-term retracements with a discount array @ $22,781.75 is being watched closely and for the time being, I want to be neutral
YM
Dow Jones closes -0.37% lower this week with the intermediate highs of $45,887 still in tact. Will the monthly buyside liquidity pool be used to suck in unexpected bull traders before repricing to HTF discount arrays?
If I am to see a decline in the 3 stock index pairs, YM will be the pair to lookout for as the front-running market.

ES - September 8th - Daily Trade Plan - Evening SessionSeptember 7th - 5:50pm - Evening Update
Before you read my plan for September 8th. Please read my Weekly Trade Plan that is found in the related publication section. Those are the key levels that are very important from a big picture. On the daily trade plan, I want to drill into a 15 min time frame to show you the levels from the micro perspective. You can also read the Friday - September 5th plan for further details into what we were looking for. Friday sold off to Thursday's low, recovered and rallied into the late afternoon.
Tonight's evening session, I think we can continue to build a base and work higher above the immediate 6492 resistance to 6505-6510 area. I could see us then setting up for a leg lower to flush the 6452 level (Friday's Low) maybe even get below the white trend line to the 6444, 6438 levels and then reclaim the 6452 level. IF, not we might need to flush down to 6426 or just under and then reclaim that level to keep price moving higher.
Key Support Levels - 6453-58, 6443, 6427, 6370
Key Resistance Levels - 6492-96, 6507-09, 6520, 6542
I will post an update by 6am EST with an update based on the overnight session. We are in a weird spot here and ideally flushing Fridays low and reclaim would be high quality. Everything is level to level reclaims.
Couple of things about how I color code my levels.
1. Purple shows the weekly High/Low
2. Red shows the current overnight session High/Low (New chart out in am)
3. Blue shows the previous day's session Low
4. Yellow Levels are levels that show support and resistance levels of interest.
5. White shows the trendline from the August lows.

S&P500: Short-Term Pullback Before Next RallyS&P futures initially slipped yesterday but managed to stabilize soon. Our primary outlook is that the ongoing turquoise wave B will continue to move higher, likely topping out just below resistance at 6,675 points. After that, we expect wave C to drive the index directly into the magenta long Target Zone between 6,082 and 5,650 points, where the low of the wave (4) correction should be established. From there, the impulsive wave (5) is expected to begin, pushing the index above the 6,675 points resistance and completing the broader blue wave (III). Alternatively, there is a 35% chance that the index could break out directly above 6,675 points without first reaching the magenta Target Zone. In this scenario, the index would already be forming the alternative wave alt.(5) in magenta.

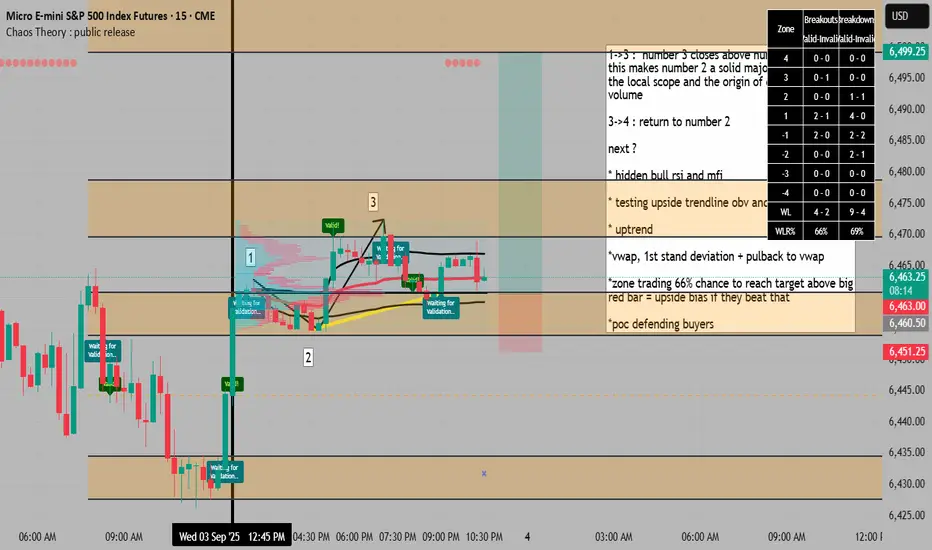
return to proven buyers might be the continuation of trend1->3 : number 3 closes above number 1 ,
this makes number 2 a solid major low in
the local scope and the origin of dominant
volume
3->4 : return to number 2
next ?
* hidden bull rsi and mfi
* testing upside trendline obv and small breaks
* uptrend
*vwap, 1st stand deviation + pulback to vwap
*zone trading 66% chance to reach target above big
red bar = upside bias if they beat that
*poc defending buyers
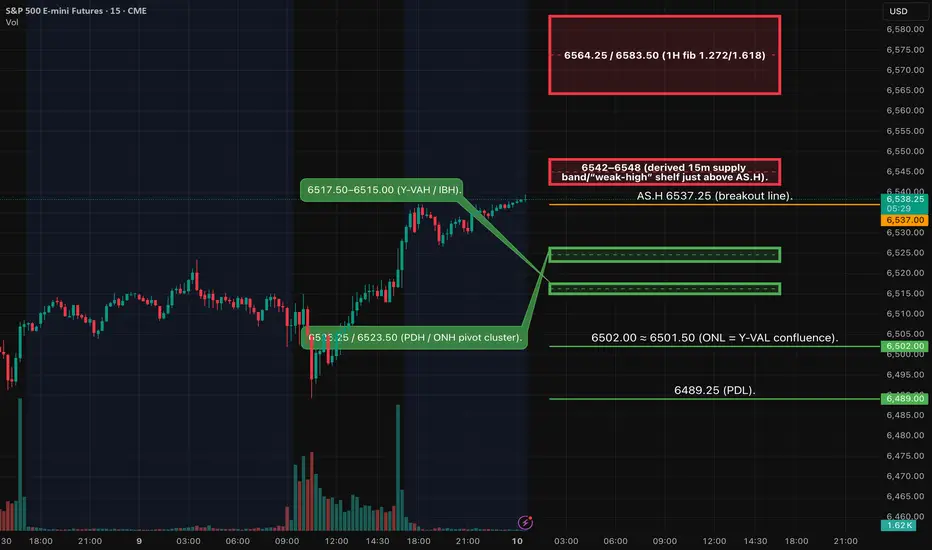
ES1! — Analyses (Sep 10) - Key Zones SeyupsHTF remains bullish into a labeled weak‑high cluster. Tomorrow’s path likely pivots around 6523–6527 (ONH/PDH cluster). Two A++ plays only after event‑led volatility prints structure:
Two possibilities:
Continuation LONG on acceptance > 6537 → 6564/6583.
Fade SHORT on sweep into 6542–6548 + 5m and 15m bearish confirmation → 6526/6510/6502.
SMT check with NQ is required.
Continuation LONG (A++) — “Acceptance > 6537”
Sweep → 5m MSS up → 5m close above 6537 → retest 6531–6533 (derived 5m OB/FVG at prior close shelf) for entry.
Entry: 6532 ±1.
SL: 6524 (structure; back inside PDH/ONH cluster).
• TP1: 6564.25 (1H 1.272) → ~+32.3 pts ≈ 4.0R.
• TP2: 6583.50 (1H 1.618) → ~+51.5 pts ≈ 6.4R.
• TP3: 6668+ (4H fib region) — runner; trail by 15m/30m closes.
Management: Scale ½ at TP1; move to BE only after a 5m close through TP1 or new structure; time‑stop 45–60 min if no progress in a kill zone.
Fade SHORT (A++) — “Sweep 6542–6548”
This is counter‑HTF; require 5m MSS down + 15m bearish close before entry (your rule).
Entry: 6545 ±2 after confirmations.
SL: 6552 (above sweep high/5m OB).
• TP1: 6526.25 (PDH/ONH) → ~19 pts ≈ 2.7R.
• TP2: 6510 (derived 15m demand near VWAP band) → ~35 pts ≈ 5.0R.
• TP3: 6502 (ONL=VAL) → ~43 pts ≈ 6.1R.
• TP4: 6489.25 (PDL) → ~56 pts ≈ 8.0R.
Management: Scale ½ at TP1; move to BE only after a 5m close < 6526 and fresh LTF structure; trail above last 5m swing/VWAP.
Fundamentals (tomorrow — Eastern Time)
• 08:30 — PPI (Aug). BLS schedule confirms Sep 10 @ 08:30.
• 10:30 — EIA Weekly Petroleum Status (energy vol shock risk). Standard release Wednesdays 10:30; PDF posts after 1:00 pm.
• 13:00 — UST 10‑yr (reopening). Treasury’s tentative auction schedule shows Wed Sep 10; competitive close customarily 1:00 pm ET.
• Heads‑up (Thu): 08:30 — CPI (Aug) next day.
• FOMC next week: Sep 16–17.
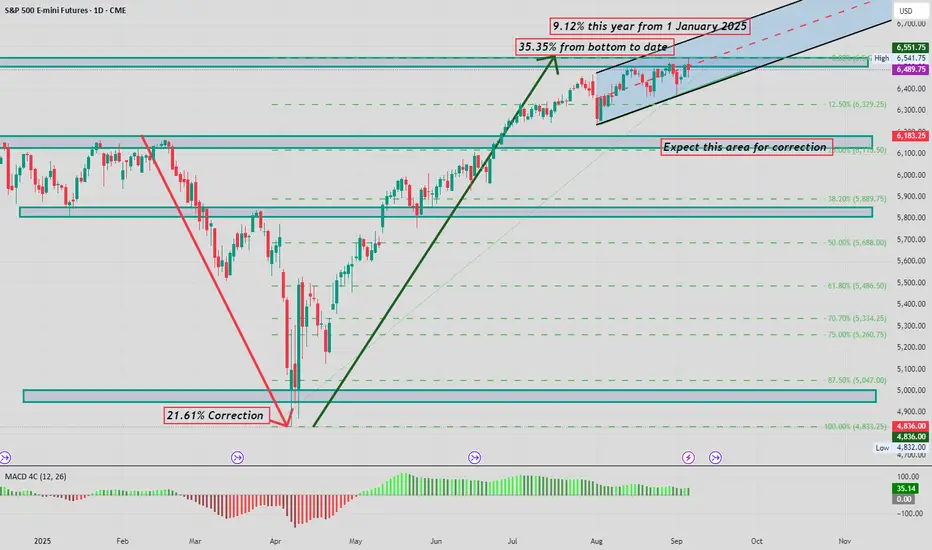
S&P moves this year and potential correction target i Have mapped out the moves we have had this year and show key areas and a potential correction pullback area.
ES - September 4th - Daily Trade PlanSeptember 4th - 6:45am EST
In yesterday's post I said "Ideally, we need to hold the 6426 level or flush and reclaim quickly. IF, price can't rally above 6476, my lean is we are in the midst of a change in character of price, and I will be looking lower for levels to flush and reclaim."
We chopped around all day and ended up breaking below the white trend line to 6426, got bought up and then rallied at end of day. Institutions bought it up and we ended up close to the highs of the day.
Couple of things about how I color code my levels.
1. Purple shows the weekly High/Low
2. Red shows the current overnight session High/Low
3. Blue shows the previous day's session High/Low
4. Yellow Levels are levels that show support and resistance levels of interest.
5. White shows the trendline from the August lows.
What is the game plan for today?
Overnight the low was 6454 with us coming into session highs at 6473.75. Ideally, we can flush 6454 and reclaim for a level to level move higher. IF, price sells off below 6454, we will probably need to head back down to the white trendline which is the 6438 level. 6438-6454 will be a chop fest.
Immediate Resistances - 6473, 6476, 6485, 6491 (Weekly High)
Immediate Supports - 6458, 6454, 6438, 6426, 6412
Ideally, we lose 6454, flush and reclaim for a move higher. I expect another choppy day, and we need to clear 6491 to keep this rally moving higher. We also have employment report out tomorrow am. My lean is we keep chopping up today as we head into the report at 8:30am tomorrow.
