ES - September 30th - Daily Trade PlanSeptember 30th - 6:15am EST
*Before reading this trade plan, IF, you did not read yesterdays, or the Weekly Trade Plan take the time to read it first! (You can see both posts in the related publication section) *
If my posts provide quality information that has helped you with your trading journey. Feel free to boost it for others to find and learn, also!
My daily trade plan and real-time notes that I post are intended for myself to easily be able to go back and review my plan and how I did from an execution perspective.
--------------------------------------------------------------------------------------------------------------------
Yesterday, we had a couple of opportunities at key levels to grab some points. You can look back at my notes that I post in real-time to review and see what transpired. Here are a couple of highlights.
"First level we are looking to defend will be 6715-6718. Any flush below and reclaim of 6725 should give us another attempt at clearing 6730-32 level.
Ideally, we can get a flush down to 6697-6700, reclaim 6705 and then long back up the levels.
IF, price loses 6684, we will need to look for flush and reclaims to get us moving back up the levels. I do not anticipate a loss of 6684 today as we close out end of month tomorrow."
We never lost 6684, yesterday, with our low being 6697.
8:50am - Update
"You can see that at 7:50am we lost the 6725 level down to 6723 and then reclaimed and went higher. I was off my desk and missed this level reclaim, but it was good for a nice pop back to 6731 level."
2:35pm - Update
"Price needs to reclaim 6722 to keep us moving higher overnight. IF, price loses 6704 then we will most likely need to test the 6683-6688 level that could push us back up the levels. When I posted the trade plan for today, I wrote "Ideally, we can get a flush down to 6697-6700, reclaim 6705 and then long back up the levels." At 1:32pm EST, we got to 6699, reclaimed 6705 and have rallied higher.
--------------------------------------------------------------------------------------------------------------------
Let's get into today's plan! Our overnight session high was 6717 and our low is 6694. I said yesterday that we need to clear 6722 for bulls to continue to push price higher. IF, price loses 6684 that is a warning sign. Guess, what? 6684 area will be a big focus today, IMO.
I will be looking for price to flush to 6680-84, reclaim 6688 and head up the levels. We could also flush 6694, hit 6688 and the reclaim of 6694-96 would be a great spot also.
The reclaim of 6705-07 should get us a few points to retest 6716-17 at the overnight high. Above that and we should retest the weekly highs at 6736, IF, we can clear 6722 area.
6663, 6653 are the next 2 main levels below that I will be looking for reactions.
Key Support Levels - 6653, 6663, 6684, 6697, 6705, 6715, 6725
Key Resistance Levels - 6704-06, 6715-17, 6721, 6728, 6736
Weekly Targets - 6760, 6767, 6776, 6786, 6800+
IF, price loses 6650, then we will most likely flush pretty hard below. Since it is the last day of the month/quarter, I do not anticipate that happening. Stay patient and wait for high quality levels to flush and reclaim.
I will post an update around 10am EST.
---------------------------------------------------------------------------------------------------------------------
Couple of things about how I color code my levels.
1. Purple shows the weekly Low
2. Red shows the current overnight session High/Low (time of post)
3. Blue shows the previous day's session Low (also other previous day's lows)
4. Yellow Levels are levels that show support and resistance levels of interest.
5. White shows the trendline from the August lows.
ESU2028 trade ideas

Day 40 — Trading Only S&P Futures | -$2,515 LossDay 40 of Trading Only S&P Futures closes with another red day, down -$2,515.
I started the day with losses from an overnight trade but worked back to breakeven after a few solid setups. Then came the turning point — I bet on structure flipping bullish, set multiple buy-the-dip orders with stops just under 6701, and got wicked out two points before the bounce. That single trade set the tone for the rest of the session.
On top of that, I was fighting a headache all morning, so instead of tilting, I stepped away, left orders at key levels, and let the market do its thing. This challenge isn’t about perfection — it’s about consistency and learning, even on tough days.
📰 News Highlights
US economic data releases to pause in government shutdown, Bureau of Labor Statistics says.

Day 39 — Trading Only S&P Futures | -$2,465 DrawdownDay 39 of Trading Only S&P Futures ends with a tough -$2,465 loss.
The morning started strong — I was green on my first three trades with bullish signals at the open. But by 10am, unexpected news about a government shutdown and rate cut doubts shook the market. I got shaken out, lost my morning gains, and ended the day deep in the red.
In hindsight, if I had trusted my analysis, kept my MOB buy-the-dip orders, and stayed patient, I would’ve finished green. Instead, I let the news trigger me and broke discipline.
🔑 Key Levels for Tomorrow
Above 6705 = Flip Bullish
Below 6675 = Flip Bearish

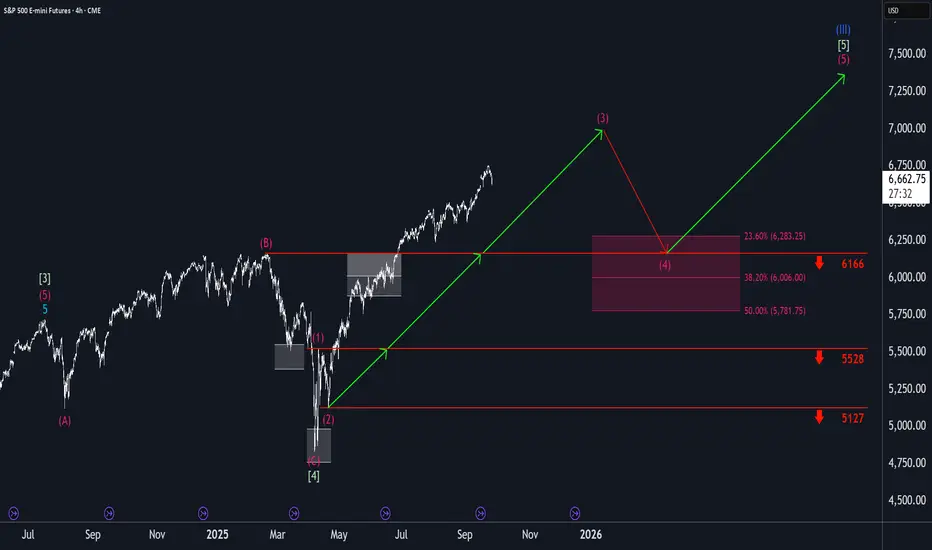
S&P 500: Rally Stalls, but Further Upside LikelyMidweek, the S&P 500 struggled to find the momentum needed to extend its climb within the magenta wave (3). However, our primary outlook still calls for this wave to reach a somewhat higher high. Afterward, wave (4) of the same color is expected to take over, guiding the index into the magenta Target Zone between 6,283 and 5,781 points. In wave (5), another upward phase is anticipated, which should ultimately complete the broader uptrend of the blue wave (III) at an even higher price level.
Day 41 — Trading Only S&P Futures | Beating the WhipsawDay 41 of Trading Only S&P Futures closes green across the board: +$1,866 across all accounts, with +$409 booked on my main account.
The market felt wild today with whipsaw moves all over. Instead of forcing trades, I waited it out and stayed patient near breakeven. Toward the end of the session, I finally got high-probability setups — and that made the day.
My trade copier app glitched out, so execution wasn’t perfect across accounts, but the main lesson here is clear: patience beats trying to fight the chop.
📰 News Highlights
DOW, S&P 500 and NASDAQ end higher as government shutdown looms
🔑 Key Levels for Tomorrow
Above 6720 = Flip Bullish
Below 6695 = Flip Bearish

ES - Sand ThemeThis is the ES chart with a custom color theme. Orange for down candles and Dark Blue for up candles. With a dark text.

ES - September 26th - Daily Trade PlanSeptember 26th - 6:30am EST
*Before reading this trade plan, IF, you did not read yesterdays, or the weekly trade plan take the time to read it first! (You can see both posts in the related publication section) *
If my posts provide quality information that has helped you with your trading journey. Feel free to boost it for others to find and learn, also!
You can review yesterday's plan and the updated notes as I trade during the day. This commentary is intended for myself to easily be able to go back and review my plan and how I did from an execution perspective.
We had some key levels that were lost yesterday and until we clear 6684, bears are in control. We are now trading below the white trendline magnet that I have been discussing for over a month. My lean is that we could chop around today between 6674 and 6633 with 6653 being our mid-point.
---------------------------------------------------------------------------------------------------------------------
Overnight session high is 6674 and low is 6653. We have the White Trendline Magnet above at around 6675. My lean is we fill out and chop around this 6674-6633 level. Any, loss of 6624 would see 6611 as first area of support.
Key Support Levels - 6653,6644, 6633,6624, 6611,6602, 6588,6575, 6541
Key Resistance Levels - 6668, 6674, 6679, 6684, 6688, 6694, 6705
I will be looking for a flush of 6653 and reclaim as first level for some points. IF, we lose 6650, I would wait for the flush and reclaim of 6633 or 6624. 6633 has been used up 2x yesterday, so we could slice through it. 6611 (Weekly Low) would be the next best area for liquidity to long.
I will post an update around 10am EST.
---------------------------------------------------------------------------------------------------------------------
Couple of things about how I color code my levels.
1. Purple shows the weekly Low
2. Red shows the current overnight session High/Low (time of post)
3. Blue shows the previous day's session Low (also other previous day's lows)
4. Yellow Levels are levels that show support and resistance levels of interest.
5. White shows the trendline from the August lows.
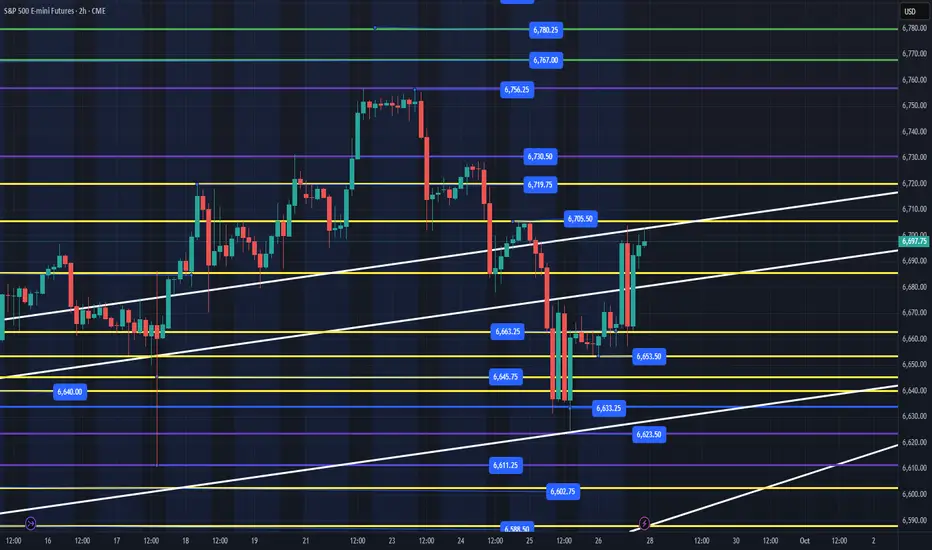
ES Futures (SPX, SPY) Weekly Analyses, Levels: Sep 29 - Oct 3 Weekly Outlook
The trend remains bullish on both the weekly and daily charts, with price action re-accumulating beneath a well-defined supply zone around 6750–6760. Friday’s rebound from the low 6600s has established a higher-low structure on the 4-hour and 1-hour timeframes, closing above the mid-range of 6612–6630, which shifts near-term momentum back in favor of the buyers.
As we enter a catalyst-heavy week, the path of least resistance suggests a measured push through last week’s “weak high” zone (6750–6760). A decisive move above this supply shelf could target the psychological 6800 mark first, with potential for further upside towards 6865–6885, assuming momentum and market breadth are supportive.
Conversely, if we fail to establish acceptance above 6755, the market could revert to a 6700–6760 range, with downside risks extending to 6620 in response to any hot economic data or risk-off sentiment in the headlines.
Key catalysts this week (ET)
Mon–Thu: Fed speakers scattered; watch for rate-path color and balance-sheet remarks.
Tue 10:00: JOLTS (Aug).
Wed 8:15: ADP employment (Sep). Wed 10:00: ISM Manufacturing (Sep).
Fri 8:30: Non-Farm Payrolls & Unemployment (Sep). Fri 10:00: ISM Services (Sep).
Note: Any fiscal headlines or shutdown noise can skew liquidity and tape reactions around these prints.
Tomorrow — NY AM plan (Level-KZ Protocol 15/5/1)
ES Long (A++) — 6750–6760 Acceptance Continuation
Bias: Bullish if we get acceptance above the 6750–6760 shelf.
Trigger: 15m full-body close above 6755. Then 5m pullback holds ≥6750 and re-closes up; enter on the first 1m HL.
Entry: 6752–6756 pullback fill (avoid chasing a wick).
Stop: Hard SL below the 15m break-candle low −0.50. Viability gate: TP1 ≥ 2.0R.
Targets: TP1 6798–6805; TP2 6865–6885; TP3 6900–6915.
Management: No partials before TP1. At TP1 close 70%, move runner to BE. Trail only after TP2 or if a 5m lower-high forms against you. Time-stop 45–60m if neither TP1 nor SL hits. Max 2 attempts at this level for the session.
Invalidation: 15m body back inside ≤6748 or a failed 5m re-close (acceptance lost).
ES Short (A+) — 6750–6760 Rejection Fade
Bias: Mean-revert to base if the shelf is swept and rejected.
Trigger: Sweep 6750–6760 and 15m closes back below 6748. Then 5m re-close down with a LH; enter on the first 1m LH.
Entry: 6744–6748.
Stop: Above the rejection wick +0.50 or ≥6762, whichever is tighter.
Targets: TP1 6705; TP2 6680; TP3 6620.
Management: Take 70% at TP1, runner to BE; consider covering more ahead of 6680 into data windows. Time-stop 45–60m. Max 2 attempts.
Invalidation: 15m acceptance back above 6755 or a 5m close making new session highs.
Price Projection for the Week
Base Scenario: If we see early-week acceptance above 6755, look for targets at 6800, paving the way for a gradual move towards 6865–6885 by Friday. A soft-landing scenario, characterized by cooler labor growth and steady ISM data, could push prices even to the 6900–6915 range.
Alternative Scenario: Should we experience a rejection in the 6750–6760 range, expect the ES to remain range-bound between 6700–6760. Hot labor market data or strong ISM figures could drive the price back to 6620, where it’s crucial for buyers to defend this level to maintain the uptrend.
Execution Notes:
- Focus on trade opportunities only within key kill-zones: primary session is NY AM from 09:30–11:00; optional trading during Asia/London sessions should be done at reduced sizes.
- Adhere to daily barriers: halt trading at -2R or after achieving +3R net.
- On first touch, prioritize R0/S1 as significant; consider de-risking during second or third interactions.
Day 37 — Trading Only S&P Futures | +$1,559 Bearish BreakdownDay 37 of Trading Only S&P Futures is wrapped up with a strong green day — finishing +$1,559.
The session didn’t start smooth. Running on 4 hours of sleep, I accidentally put in a buy order instead of a sell order at the 1-min MOB level. That mistake cost me some early profits, but once I flipped short, the bearish structure was undeniable.
From there, it was all about riding the trend down — stacking shorts as sell signals and structure aligned. A strong reminder that even with mistakes, discipline and following the signals can still turn the day around.
🔑 Key Levels for Tomorrow
Above 6725 = Flip Bullish
Below 6708 = Remain Bearish

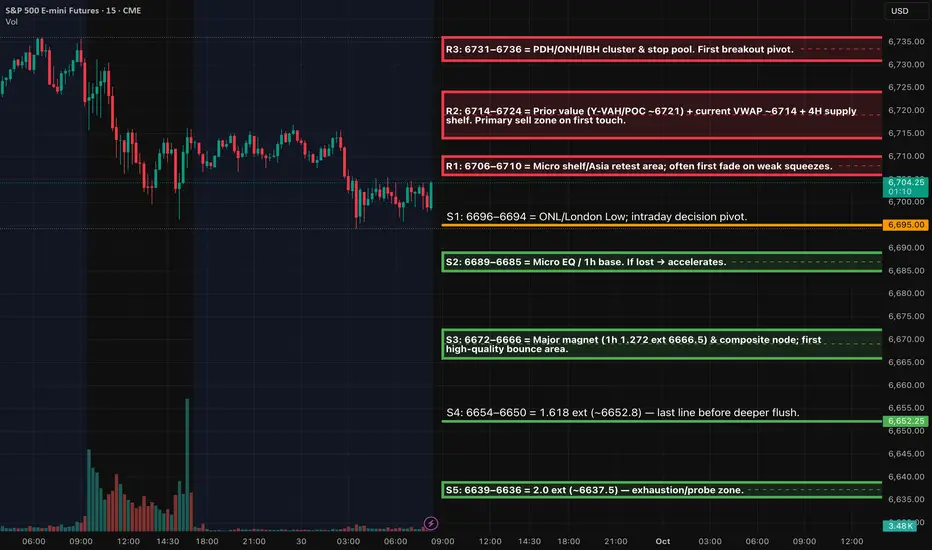
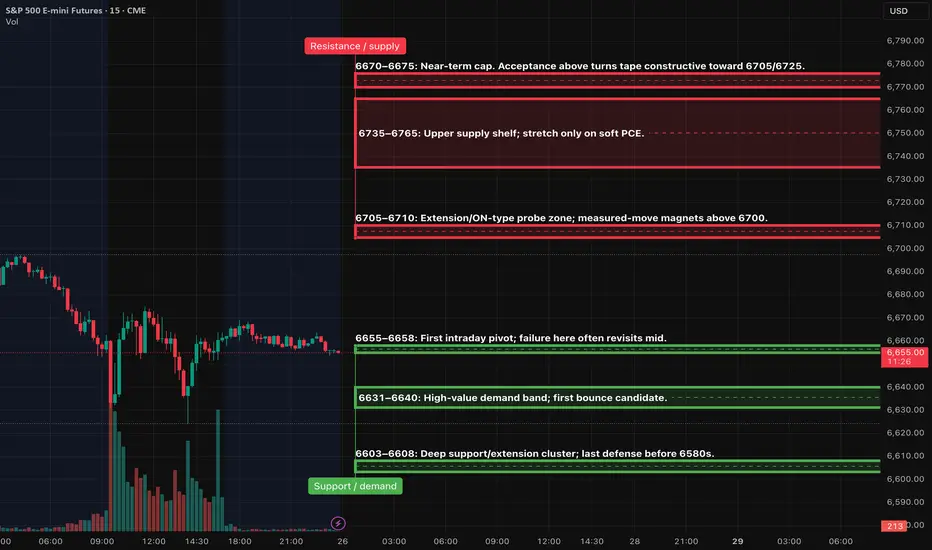
ES (SPX, SPY) Analyses, Key Zones, Setups Thus (Sep 30)SESSION DRIVERS
• Europe: Germany CPI/HICP prelim came in hotter (2.4% y/y).
• Energy: OPEC+ chatter about a possible +500k b/d hike hit crude; watch cross-asset spillover.
• U.S. tape: Headlines around government-funding risk; yields eased into week-start.
→ Net: headline sensitivity + range tendencies early; let NY cash open set the tone.
INTRADAY BIAS & SCENARIOS
Base case: Range-to-down if 6714–6724 caps on first tests → rotate toward 6696 then 6669.
Alternative: Acceptance above 6724 flips momentum up → test 6731–6736 stops; extension possible toward 6750/6763 if buyers hold retests.
Threshold: 6696/6694 pivot (ONL/London Low). Below = opens magnets 6686 → 6669. Above and accepted = re-target 6714/6724.
LEVEL-KZ PROTOCOL (15/5/1) — SETUPS:
Tier-1 (A++) Acceptance Continuation — LONG above 6724
Trigger: 15m full-body close >6724.
5m: Pullback holds 6720–6724 and re-closes up.
1m Entry: HL reclaim.
SL: Below 15m trigger wick or 6716 (whichever is lower).
• TP1: 6731–6736, TP2: 6750, TP3: 6763.
Management: At TP1 close 70%, runner 30% to BE; no trail before TP2.
Tier-1 (A++) Rejection Fade — SHORT at 6714–6724
Trigger: 15m rejection that closes back below 6714.
5m: Re-close down with LH.
1m Entry: First pullback lower-high.
SL: Above 6728 (or 15m wick high).
TP1: 6696–6694, TP2: 6689–6685, TP3: 6672–6666.
Notes: Best on first touch during NY AM.
Tier-2 (A+) Quick-Reclaim Bounce — LONG at 6672–6666
Trigger: Sweep 6666 → instant reclaim; 15m closes back above 6672.
5m: Re-close up holding the band.
1m Entry: HL.
SL: Below 6658.
• TP1: 6696, TP2: 6714–6724, TP3: 6731–6736.
Size: ¾ normal.
Tier-3 (A) Exhaustion Flush — LONG at 6654–6650 or 6639–6636
Trigger: Exhaustion wick + 15m close back inside; 5m re-close up.
SL: 6–8 pts below the wick (respect the 15m anchor).
• TP1: 6666–6672, TP2: 6696, TP3: 6714.
Size: ½ normal. Use only if velocity spike + capitulation tells.
RISK & EXECUTION GUARDRAILS
• Hard SL on the relevant 15m wick ±0.25–0.50 pts.
• Viability gate: TP1 ≥ 2.0R.
• Max 2 attempts per level per session; time-stop 45–60m if neither TP1 nor SL hits.
• Daily guardrails: stop trading at −2R net or lock gains at +3R net.
• Lunch 12:00–13:00 manage only; PM window 13:30–16:00 for second pass.
ES Futures (SPX) - Analyses, Key-Zones, Setups - Thu, Sep 26News & catalysts (ET)
8:30 — PCE & Core PCE (Aug) , the Fed’s preferred inflation gauges. Market focus is on Core PCE ~2.9% YoY and ~0.2% MoM consensus.
10:00 — University of Michigan Consumer Sentiment (final Sep) . Scheduled time confirmed by
Fed speakers: Vice Chair for Supervision Bowman in a 10:00 discussion;
Fed Board’s Beth Anne Wilson remarks at 8:45 at a New York Fed conference.
Earnings/overnight tone: Costco (COST) reported FY Q4 results Thu after close; headlines can sway retail/consumer sentiment pre-open. Nike (NKE) is due Tue 9/30 after close (next week).
Bias:
Base case: Two-way trade into 8:30, directional break afterward.
If Core PCE ≤ 0.2% MoM or ≤ 2.8% YoY: risk-on; favor upside continuation through near-term supply toward 6700+.
If Core PCE ≥ 0.3% MoM or ≥ 3.0% YoY: risk-off; favor sell-the-rips into 6630 → 6605 ladder.
Secondary input 10:00: Michigan Sentiment can add a second impulse; weak sentiment keeps rallies fragile.
PA roadmap
Overnight: Expect balance inside 6655–6675 until 8:30. Liquidity likely pools above 6675 and below 6650 for the data sweep.
NY AM (09:30–11:00): Trade the post-8:30 acceptance: continuation if 15m structure accepts beyond a zone; fade if we get swift rejection back inside.
NY PM (13:30–16:00): Look for consolidation breaks toward untested AM extremes; avoid initiating inside mid-range chop.
Setups (Level-KZ Protocol 15/5/1)
A++ Acceptance Long (major)
Trigger: 15m full-body close above 6670–6675, followed by 5m pullback that re-closes above.
Entry: 1m HL after the 5m re-close.
SL: Below the 15m trigger wick −0.25–0.50 pts.
TPs: TP1 6705, TP2 6725, TP3 6760–6765.
Management: No partials before TP1; at TP1 close 70%, set 30% runner to BE; runner aims TP2→TP3. Time-stop 45–60m if neither TP1 nor SL hits.
Invalidation: 15m body back inside 6670 (acceptance lost).
A++ Acceptance Short (major)
Trigger: 15m full-body close below 6655, then 5m pullback that fails and re-closes below.
Entry: 1m LH after the 5m re-close.
SL: Above the 15m trigger wick +0.25–0.50 pts.
TPs: TP1 6631–6635, TP2 6605–6608, TP3 6580–6585.
Management: Same as above.
Invalidation: 15m body back above 6658.
ES - Weekly Trading Plan - September 28th - October 3rd September 28th - 10:15am - Weekly Trade Plan
We had a great week, and Institutions continue to buy and keep price moving higher. We reached our weekly targets on Monday at 6750-52 then sold off to 6623 on Thursday which was the low of the week. Since Thursday Institutions have been buying and holding the 6653-6663 as the bull/bear line heading into this week. While price can flush lower, we really do not want to see anything lower than 6588 with a quick recovery of 6611 on a weekly basis.
Friday October 3rd is the big catalyst this week with the Employment Report at 8:30am
Key Support Levels - 6684, 6663, 6653, 6634, 6623, 6611, 6602, 6588
Key Resistance Levels - 6705, 6718, 6730, 6756
Weekly Targets - 6767, 6792, 6801, 6813+
Since we closed at the high of the day on Friday, I will post my Daily Trade Plan on Monday around 6am. That way we can see what price does in the overnight session. I anticipate that we hold the 6663 level with 6684 holding being bullish short term to continue up the levels. We could go parabolic this week into the 6800+ levels. I will be waiting on pullbacks to ride higher this week.
One thing to keep in mind is that this week is end of month/quarter and Institutions will be performing their window dressing to show clients how well their quarterly returns are doing. Unless price action changes, you have to follow the trend. Right now, the trend is up!
(I post a more detailed daily plan, and this allows me to focus on price action daily. The weekly plan is a bigger picture overview, but obviously that can change at any time based on daily price action) - *Follow me so you don't miss my daily updates
---------------------------------------------------------------------------------------------------------------------
Purple Levels - Weekly High/Low
Green Levels - Weekly Targets
Yellow Levels - Daily Key Levels (See Daily Trade Plan)
White - Rising trendlines from august lows
ES - September 29th - Daily Trade PlanSeptember 29th - 5:15am EST
*Before reading this trade plan, IF, you did not read Friday's, or the Weekly Trade Plan take the time to read it first! (You can see both posts in the related publication section) *
If my posts provide quality information that has helped you with your trading journey. Feel free to boost it for others to find and learn, also!
My daily trade plan and real-time notes that I post are intended for myself to easily be able to go back and review my plan and how I did from an execution perspective.
--------------------------------------------------------------------------------------------------------------------
We opened last night as expected with continued momentum. The overnight session low was 6697 and as of writing this post, we are coming into the high of the session at 6730-32. I stated in my plan on Friday, that "until we clear 6684, bears are in control". We cleared 6684 around noon on Friday and have not looked back since. We are coming into a strong resistance level at 6730-32 and I do expect us to pull back this morning and will be looking for a quality setup to go long and keep the momentum higher.
Key Support Levels - 6684, 6697, 6705, 6715, 6725
Key Resistance Levels - 6730-32, 6737, 6744, 6755
Weekly Targets - 6760, 6767, 6776, 6786, 6800+
First level we are looking to defend will be 6715-6718. Any flush below and reclaim of 6725 should give us another attempt at clearing 6730-32 level.
Ideally, we can get a flush down to 6697-6700, reclaim 6705 and then long back up the levels.
IF, price loses 6684, we will need to look for flush and reclaims to get us moving back up the levels. I do not anticipate a loss of 6684 today as we close out end of month tomorrow.
I will post an update around 10am EST.
---------------------------------------------------------------------------------------------------------------------
Couple of things about how I color code my levels.
1. Purple shows the weekly Low
2. Red shows the current overnight session High/Low (time of post)
3. Blue shows the previous day's session Low (also other previous day's lows)
4. Yellow Levels are levels that show support and resistance levels of interest.
5. White shows the trendline from the August lows.

ES - September 25th - Daily Trade PlanSeptember 25th - 6:30am EST
Before reading this trade plan, IF, you did not read yesterdays, or the weekly trade plan take the time to read it first! (You can see both posts in the related publication section)
Yesterday I posted on my 9:15am Note:
"One thing to remember is that last week's high was 6731. We could easily open at 9:30am and pop above the 6728 to 6731-33 level and then sell off back inside the range and flush lower. Above 6733 and we should continue to back test 6741-44 level. This is a very tight range, and I would be cautious and not chase price. Only enter based on your edge. I will be following my plan! I really like the flush and reclaim of 6692-96 as our next level to find some liquidity."
What happened at the open? We tested 6728 one more time, lost 6721, then kept moving lower. We bounced at the 6705 level, then sliced through down to 6685.
At 11:57am, I posted the following - "We should get a short squeeze around this area. Watch for 6684-87 and reclaim of 6694." At 12:12pm we put in a perfect failed breakdown of the 6679 blue level on our chart. You can see on the 1 min chart that price tested the level, bounced, came back down and retested without losing the low, and you can then buy when it cleared 6682.
On my 12:30pm - Update I wrote -
"Price hit the 6679.25 blue level, back tested it and held. Then rallied. I bought a position at 6681 and sold it at 6691 and have a runner at 6683. I will move it up, IF, price continues to rally. Any pull back we need to hold 6684. That would be a possible entry, IF, you missed this move. I would not chase. Let price build structure from this short squeeze."
At 12:57pm we back tested down to 6686 and rallied up to 6700.
Yesterday was a great day for me and being patient and waiting for the blue levels to flush and reclaim is a gold mine when we have this level of volatility. I expect these types of moves to continue over the coming months. IF, you want to be successful in trading there are 3 main rules you have to obey.
1. NEVER SHORT ES - You make much more money with the short squeeze we saw yesterday at key levels than trying to pick when Institutions will sell.
2. Wait for the key levels to flush and reclaim and buy once you see structure and that price is not going to sell below that level once tested.
3. Sell at each level above. DO NOT predetermine how many levels price will go. Always, take profits when they are available.
A good example of this was when I wrote the following yesterday at 1:12pm -
"We back tested down to 6686 and then have rallied up and into some overhead resistances at 6697. I just sold my runner at 6697. Price can still keep going higher, but I wanted to lock in gains for the day, so I can be off my desk this afternoon. I had a great day, and it has been a great week. No reason to be greedy."
Why did I sell at 6697? It was a key resistance on my chart. Did price sell off? Yes, it did. IF, I had held I would have lost out on the gains that I locked in.
---------------------------------------------------------------------------------------------------------------------
Overnight session high is 6705 and low is 6684. We have the White Trendline Magnet below at around 6670. My lean is we will flush 6684 down to the 6670, 6663, 6661 levels, and put in a nice bounce to back test the 6684 level and potentially higher.
6705 is the key level for bulls to reclaim to keep us moving higher, then 6731.
Key Support Levels - 6684, 6679, 6670, 6663, 6661
Key Resistance Levels - 6697, 6705, 6711-15, 6731
My lean is we get a flush down to the white trend line around the NYSE open and retail traders will think we are going to go much lower and then we get a short squeeze. This white trendline has been tested 3x and might have one more good bounce left in it. IF, price cannot close the week above 6685, we could be in for lower prices next week.
I will post an update around 10am EST.
---------------------------------------------------------------------------------------------------------------------
Couple of things about how I color code my levels.
1. Purple shows the weekly Low
2. Red shows the current overnight session High/Low (time of post)
3. Blue shows the previous day's session Low (also other previous day's lows)
4. Yellow Levels are levels that show support and resistance levels of interest.
5. White shows the trendline from the August lows.

ES1! DAILY upwards towards 7000!1). Rate cuts have begun! 2). ABC correction likely over. 3). MACD divergence. 4). Risk Assets are positive across the board!

Market Analysis: Signs of Weakening Demand in the S&PThe S&P has been showing some interesting characteristics in recent weeks that warrant closer attention. We’re observing a notable shift in market dynamics, with supply increasing while demand has been decreasing. This combination is creating a setup that could lead to increased market volatility in the near term.
As we approach the previous high in the market, it becomes crucial to evaluate the quality of the demand we’re seeing. The concern here is that we may be looking at a lower high formation, which historically has been an indicator of increased volatility on the horizon.
What makes the current situation particularly noteworthy is the pattern of declining demand we’re witnessing. There are now two distinct areas where demand is clearly decreasing. In one area, the demand has remained more or less consistent throughout. However, in another location, we’re seeing what appears to be a local decrease – a temporary decline that may or may not persist.
Looking at the bigger picture, there’s a substantial drop in demand from the highest point to the lowest point we’ve measured. Following that decline, we’re now seeing demand decrease once again. While it’s true that markets can experience periods where demand decreases without major consequences, these patterns don’t typically persist indefinitely. Eventually, these decreases in demand tend to bring some kind of market reaction.
The pattern we’re currently observing appears to confirm this expectation. We’ve already seen what appears to be the largest reaction so far, which shouldn’t come as a surprise to those who have been watching the market closely. In previous analysis, there was anticipation of this exact reaction occurring, and the reason for that expectation was based on clear market signals.
The key evidence lies in a specific area where supply came into the market. When examining the volume in that region, there’s a slight increase relative to the surrounding areas. But what’s particularly telling is what happens next with price action. Over the course of five or six bars, the price essentially goes nowhere. It stalls out despite the presence of volume, which is a significant signal.
Adding to this picture, there are multiple days within this period where the price actually attempts to react downward. These repeated attempts at downward movement, combined with the stalling price action and the presence of supply, paint a picture of a market struggling to maintain its upward momentum.
The convergence of these factors – increasing supply, decreasing demand, stalling price action near previous highs, and repeated attempts at downward reactions – all point toward a market that may be approaching a period of increased volatility. While markets can certainly remain resilient in the face of such conditions, the quality of demand at these levels appears to be deteriorating, which is something that active market participants need to keep on their radar as we move forward.
Disclaimer: This content is for educational purposes only and should not be considered financial advice.

Day 38 — Trading Only S&P Futures | +$1,935 WinI’m trading one system, one ticker — S&P 500 futures — every single day for a full year. I journal every session to track progress, reflect, and sharpen my execution.
If you’re serious about building consistency and treating trading like a business, you’re in the right place.
Stick around — at the end, I’ll break down the key levels I’m watching for tomorrow. Let’s go.
Recap & Trades
Day 38 was different — I woke up late, wasn’t feeling well, and missed the morning’s big drop and recovery. Instead of forcing trades, I stayed patient on the sidelines.
By the afternoon, DL and DD signals lined up beautifully. That’s when I stepped in, executed clean trades, and finished the session +$1,935. Proof that sometimes the best edge is waiting until the market gives you alignment.

Waiting on what happens in Washington DCWith the potential government shutdown looming, the S&P 500 daily chart has a neutral zone structure as the market waits for an outcome.

Day 35 — Trading Only S&P Futures | SPX Hits RecordDay 35 of Trading Only S&P Futures is complete!
Today was one of the smoother days. We opened with a bullish structure signal and a clean backtest near the MOB. From there, the market ripped higher. I didn’t catch the full move but I did nail the initial push, which gave me space to step away for most of the day.
Later in the afternoon, I tried shorting with a tight stop and got clipped. Reentered closer to 6755 resistance, and that short worked out well, closing the day +$849.90.
🔑 Key Levels for Tomorrow
Above 6705 = Remain Bullish
Below 6690 = Flip Bearish
📰 News Highlights
The S&P 500 just ended at a new record for the 28th time this year.

Buyers have returnedBuyers have returned in the S&P 500 but can they follow through to the upside in the daily chart of the S&P 500 on Friday. The bias is far removed to the upside.

Next three days are very importantThe next three days and the S&P 500 daily chart can set the tone for the next week. If buyers are here then we need to see them at the very beginning of the week moving prices higher.

Core Concepts of Digital Assets & Economy1. Defining the Digital Economy
The digital economy refers to all economic activities that are based on or significantly shaped by digital technologies. It is built upon the interconnectedness of the internet, cloud computing, mobile applications, artificial intelligence (AI), blockchain, and big data analytics.
Key characteristics of the digital economy include:
Intangibility of Value – Value is increasingly derived from information, algorithms, and digital assets rather than physical goods.
Global Connectivity – The digital economy transcends geographical borders, enabling instant cross-border transactions.
Platform-Centric Business Models – Companies like Amazon, Google, and Alibaba leverage platforms to connect producers and consumers digitally.
Data as the New Oil – Data is both an asset and a currency in the digital economy, driving decision-making, personalization, and automation.
The digital economy represents a shift from traditional capital and labor-based growth models to innovation, intellectual property, and technological adoption.
2. What Are Digital Assets?
A digital asset is any item of value that exists in digital form and can be owned, transferred, or exchanged. While traditional assets such as stocks, bonds, or real estate are physical or paper-based, digital assets are intangible and exist in electronic environments.
Examples include:
Cryptocurrencies like Bitcoin and Ethereum
Tokenized assets (fractional ownership of real estate, stocks, or commodities)
Non-Fungible Tokens (NFTs) representing art, music, or collectibles
Intellectual property (patents, copyrights, digital designs)
Virtual goods in gaming ecosystems
Personal data and digital identities
Core properties of digital assets:
Intangibility – Exists only in digital form.
Transferability – Can be exchanged globally within seconds.
Programmability – Assets can be coded with rules (smart contracts).
Security & Scarcity – Blockchain ensures authenticity and prevents duplication.
3. Classifications of Digital Assets
Digital assets can be broadly categorized into the following:
a. Cryptocurrencies
Decentralized digital currencies secured by cryptography, such as Bitcoin, Ethereum, and stablecoins. They serve as mediums of exchange, stores of value, and units of account in the digital economy.
b. Security Tokens
Digitized representations of traditional financial instruments like stocks, bonds, or derivatives. They are regulated and offer investor rights, dividends, and voting power.
c. Utility Tokens
Tokens that grant access to a product or service within a specific blockchain ecosystem. Example: Ether (ETH) is used to pay for transactions on Ethereum.
d. Non-Fungible Tokens (NFTs)
Unique digital certificates of ownership for art, collectibles, music, and other creative assets. They have revolutionized content monetization.
e. Central Bank Digital Currencies (CBDCs)
Digital versions of national currencies issued by central banks. Examples: e-CNY (China), Digital Euro, and India’s e-Rupee.
f. Tokenized Real-World Assets
Fractional ownership of real-world assets (real estate, gold, art) represented digitally, enabling liquidity and global access.
4. Technological Foundations
The rise of digital assets and the digital economy is powered by several foundational technologies:
Blockchain & Distributed Ledger Technology (DLT) – Ensures transparency, immutability, and security in digital asset transactions.
Smart Contracts – Self-executing agreements coded into blockchains, enabling automation of trust.
Artificial Intelligence & Machine Learning – Power predictive analytics, personalized services, and fraud detection.
Cloud Computing – Provides scalability and infrastructure for digital platforms.
Internet of Things (IoT) – Connects devices and enables real-time data-driven economic models.
Cybersecurity – Protects data, digital identities, and financial transactions.
5. Economic Implications of Digital Assets
The integration of digital assets into global markets has profound economic consequences:
Financial Inclusion – Cryptocurrencies and mobile banking provide unbanked populations access to financial services.
New Forms of Value Creation – NFTs empower artists and creators to monetize directly without intermediaries.
Liquidity in Illiquid Markets – Tokenization makes assets like real estate and fine art more accessible and tradable.
Disintermediation – Blockchain eliminates traditional intermediaries (banks, brokers), reducing costs.
Cross-Border Trade – Digital currencies enable instant, low-cost international remittances.
Gig & Creator Economy Expansion – Platforms monetize skills, data, and content more efficiently.
6. Digital Assets as a New Asset Class
Digital assets are increasingly recognized as a distinct asset class in investment portfolios. Institutional adoption is rising, with hedge funds, pension funds, and sovereign wealth funds diversifying into cryptocurrencies and tokenized assets.
Key investment features:
Volatility & High Returns – Cryptocurrencies are volatile but potentially yield high returns.
Correlation Diversification – Digital assets often move differently from traditional equities and bonds.
Hedging Against Inflation – Bitcoin is often termed “digital gold” due to its scarcity.
Programmable Income – DeFi allows investors to earn yield through staking, lending, and liquidity provision.
7. Risks & Challenges
While digital assets promise innovation, they come with risks:
Volatility – Price swings can destabilize portfolios.
Regulatory Uncertainty – Lack of uniform global frameworks creates risks for investors and businesses.
Cybersecurity Threats – Hacks and frauds remain major concerns in exchanges and wallets.
Scalability Issues – Networks like Ethereum face high transaction costs during peak demand.
Environmental Concerns – Proof-of-Work blockchains consume significant energy.
Illicit Use – Cryptocurrencies have been linked to money laundering and dark web activities.
8. Regulation of Digital Assets
Governments worldwide are grappling with regulating digital assets:
United States – The SEC and CFTC regulate cryptocurrencies as securities or commodities depending on classification.
European Union – Introduced MiCA (Markets in Crypto-Assets Regulation) to standardize frameworks.
China – Banned cryptocurrencies but promotes its CBDC, e-CNY.
India – Taxed crypto gains but has yet to establish a comprehensive regulatory law.
Global Organizations – The IMF and BIS advocate for international cooperation on digital currency regulation.
Regulation aims to balance innovation and investor protection, prevent financial crime, and ensure monetary stability.
9. The Digital Economy Ecosystem
The digital economy is composed of multiple interconnected ecosystems:
E-commerce & Digital Platforms – Amazon, Flipkart, and Alibaba dominate online retail.
Digital Finance & Fintech – Payment apps (PayPal, UPI, Stripe) and DeFi platforms.
Gig & Freelance Economy – Platforms like Upwork and Fiverr enable remote work monetization.
Metaverse & Virtual Economies – Virtual real estate, gaming assets, and social experiences.
Data Economy – Data marketplaces and AI-driven businesses monetize personal and enterprise data.
10. Future of Digital Assets & the Digital Economy
Looking ahead, digital assets will continue to reshape economies:
Mainstream Adoption – With regulatory clarity, institutional and retail adoption will surge.
Rise of CBDCs – National digital currencies will modernize monetary systems.
Tokenization of Everything – From cars to carbon credits, all assets may become tradable on blockchains.
Integration with AI & IoT – Smart cities and autonomous economies will emerge.
Decentralized Autonomous Organizations (DAOs) – Communities will govern businesses democratically through tokens.
Sustainable Finance – Shift to energy-efficient blockchain systems.
11. Case Studies
a. Bitcoin’s Role in Inflation-Hedging
During periods of global uncertainty, Bitcoin has been compared to gold as a hedge against inflation. In countries like Venezuela and Turkey, citizens turned to Bitcoin when national currencies collapsed.
b. NFTs in the Creative Industry
Artists like Beeple sold digital art for millions using NFTs, disrupting the traditional art world by eliminating galleries as gatekeepers.
c. China’s e-CNY Experiment
China is pioneering CBDC adoption through pilot programs in cities, with potential to influence cross-border trade settlement systems.
12. Ethical & Social Considerations
Digital assets also raise ethical debates:
Data Privacy – Who owns and monetizes personal data?
Digital Divide – Wealthier nations may dominate digital finance while poorer countries lag.
Speculation vs. Utility – Many crypto projects focus more on speculation than genuine utility.
Sustainability – Transition to green blockchain systems is crucial for climate goals.
Conclusion
The fusion of digital assets and the digital economy represents a fundamental transformation of global finance, trade, and innovation. Digital assets are not merely speculative instruments but new forms of value representation that empower individuals, democratize finance, and reimagine ownership. Meanwhile, the digital economy provides the infrastructure, platforms, and ecosystems where these assets thrive.
However, this transformation is not without risks—volatility, regulation, cybersecurity, and ethical challenges must be addressed to ensure stability and inclusivity. As technology evolves, the future will likely see a convergence of blockchain, AI, IoT, and tokenization, shaping a borderless, data-driven economy.
In essence, understanding the core concepts of digital assets and the digital economy is crucial not only for investors and policymakers but also for individuals and businesses seeking to thrive in an increasingly digital world.

Day 36 — Trading Only S&P Futures | -$1175 LossDay 36 of Trading Only S&P Futures is in the books — and it wasn’t pretty.
I started the session well, up about +$100, but got greedy and overleveraged at 6728 thinking Powell’s comments would flip the market bullish. I was wrong. That single forced trade cost me the day, dropping -$1175.
To make things worse, I missed the chance to buy the actual bottom near 6702. If I’d stayed patient, today could’ve been a very different outcome.
Lesson learned: don’t rush, don’t get over-reliant on gamma levels, and trust my own TA and the algo more.
📰 News Highlights
S&P 500, NASDAQ pull back from records as Powell says stocks are overvalued
🔑 Key Levels for Tomorrow
Above 6725 = Flip Bullish
Below 6700 = Flip Bearish
