selling opportunity at market edge for downtrend continuation 1->3 : 2 is proven sellers
3->4 : return to proven sellers
what next?
* hidden divergence
* obv trendline uptrend rejection,
potential sellers entry
* zone trading 76% accuracy if close
below
ESU2020 trade ideas

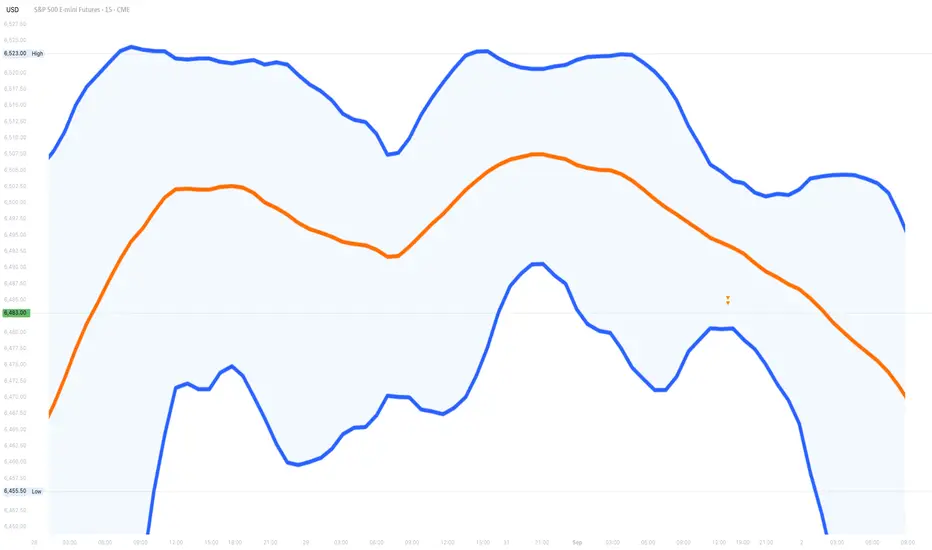
Futures Slip From Highs as Trend Width Flattens, Bias Still UpMarket Overview:
Pullback day near recent highs: breadth softens (12–2), trend width remains wide but begins to flatten, and futures hold above the first momentum threshold with corrective zones well below.
Bullish/Bearish Trend Analysis
Trend Condition:
Bullish Trends: 12
Bearish Trends: 2
Overview: The market is bullish, with 12 trend lines signaling upward momentum, though two bearish lines appear—showing a mild softening in breadth.
Trend Condition
Current Trend State:
The 14-line trend stack is slightly compressing versus yesterday.
Width: Wide—elevated, beginning to flatten.
Implication: Wide-but-flattening often precedes consolidation; a re-widening would argue for continuation.
Price Action and Momentum Zones
Current Price and Change:
Currently, the S&P 500 Futures are at 6,423.00, down by 51.00 pts or 0.79%.
Market Behavior:
Orderly pullback from recent highs; buyers faded, sellers testing the upper momentum band but no decisive breakdown.
Momentum Zones:
Price remains above the 23.6% threshold (6,123.92), the bullish momentum zone. The 38.2%–61.8% band at 5,877.04–5,477.96 is the countertrend, corrective demand area on deeper weakness.
Fib Retracement Levels
Current Position Relative to Levels:
The market is above the 23.6% Fib retracement.
Key Fibonacci Levels:
23.6% → 6,123.92
38.2% → 5,877.04
50.0% → 5,677.50
61.8% → 5,477.96
Analysis:
Staying above 6,123.92 preserves bullish momentum. Continued compression or a close beneath momentum support would shift focus toward the corrective band.
Overall Market Interpretation
Uptrend intact but cooling at the top of the range. Slight breadth deterioration and a flattening stack raise consolidation risk unless trend width re-expands and buyers reclaim control.
Summary
The tape slipped from recent highs with breadth easing to 12–2. Trend width is still wide but flattening, keeping the bias modestly bullish while increasing the odds of a short consolidation if compression deepens.

Understanding Bollinger Bands In Trading🔹 1. What are Bollinger Bands?
Bollinger Bands are a popular technical analysis tool used to measure market volatility and identify overbought or oversold conditions. They consist of three lines plotted relative to price movements, helping traders assess price trends and potential reversal points. Developed by John Bollinger in the 1980s, these bands dynamically adjust based on market conditions, expanding during high volatility and contracting during low volatility.
🔹 2. Components
Middle Band (SMA - Simple Moving Average)
The Middle Band is typically a 20-period Simple Moving Average (SMA).
It represents the average price over the selected period and acts as a trend indicator.
Upper Band
The Upper Band is calculated as:
Upper Band=Middle Band+(k×σ)
Where:
kkk is a constant (usually 2)
σ\sigmaσ is the standard deviation of price over the same period
This band represents an area of potential resistance and an overbought condition if the price approaches it.
Lower Band
The Lower Band is calculated as:
Lower Band=Middle Band−(k×σ)
This band represents an area of potential support and an oversold condition if the price nears it.
🔹 3. Role of Standard Deviation in Bollinger Bands
Measuring Volatility
Standard deviation (σ\sigmaσ) is a statistical measure of price dispersion.
Higher standard deviation means larger price swings, causing the bands to expand.
Lower standard deviation means smaller price swings, causing the bands to contract.
Adaptive to Market Conditions
When volatility increases, the bands widen, signaling strong price movement.
When volatility decreases, the bands contract, indicating a consolidation phase.
Identifying Overbought & Oversold Conditions
When price touches the Upper Band, it suggests the asset might be overbought.
When price touches the Lower Band, it suggests the asset might be oversold.
However, these conditions alone do not guarantee a reversal—other confirmations are needed.
🔹 4. History
1. John Bollinger and the Creation of Bollinger Bands
John Bollinger is a financial analyst, trader, and technical analyst. He is the president of Bollinger Capital Management and a Chartered Market Technician (CMT). He has written books and conducted extensive research on market analysis, risk management, and trading strategies.
2. How Did He Develop Bollinger Bands?
In the late 1970s and early 1980s, traders commonly used fixed-percentage bands, which plotted price channels around a moving average. However, these bands were ineffective because they did not account for changing market volatility.
John Bollinger introduced the concept of standard deviation to measure volatility and dynamically adjust the bands. His key contributions were:
Using a moving average (typically 20-period SMA) as the base.
Calculating upper and lower bands by adding and subtracting a multiple (usually 2) of the standard deviation from the moving average.
Recognizing that market volatility changes over time, meaning bands should expand and contract accordingly.
This approach allowed traders to identify periods of low and high volatility, trend reversals, and breakout opportunities with much greater accuracy.
🔹 5. How Bollinger Bands Work
Bollinger Bands are a technical analysis tool designed to measure market volatility and identify potential trading opportunities.
They consist of three lines:
Upper Band – The Middle Band plus two standard deviations.
Middle Band – A 20-period Simple Moving Average (SMA).
Lower Band – The Middle Band minus two standard deviations.
These bands dynamically adjust to price movements, expanding and contracting based on market volatility. The wider the bands, the higher the volatility, and the narrower the bands, the lower the volatility.
🔹 6. Bollinger Bands Formula
Bollinger Bands are built upon a statistical concept called standard deviation, which measures the dispersion of prices from their average. This allows the bands to expand and contract dynamically based on market volatility.
🔹 7. Interpreting Bollinger Bands
1. Identifying Overbought and Oversold Conditions
Bollinger Bands are widely used in trading because they provide insights into market conditions, trend strength, and potential reversal points.
Overbought Condition: When the price touches or moves above the Upper Band, it may indicate that the asset is overbought, meaning the price has risen too far, too fast. Traders may anticipate a pullback or a trend reversal. However, if a strong uptrend is in place, the price may continue to "ride" the Upper Band.
Oversold Condition : When the price touches or moves below the Lower Band, it may indicate that the asset is oversold, meaning the price has fallen too sharply. This may signal a potential buying opportunity, especially if other indicators confirm it.
📌 Important: Just because the price touches an outer band does not guarantee a reversal. Always use Bollinger Bands with other indicators, such as RSI (Relative Strength Index) or MACD (Moving Average Convergence Divergence), for confirmation.
2. Understanding Price Action Near the Bands
Strong Trends:
If the price moves along the Upper Band during an uptrend, it suggests strong bullish momentum.
If the price moves along the Lower Band during a downtrend, it indicates strong bearish momentum.
Reversal Signals:
If the price moves outside the bands and then quickly re-enters, it may signal a trend reversal.
This can be useful in spotting fake breakouts or exhaustion moves.
Mean Reversion:
Prices tend to revert to the Middle Band (SMA) after touching the Upper or Lower Band.
Traders use this principle to buy near the Lower Band and sell near the Upper Band in ranging markets.
3. Understanding Market Signals
Support & Resistance
If the price is above a band, it may act as support.
If the price is below a band, it may act as resistance.
Trend Analysis
Uptrends: Rising middle and upper bands. Downtrends: Falling middle and lower bands. Consolidation: Flat bands signal sideways movement before a breakout.
Compression & Expansion
Compression (bands tighten) breakout. Indicates low volatility before a breakout.
Expansion (bands widen) → trend continuation. Confirms volatility increase and trend continuation.
🔹 8. Strategies
1. Squeeze Strategy
The Bollinger Band Squeeze occurs when the bands contract tightly, indicating low volatility.
This signals a potential breakout, but it doesn’t predict the direction.
How to Trade the Squeeze
1. Identify when the bands are narrowing after a period of expansion.
2. Wait for the price to break above the Upper Band or below the Lower Band with strong momentum.
3. Enter a trade in the direction of the breakout.
4. Confirm the breakout with other indicators like RSI or MACD to avoid false signals.
5. Set stop-loss orders near recent price consolidation areas.
📌 Example:
If the price breaks above the Upper Band, enter a long position (buy).
If the price breaks below the Lower Band, enter a short position (sell).
✅ Best for: Trending markets, breakout traders.
2. Breakout Strategy
A breakout occurs when the price moves outside the bands, signaling strong momentum.
Traders use this as an opportunity to ride trends rather than fade them.
How to Trade the Breakout
1. Look for the price to close outside the Bollinger Bands (not just touch them).
2. Enter a trade in the direction of the breakout after confirming with volume or another momentum indicator.
3. Place a stop-loss near the Middle Band or recent swing low/high.
4. Exit the trade when the price starts consolidating or shows a reversal pattern.
📌 Example:
If a stock closes above the Upper Band, enter a long trade.
If a stock closes below the Lower Band, enter a short trade.
✅ Best for: Trend-following traders, breakout traders.
🔹 9. Key Takeaways
Structure : Bollinger Bands consist of three lines —middle band (SMA), upper band (SMA + 2 * standard deviation), and lower band (SMA - 2 * standard deviation).
Volatility Signals : The bands expand during high volatility and contract during low volatility, helping to identify potential breakouts or consolidations.
Trend Indicators : The middle band acts as a trendline, with prices above it indicating an uptrend and below it suggesting a downtrend.
Support and Resistance : The upper and lower bands typically act as dynamic resistance and support levels, respectively.
Mean Reversion : In range-bound markets, prices tend to revert toward the middle band, offering potential entry points.
Combination With Other Indicators : Bollinger Bands work best when used with other tools like RSI or Moving Averages to confirm signals and enhance trading strategies.
Quiet holiday marketThe shortened session in the S&P 500 for Monday was relatively quiet for a holiday market. This implies an up move for Tuesday.

S&P 500 Index (01.09.2025)The S&P 500 futures have once again advanced over the past month, reaching a new all-time high. From a technical perspective, the market is currently in overbought territory, which leaves room for a potential pullback. In such a scenario, the index may test the support level around 6,000.
Another factor supporting the case for a correction is the fact that from August through October, equities typically exhibit seasonal weakness. Nevertheless, the long-term trend remains firmly bullish.
Long-term trend: Up
Resistance level: 6,500
Support level: 6,000

Inside dayThe expectation for trade behavior on Monday, September 1 for the S&P 500 daily chart is trading inside the range from the Friday session.

ID: 2025 - 0188.18.2025
Trade #18 of 2025 executed.
Trade entry at 140 DTE (days to expiration).
Excellent fills this morning, well under mid, and I suspect we could see SPX drop in the coming days. Typically when my fills are better than mid, these trades take some heat at the beginning. ZERO risk to the upside, no imminent danger until 6000 gets disrespected.
Working GTC orders in place.
Happy Trading!
-kevin

Nq & Es After Hours Comment 29-08-2025Good evening everyone,
Today my bias was incorrect — instead of moving higher as anticipated, price moved lower to seek out deeper arrays. I did not take any trades, so for me this session remained flat.
See you all on Monday.
Wishing you a great weekend!
⚠️ Disclaimer: This analysis reflects personal market observations and is for educational purposes only. It does not constitute financial advice.

ID: 2025 - 0115.20.2025
Trade #11 of 2025 executed.
Trade entry at 150 DTE (days to expiration).
Excellent fills this morning, well under mid.
Target profit is 5% ROI
Happy Trading!
-kevin

Day 19 — Trading Only S&P Futures | Lessons From a Red DayWelcome to Day 19 of Trading Only S&P Futures!
Not every day is green — today I finished -630.
I’ve realized something important: my trading performance may be tied directly to my routine and supplements. Since I injured my back, I’ve been on painkillers and haven’t taken my usual supplement stack. Today I felt distracted, unfocused, and off my game — even though the setups were there, I just couldn’t execute with clarity.
It’s a reminder that trading isn’t just charts and signals — your health, focus, and routines matter just as much as strategy.
📰 News Highlights
U.S. Q2 GDP RISES +3.3%, EST. +3.0%; PREV. -0.5%
🔑 Key Levels for Tomorrow
Above 6485 = Remain Bullish
Below 6460 = Flip Bearish

PCE can set the toneThe PCE can set the tone for the Friday price action in the S&P 500 stock index. This number important to the Fed and important for the markets Outlook going forward in terms of potential Fed action. The next objective to the upside would be a close above 6530 going into the weekend.

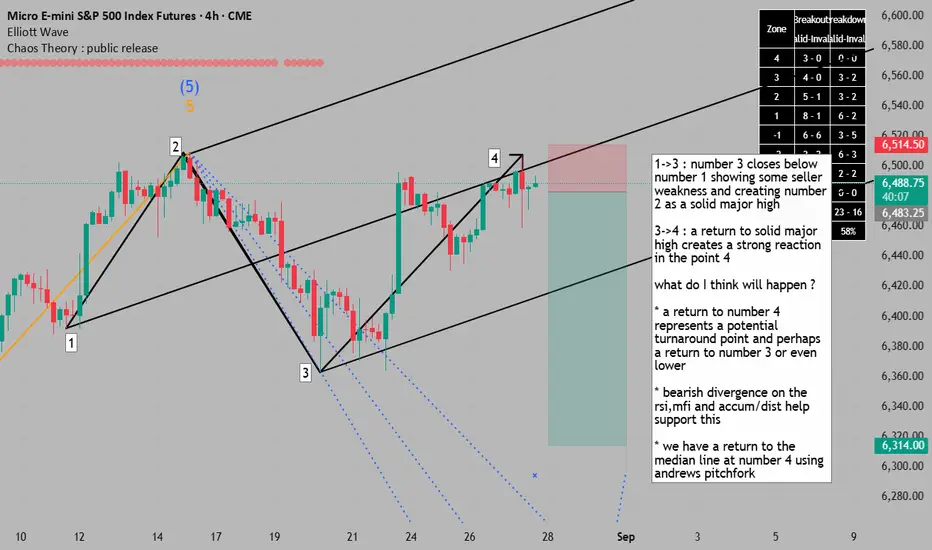
risky but logical =SELLers dream presents a return 2 reisistance1->3 : number 3 closes below number 1 showing some seller weakness and creating number 2 as a solid major high
3->4 : a return to solid major high creates a strong reaction in the point 4
what do I think will happen ?
* a return to number 4 represents a potential turnaround point and perhaps a return to number 3 or even lower
* bearish divergence on the rsi,mfi and accum/dist help support this
* we have a return to the median line at number 4 using andrews pitchfork
Buyers are maintaining positions in the S&P 500 daily chartThe structure and the daily S&P 500 chart implies continuation of buying pressure moving prices higher. However without fundamental information a dramatic move on Thursday is not expected as the market waits for the PCE data on Friday

Day 18 — Trading Only S&P Futures | NVDA Miss, Market DropsWelcome to Day 18 of Trading Only S&P Futures!
Today started with heavy sell signals — we had X10 chip stock sell signals and NVDA X7 sell signal right at the open. I leaned short early but got stopped out around 10:20 as the market squeezed higher.
Instead of chasing longs into bullish structure, I waited for a cleaner level. When price tapped 6495 max resistance (gamma wall), I reloaded shorts. That patience paid off, and by the EU close I was sitting on +416.75 for the day.
The key lesson here? Even when structure flips bullish, respecting higher-level resistance zones can deliver high-reward trades.
📰 News Highlights
NVIDIA STOCK FALLS 3% AFTER DATA-CENTER SALES MISS FORECASTS, LACKLUSTER GUIDANCE
🔑 Key Levels for Tomorrow
Above 6445 = Remain Bullish
Below 6435 = Flip Bearish

MESU5 – Two Longs Today (ZScore & DVD)Instrument: MESU5 (Micro E-mini S&P)
Direction: BUY
Signals:
11:00 ET — ZScore strategy (statistical mean-reversion): SL 6480, TP 6502
11:15 ET — ESDVD strategy (my Daily Volume Cumulative indicator): SL 6482, TP 6504
What the signals mean
ZScore: Looks at how far price deviates from its recent mean in standard-deviation units. I go long when extreme negative deviation begins reverting toward the mean and momentum confirms; targets are near prior balance/VP levels with a defined stop.
ESDVD (Daily Volume Cumulative): Session-based cumulative volume that adds volume on up bars and subtracts on down bars. A positive inflection/divergence vs. price near support triggers a long, with risk defined under the session’s pivot.
Risk Management: Hard stops pre-set (see SL above) and fixed targets; no averaging down.
If you want me to post the chart markup, I’ll add the session and indicator overlays next.
Not financial advice. For research/education only.
#MES #ES #Futures #DayTrading #MeanReversion #Volume #AlgorithmicTrading #ZScore #CumulativeVolume

Buyers bought the breakBuyers bought the break or don't move in the S&P 500 daily chart. The expectation is follow-through to the upside based on the overall structure. However, we do have Nvidia report coming out after the close on Wednesday which can add another variable to the volatility.

$SPY - "Broken Wedges Become Channels"There are reasons for it. I could go into it all. I don't have the energy. This isn't advice. You are responsible for your own investments and allocations and whatnot. I'm just sharing what I do. We will most likely see a channel first. I buy channel bottoms. I am not perfect. They only thing I try to perfect is my position allocation. I will be buying when it makes sense to me.

ES - August 26th - Daily Trade Plan6:25am EST - Daily Trade Plan
I started off this week posting the following:
"What is the plan for this week? When you look at the 2hr, 4hr, 8hr chart and zoom out, you can see that the trend is up and that we will probably need to digest Friday's rally and most likely chop around ideally above 6468, 6452 levels with 6429 being the lowest level we would want to test. Then we can retest the 6508 level and continue higher this week with 6522, 6547 my main targets with 6596 if bulls really want it.
IF, we lose 6369, my lean is that we will continue lower and a new market trend could be starting to unfold with 6245 the big area for us to hold to stay bullish in the bigger picture."
------------------------------------------------------------------------------------------------------------
Last night we touched 6430.75 and rallied 20pts to 6453 which we tested and rejected this level 2x and are now coming into the 3rd test of the level. The overnight session high was 6464 and low was 6430.25. All levels marked in yellow are support/resistance levels we want to wait for price to flush and recover to enter or if we can recover a level above, back test and enter for a move higher.
IF, price can reclaim and clear 6453, we should be able to test 6464, above there we should target 6470, 6482, 6487, 6496, 6508 then 6522, 6547 as my main targets and bulls can still reach 6562, 6581, 6595 if they really want it!
IF, price loses 6430 and cannot reclaim then we will move down the levels with 6411, 6399 and 6385 as the first levels we can look for a reclaim and move back to retest the 6430 level.
I will post an update around 10am EST.

Asia is setting the toneThe Asia session in the daily chart of the S&P 500 is setting the tone for the rest of the trading session. After a moment, buyers are showing up in the Asia session. The critical part will now be the ability of Europe to maintain this upward momentum.

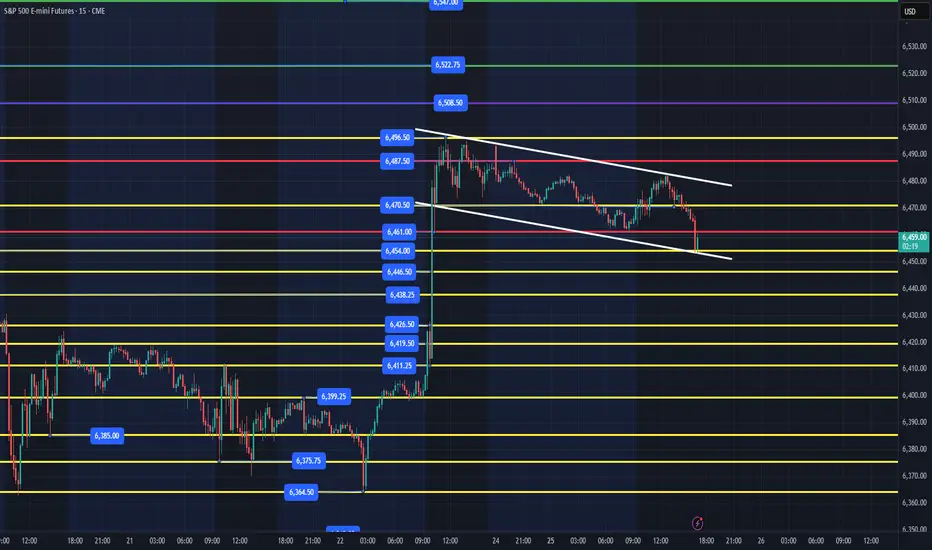
ES - August 26th - Daily Trade Plan - Evening Session OpenAugust 25th - 4pm EST Session Close
I wrote on my post Sunday night... "Monday, I expect price to chop around between 6474 - 6496 with 6454 being the lowest we would want to see price reach before we keep moving up the levels in yellow. First target is 6508 then 6522, 6547 as my first 2 targets and bulls can still reach 6562, 6581, 6595 if they really want it!"
We got the chop today and our entire session traded between 6461-6487 with us selling off a little below at the close.
I think we hold the 6450-54 range, and this bull flag should build out and break out tomorrow. IF, price sells off overnight, then I would look for a yellow support line to flush and reclaim to enter. Ideally, we reclaim 6461 and then start to work our way up the levels. The chart has not changed much from yesterday. I did put in a potential bull flag in white & yesterday's session levels in red.
IF, price can reclaim and clear 6470, our first target is 6482, 6487, 6508 then 6522, 6547 as my main targets and bulls can still reach 6562, 6581, 6595 if they really want it!
I will update my trade plan this evening or tomorrow around 6am EST.
ID: 2025 - 0168.18.2025
Trade #16 of 2025 executed.
Trade entry at 151 DTE (days to expiration).
Excellent fills this morning, well under mid, and I suspect we could see SPX drop in the coming days. Typically when my fills are better than mid, these trades take some heat at the beginning. ZERO risk to the upside, no imminent danger until 6000 gets disrespected.
Working GTC orders for target profit of 5% ROI.
Happy Trading!
-kevin

Nq & Es Premarket comment 25-08-2025Good morning everyone,
We are currently trading within a premium zone, and for that reason I believe price should first move lower into a discount area before continuing higher, given the broader uptrend.
Specifically for Nasdaq (NQ), I would like to see price reach the purple line, which represents the equilibrium level, before looking for long setups. Until then, I am not searching for long trades.
As for the S&P (ES), the situation is similar, but since it is showing stronger bullish structure, I do not expect it to reach its equilibrium level as easily.
Wishing you all disciplined and successful trading.
⚠️ Disclaimer: This analysis reflects personal market observations and is for educational purposes only. It does not constitute financial advice.

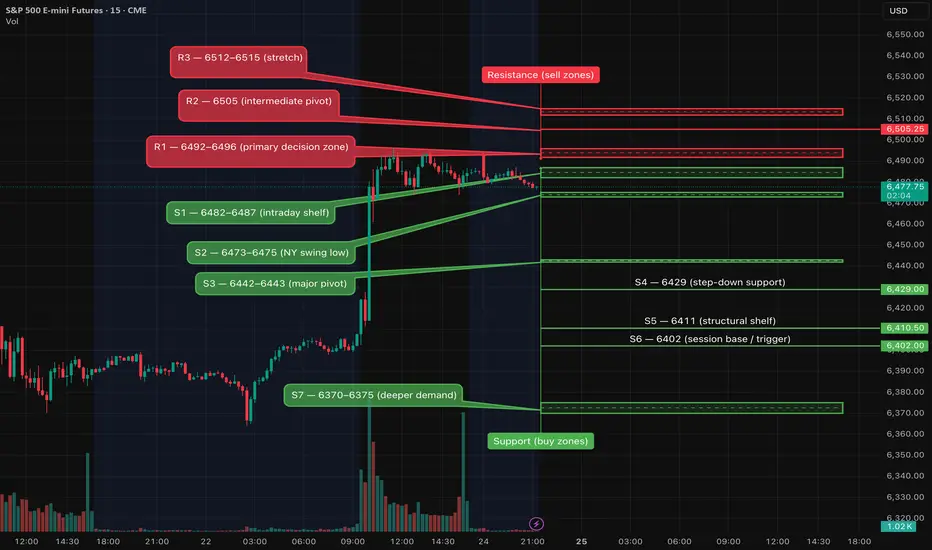
ES Weekly Outlook (Aug 25–29) - Setup and Analyses for 08/25TL;DR: Biggest volatility magnets land mid-to-late week (NVDA Wed PM, GDP/Claims Thu, PCE Fri). For Monday, first decision is the 6492–6496 overhead band. Acceptance above = continuation; rejection = range rotation lower.
⸻
Key Levels (current structure)
Resistance (sell zones)
• R3: 6512–6515 (stretch)
• R2: 6505
• R1: 6492–6496 ← primary decision zone
Support (buy zones)
• S1: 6482–6487 ← intraday shelf
• S2: 6473–6475 ← prior NY swing low
• S3: 6442–6443
• S4: 6429
• S5: 6411
• S6: 6402
• S7: 6370–6375 ← deeper demand
⸻
Monday 8/25 – Scenario Map
Bullish Continuation
• Trigger: 5-minute close & hold above 6492–6496 (no quick reclaim).
• Path: 6505 → 6512/6515; allow for momentum extension if Tuesday’s data are benign.
• Invalidate: Fast reclaim below 6487 after breakout.
Range → Fade
• Trigger: Clear rejection at 6492–6496 (seller response + lower high on 5-minute).
• Path: 6482–6484 → 6473–6475; loss of 6473 opens 6443 → 6429.
• Invalidate: Reclaim/hold > 6490 on a 5-minute close.
Timing note (Mon): Morning housing print around 10:00 ET can nudge yields/ES; treat the first spike cautiously.
⸻
Week at a Glance (ET)
Mon 8/25
• 10:00 – New Home Sales (Jul)
Tue 8/26
• 8:30 – Durable Goods (Jul, advance)
• 9:00 – S&P CoreLogic Case-Shiller Home Prices (Jun)
• 10:00 – Conference Board Consumer Confidence (Aug)
Wed 8/27
• 1:00 – U.S. 5-Year Note Auction
• 5:00 pm – NVIDIA (NVDA) earnings (key AI/mega-cap impulse)
Thu 8/28
• 8:30 – GDP (Q2, 2nd est.)
• 8:30 – Initial Jobless Claims
• 10:00 – Pending Home Sales (Jul)
• 1:00 – U.S. 7-Year Note Auction
Fri 8/29
• 8:30 – PCE & Core PCE (Jul)
• 9:45 – Chicago PMI (Aug)
• 10:00 – Univ. of Michigan Sentiment (Final, Aug)
⸻
Playbook & Risk (how I’ll trade it)
• Wait for the first confirming 5-minute close at the trigger; no entries on wicks.
• Shorts: 5-minute confirmation is enough unless flipping a firmly bullish 15-minute trend (then require the 15-minute validation to size up).
• Management: Time-stop 15–20 min without progress; max 2 attempts per idea.
• Windows: Prefer NY AM (9:45–11:30 ET) and PM (13:30–15:30 ET). Avoid fresh risk ±3–5 min around scheduled releases.
• Into big events: Stay lighter into NVDA (Wed PM) and PCE (Fri AM); let the print set the tone.
⸻
What I’m Watching
• Rates path after Powell → if inflation cools, dips likely get bought; a hot PCE flips that.
• Auction tones (Wed/Thu 1:00) → quick yield swings can drive intraday ES rotations.
• Breadth & leaders → if AI/mega-cap strength broadens, upside extends; if leadership narrows into NVDA, expect chop.