Market Review – Plain TalkToday in Jackson Hole, Powell stepped off the stage with a speech that felt like walking a tightrope. On one side, he’s trying to keep a conservative line, while on the other, Trump is applying relentless pressure to cut rates by 25 basis points, not hesitating to call him a stubborn mule and an idiot. Despite disappointing GDP growth and mounting fears of a slowdown, the market keeps racing upward as if everything is perfectly fine. The Buffett Indicator is soaring at 209%, showing valuations are sky-high, yet investors seem blind to the warning signs. Meanwhile, Trump appointed Stephen Moore, a close ally and provocative figure, to the board, signaling how deeply politics is now woven into Fed decisions.
Powell finds himself surrounded by landmines. Trump is hammering him nonstop to slash rates, senior Fed officials are openly rebelling against policy decisions, employment data is starting to weaken, and the producer price index suggests Trump’s tariffs will spill over onto consumers and ignite inflation. And yet, for now, markets act like nothing’s wrong, pricing in gains and ignoring cracks in the real economy.
In my personal view, two scenarios lie ahead. If Powell gives in and cuts rates, markets will celebrate with another leg higher, but it will be a short-lived party that risks fueling inflation and eventually forcing the Fed into harsher tightening later. If instead Powell digs in and refuses to move, markets may take offense, selling off sharply and correcting valuations back to reality. Either way, the gap between Wall Street optimism and Main Street fundamentals is widening, and sooner or later, that gap will have to close — the only question is how painful the landing will be.
ESH2020 trade ideas

What is ES saying before Jackson Hole With Jackson Hole upon us, we're going to get some explosive moves. I have mapped out my thoughts on the 4H chart. Good luck, be careful out there

ES - August 22nd - Daily Trade PlanAt 6am EST -yesterday's trade plan I wrote " My lean is that IF, we cannot break above 6420, we have a high probability of retesting yesterday's 6362 low." The high of the day was 6412.25 (10am on 15 min) and the low was bought up at 6370.25 (1:15pm on 15 min).
At 10:22am EST - I stated that "We could easily chop around between 6420-6385 for the rest of the day and into tomorrow" We did chop around in that general zone and we did until we lost 6385 and recovered in the afternoon.
Before I get into the overnight session and today's plan. Take a look at ES on a 4hr, 6hr, 8hr Chart and you will see the past 2 days institutional buying at the 6362-69. Massive wicks show support for this range. WHY is this important? It helps us understand what the big $$ are doing. This also will become in the future a potential major level that will continue to be bought up or will be an area we see a flush lower. Always zoom out and see big picture of what could be happening.
-----------------------------------------------------------------------------------------------
4:30am EST - August 22nd - Daily Trade Plan
Solely based on the "Big Picture" (8hr Chart) we are still in a bullish trend. We are not going to change trend until we lose 6245. You can also see a potential head and shoulders pattern building with 6468 being the left shoulder, 6508 being head and we can potentially expect 6468 being the area the right shoulder could build towards.
IF, you have been reading my daily trade plans, you will remember that I said on the "August 19, Big Picture View of Price" (See in related publication section to the right) "You can see that on July 31st we hit 6468.75 and price sold off nearly 225 points and buyers stepped back in on August 1st at 6245 and the cycle begins with selling at resistance and buying at supports of 6315, 6333, 6390, 6453-6456. WHY has price been very choppy in this 6456-6472 area? Price is either accumulating or distributing, but we never know until price loses a big support or resistance."
While I do not predict patterns or what price will do today, tomorrow or next week. I just look for clues and then plan what levels I want to see flush and recover to follow the institutions.
Let's talk about today's plan and discuss what areas we want to see opportunities to grab some points. We have had a high of 6399.25 and 6364.50 as our high and low of the overnight session. Price still needs to clear 6420 to continue up the levels in yellow with 6468 eventually being initial target area for the next potential sell off. Price will go back and forth and chop up retail investors until the institutions have distributed enough to let price just flush down to a level they want to step back in and the cycle repeats. I missed the overnight flush of yesterday afternoon 6370 low (2:30am) and now price is coming into the overnight session resistance of 6399.25.
I need to identify either a move to retest 6412, back test 6399 and then buy on the support for a move to test 6420. Ideally, we could sell off back to the 6364 level or even better 6350, scare retail investors and then wait for a reclaim of 6364 to get back in and ride up. There is a Fed Meeting in Jackson Hole, and I expect some volatility after the NYSE open. I will be patient and wait until after the open to determine what price is doing and where there are good opportunities to enter either by a flush and reclaim of a level or a move higher and back test.
Be patient today, it could get volatile and it's better to wait for good setups to enter. My ideal scenario is waiting for one more good flush of 6364 and reclaim with a rally into the weekend and setting up for an end of month week into Labor Day holiday!
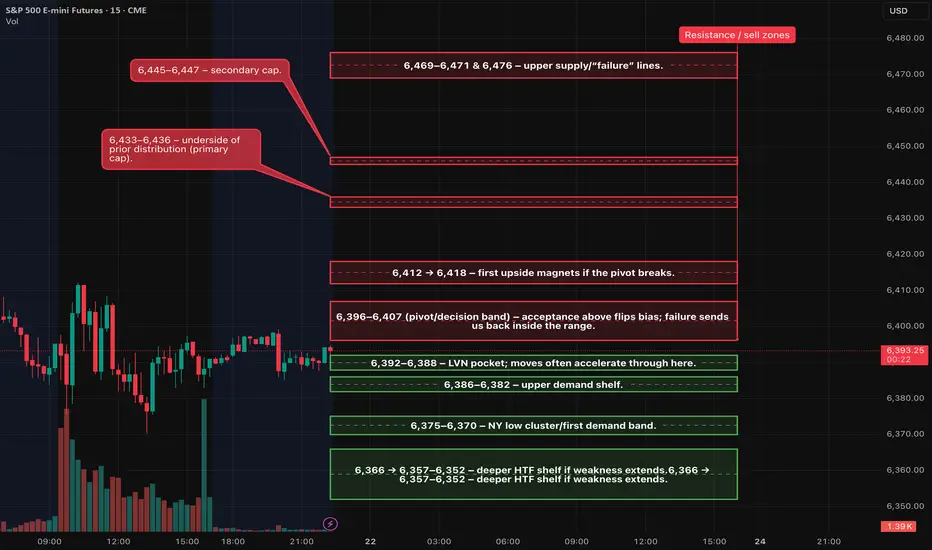
ES Futures — Plan for Fri, Aug 22 Intraday trend on 15m/30m remains down. The 6,396–6,407 band is the pivot/decision zone. Tomorrow’s session is dominated by Powell’s Jackson Hole keynote (10:00 ET) — plan around it.
Fundamentals & Risk Clock (ET)
• 10:00 — Fed Chair Powell speaks at the Jackson Hole Economic Policy Symposium. Treat this as the day’s primary catalyst; no new entries 09:55–10:05 per risk rules.  
• Otherwise, the U.S. calendar is relatively light vs. today’s prints; markets will key off the Powell tone and subsequent positioning.  
Structure Map (carry-forward levels)
Resistance / sell zones
• 6,396–6,407 (pivot/decision band) – acceptance above flips bias; failure sends us back inside the range.
• 6,412 → 6,418 – first upside magnets if the pivot breaks.
• 6,433–6,436 – underside of prior distribution (primary cap).
• 6,445–6,447 – secondary cap.
• 6,469–6,471 & 6,476 – upper supply/“failure” lines.
Support / buy zones
• 6,392–6,388 – LVN pocket; moves often accelerate through here.
• 6,386–6,382 – upper demand shelf.
• 6,375–6,370 – NY low cluster/first demand band.
• 6,366 → 6,357–6,352 – deeper HTF shelf if weakness extends.
Preferred Setup (A++): Range-Continuation Short
Take only with confirmation; score ≥9.
• Trigger: First 5-minute close ≤ 6,390.5 after a failed probe of 6,396–6,407, and the next bar fails to reclaim 6,392–6,394.
• Entry: 6,390.5 (MOS).
• Stop: 6,396.5 (≈6 pts).
• Targets:
• TP1: 6,375.5 (+15)
• TP2: 6,366.0 (+24)
• TP3: 6,358.0 (+32)
• Management: Scale ½ at TP1; move stop → BE only after a fresh 5m lower-low or a clean close through the TP1 zone. If no extension within 2×5m bars, cut to half/scratch.
• Disqualifiers: Thick support immediately stacks under entry or a 15m acceptance back above 6,396–6,407.
Flip Setup (A++ if accepted): Acceptance Long above Pivot
Counter-trend unless 15m turns; size accordingly.
• Trigger: First 5-minute close ≥ 6,407.5 and the next bar does not reclaim < 6,405.
• Entry: 6,407.5 (MOS).
• Stop: 6,401.5 (≈6 pts).
• Targets:
• TP1: 6,418.0 (+10.5 from trigger; acceptable given clean path)
• TP2: 6,435.0 (+27.5)
• TP3: trail toward 6,446+ if momentum persists.
• Disqualifier: Quick slip back < 6,405 after trigger.
Timing & Playbook
• Primary trade windows: 09:45–11:30 ET and 13:50–15:45 ET.
• Powell (10:00 ET): Plan around the speech; entries before the print must have exceptional quality, otherwise wait for post-event structure.
• MOC module (15:40–16:10 ET): Use the imbalance as a tiebreaker: modest (<$0.5B) = range; strong (≥$1B) can drive a directional push into the cross.
Going into Friday with a bullish biasThe S&P 500 daily chart structure implies a bullish bias going into Friday. This would imply a stronger close going into the weekend.

Day 14 — Trading Only S&P Futures | Powell Speech CautionWelcome to Day 14 of Trading Only S&P Futures!
Today was a major event day with Powell’s speech on deck, so I played it cautious. With the market under my posted levels and a lot of quick signal flips, I avoided rushing in. Instead, I waited for high-probability setups at major moving average levels and focused only on clean entries.
That patience paid off, wrapped up the day with +187.94 while avoiding traps in choppy conditions.
🔑 Key Levels for Tomorrow
Above 6435 = Flip Bullish
Below 6420 = Remain Bearish

S&P 500 (ES1!) : Time For A Pullback From The Highs?In this video, we will analyze the following FX market for the week of Aug 18 - 22nd:
S&P 500 (ES1!)
The S&P 500 hit ATHs again last week, but the last three trading days were narrow in range. Friday was a bearish close.
There is an untested Weekly and Monthly +FVG that price would potentially rebalance before going higher.
I believe this will be the draw on liquidity next week.
Enjoy!
May profits be upon you.
Leave any questions or comments in the comment section.
I appreciate any feedback from my viewers!
Like and/or subscribe if you want more accurate analysis.
Thank you so much!
Disclaimer:
I do not provide personal investment advice and I am not a qualified licensed investment advisor.
All information found here, including any ideas, opinions, views, predictions, forecasts, commentaries, suggestions, expressed or implied herein, are for informational, entertainment or educational purposes only and should not be construed as personal investment advice. While the information provided is believed to be accurate, it may include errors or inaccuracies.
I will not and cannot be held liable for any actions you take as a result of anything you read here.
Conduct your own due diligence, or consult a licensed financial advisor or broker before making any and all investment decisions. Any investments, trades, speculations, or decisions made on the basis of any information found on this channel, expressed or implied herein, are committed at your own risk, financial or otherwise.

$ES Futures: Bearish Breakdown Ahead? Short Setup Inside
## 🔻 ES Futures Bearish Setup: Shorting into Weakness (Aug 21, 2025) 🔻
### 🏦 Market Outlook
* 📉 **Bias:** Bearish sentiment dominates
* 🔎 **Tech drag** + weak momentum = downside risk
* ⚠️ Key support in focus: 6296–6298 zone
---
### 📊 Trade Idea (SHORT)
* 🎯 **Instrument:** ES Futures
* 📉 **Direction:** SHORT
* 💰 **Entry:** 6369.75 (near market)
* 🛑 **Stop Loss:** 6390.00
* 🎯 **Target:** 6300.00
* 📊 **Size:** 1 contract (\$50/pt)
* 💪 **Confidence:** 65%
* ⏰ **Timing:** Market Open
---
### ⚠️ Risk Watch
* 🌀 Low volume may cause chop
* 📉 Bounce risk near 6296–6298
* 🌍 Macro catalysts could shift flows
---
🔥 Hashtags for Reach 🔥
\#ESFutures #SP500 #FuturesTrading #DayTrading #SwingTrading #SPX #MarketOutlook #BearishSetup

Looks very exhausted need to reclaim some energyLooks very exhausted need to reclaim some energy. Marked few important levels.

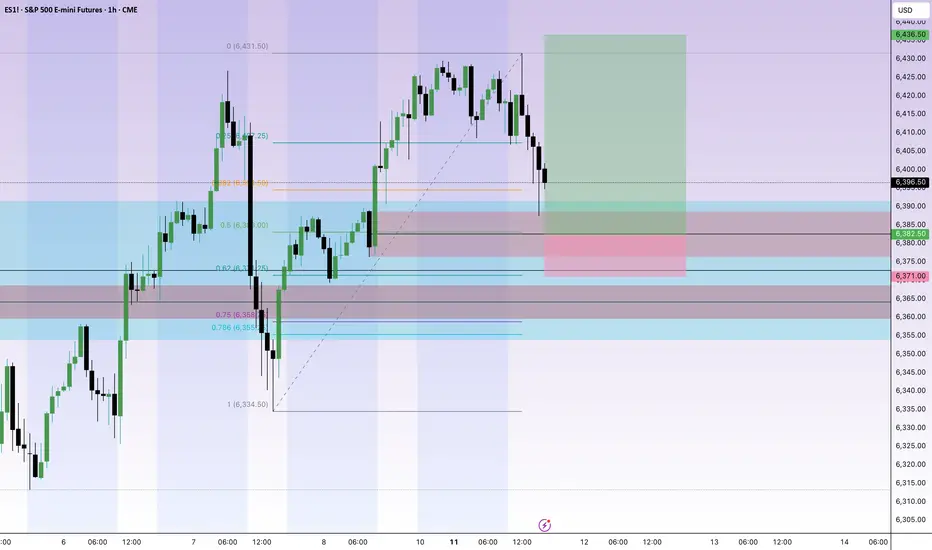
Jackson Hole FlipSetup: Short pullback to a rising trendline after a multi-week advance. Base case (black path) = choppy basementing → double bottom near trend support → sharp breakout and rapid mean reversion into the mid-6,400s. 🔁📌
Trade idea
• Instrument: ES1! (4H)
• Plan: Buy on breakout & hold / alternatively scale in on a clean retest of the trendline. 🟩
Key levels:
• 🛟 Trend support: 6,380–6,390 (double-bottom area)
• 🔓 Breakout trigger: 6,420 (clear close above = tactical entry)
• 🎯 Target 1: 6,450–6,460 (first take-profit band)
• 🎯 Target 2: 6,500–6,520 (upper channel test)
• ❌ Invalidation / stop: ≤ 6,350–6,360 (failure below this risks deeper retrace to ~6,265) 🛑
Rationale / catalysts:
• 🗣️ Jackson Hole / macro commentary could provide the directional impulse that favors risk-on flows.
• 🔀 Confluence of diagonal trendline + horizontal pivot increases probability of a stall-and-reverse.
• ⚡ Momentum: recent selloff has lost structure — favors mean reversion back to channel resistance.
Execution snippets:
• Long: enter > 6,420 (or scale in at 6,380–6,390 on tight risk)
• Stop: < 6,360 (adjust for position size & volatility)
• TP1: 6,450–6,460 — TP2: 6,500–6,520
• Risk: keep size small until breakout confirms; flip view if price closes below 6,350. ⚖️
Quick note: If price fails to hold the trendline and breaks 6,350 on momentum, rotate to a defensive stance — the path to ~6,265 becomes the higher-probability scenario. 🔻
Good luck — watch the breakout / retest closely and manage risk. 🙌📊

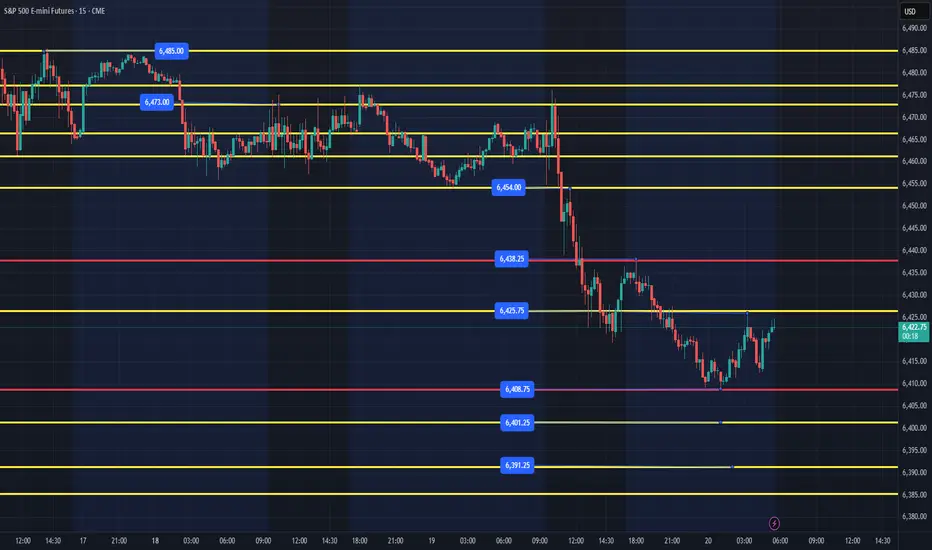
ES - August 21st - Daily Trade Plan - 15 min Chart 6:14am EST - I posted my original plan on the 30 min chart and wanted to post on my typical 15 min chart.
------------------------------------------------------------------------------------------------
I wrote a post on August 19th - Big Picture View of Price - You can see it in the related publication section to the right along with yesterday's trade plan that triggered a great short squeeze.
I wrote on August 19th - "6468 was the level that sold off in late July. Could this be the same level that causes another big sell off? I have NO idea, that is not my job.
I find levels that institutions step in and buy/sell at. I follow the institutions footprint and enter trades using my edge at predefined levels." - What happened the past 2 days of trading? We lost 100+ pts and institutions stepped in at 6362 for a short squeeze yesterday.
What will happen today? I have NO Idea, that is not my job. It is to find levels that institutions are accumulating and follow them when price goes up. When ES flushes like yesterday, you have to get out the way and let price reclaim a level above and enter and ride along. Every trader has their own entry and exit strategy. That is more important than just finding levels, unless you are a scalper!
---------------------------------------------------------------------------------------------------------------------
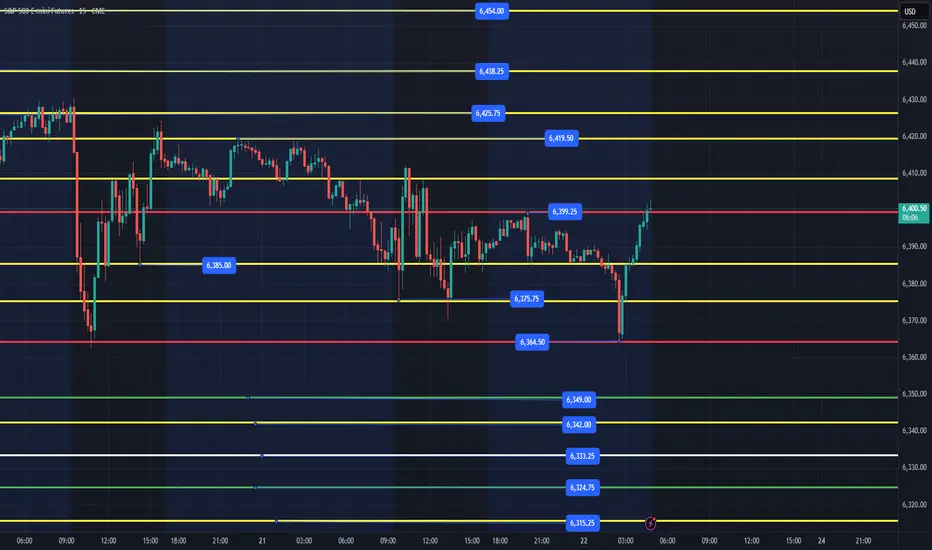
August 21st - Daily Trade Plan - 6am EST
Overnight price has been trading in a tight range between 6400 and 6420. IF, we are going to continue higher we need to reclaim 6420 and work up the levels with 6438, 6454 being the top targets above. Ideally, we see price flush 6400, recover and we can enter to move back up the range. IF, price cannot reclaim 6400-03, we will need to find support below at one of the levels in yellow (6384, 6373, 6362), reclaim and work back up to retest the 6400-03 level.
My lean is that IF, we cannot break above 6420, we have a high probability of retesting yesterday's 6362 low. IF, we cannot clear 6384 from below, I will be looking for reactions at 6349, 6342, 6333, for another squeeze higher.
After yesterday's flush, there will be FOMO from retail traders, and they will think the next short will be another 50+pts. We could easily trap shorts and snap back very fast at any of the levels below.
I will post an update at 10am EST.

ES - August 21st - Daily Trade PlanI wrote a post on August 19th - Big Picture View of Price - You can see it in the related publication section to the right along with yesterday's trade plan that triggered a great short squeeze.
I wrote on August 19th - "6468 was the level that sold off in late July. Could this be the same level that causes another big sell off? I have NO idea, that is not my job.
I find levels that institutions step in and buy/sell at. I follow the institutions footprint and enter trades using my edge at predefined levels." - What happened the past 2 days of trading? We lost 100+ pts and institutions stepped in at 6362 for a short squeeze yesterday.
What will happen today? I have NO Idea, that is not my job. It is to find levels that institutions are accumulating and follow them when price goes up. When ES flushes like yesterday, you have to get out the way and let price reclaim a level above and enter and ride along. Every trader has their own entry and exit strategy. That is more important than just finding levels, unless you are a scalper!
---------------------------------------------------------------------------------------------------------------------
August 21st - Daily Trade Plan - 6am EST
Overnight price has been trading in a tight range between 6400 and 6420. IF, we are going to continue higher we need to reclaim 6420 and work up the levels with 6438, 6454 being the top targets above. Ideally, we see price flush 6400, recover and we can enter to move back up the range. IF, price cannot reclaim 6400-03, we will need to find support below at one of the levels in yellow (6384, 6373, 6362), reclaim and work back up to retest the 6400-03 level.
My lean is that IF, we cannot break above 6420, we have a high probability of retesting yesterday's 6362 low. IF, we cannot clear 6384 from below, I will be looking for reactions at 6349, 6342, 6333, for another squeeze higher.
After yesterday's flush, there will be FOMO from retail traders, and they will think the next short will be another 50+pts. We could easily trap shorts and snap back very fast at any of the levels below.
I will post an update at 10am EST.
ES 08/21 — Key Levels - Short Bias - Setups - Fundamental Setups (A++ first)
1) SHORT — Retest-and-fail of supply (preferred)
• Zones: 6,433–36 or 6,445–47 (upper band 6,469–71).
• Trigger: 5-minute bearish close back below the shelf (no retest required); size to full only if a 15-minute bearish prints within the next 3×5m bars.
• Risk: entry +6–8 pts.
• TPs: +15 / +27 / +42 pts from entry (e.g., 6,445 → 6,430 / 6,418 / 6,403).
• Continuation guard: within 2×5m price must extend the low or print a lower high while failing to reclaim the shelf; otherwise cut ½ or scratch to BE.
2) SHORT — Breakdown & acceptance
• Trigger: 5m close < 6,418 and no immediate reclaim next bar.
• Risk: entry +6–8 pts.
• TPs: toward 6,406 → 6,392 → 6,382–76.
3) LONG — Only if promoted
• Trigger: 5m close & hold ≥ 6,436 (offers pull/flip; next bar holds).
• Risk: 6–8 pts (around 6,430).
• TPs: 6,451 → 6,459–60 → 6,471–72.
• Stand-down: lose 6,436 on a 5m close or see offers reload overhead.
Execution windows: 9:45–10:45 ET and 13:50–15:30 ET; avoid new risk 11:30–13:30 without momentum/confirmation.
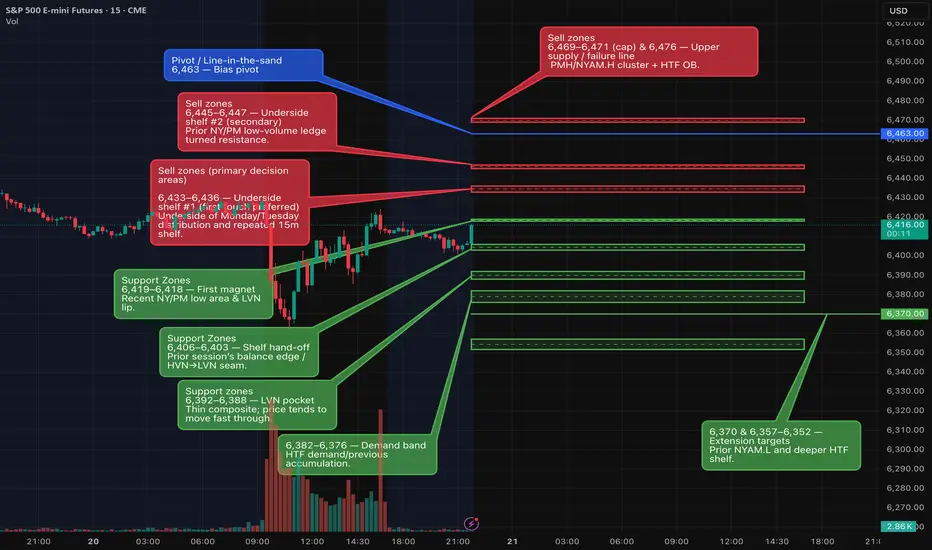
Key levels (from HTF → LTF)
• Pivot / line-in-sand: 6,463 (short bias while ≤ this).
• Supply / sell zones: 6,433–36, 6,445–47, 6,469–71 (cap), 6,476.
• Supports / magnets: 6,419–18, 6,406–03, 6,392–88, 6,382–76, 6,370, 6,357–52.
Fundamentals — Thu, Aug 21, 2025 (ET)
• 08:30 — Weekly Initial Jobless Claims (DOL). Weekly claims are published Thursdays at 8:30 a.m. ET. 
• 08:30 — Philadelphia Fed Manufacturing Index (Aug). Next release Aug 21, 8:30 a.m. ET. 
• 10:00 — Existing Home Sales (July, NAR). NAR schedules the Jul report for Thu, Aug 21 at 10:00 a.m. ET. 
• 10:00 — Conference Board LEI (July). Thu, Aug 21, 10:00 a.m. ET.  
• 10:30 — EIA Weekly Natural Gas Storage. Standard release Thursdays 10:30 a.m. ET; next release Aug 21.  
• S&P Global Flash US PMI (Aug). Scheduled for Thursday (check S&P calendar; release times shown in UTC on their site). 
• Jackson Hole Economic Policy Symposium begins (Aug 21–23). 2025 theme: “Labor Markets in Transition.” 
How I’ll adapt intraday
• A stronger-than-expected Claims/PMI/Philly Fed that lifts yields and the USD into 6,433–36 / 6,445–47 favors setup #1 (fade the pop).
• EHS/LEI at 10:00 can whipsaw a breakdown—prefer acceptance before pressing setup #2.
• If Jackson Hole headlines skew risk-on and we accept ≥ 6,436, switch to setup #3 toward 6,451/60/71–72.
A market in waitingAfter the selloff and rally in the S&P 500 daily chart, the expectation is the market is getting ready for Friday's comments by Powell. This would mean that Thursday would trade inside the daily range of Wednesday.

Day 13 — Trading Only S&P Futures | +$131 Relief BounceWelcome to Day 13 of Trading Only S&P Futures!
Today I thought we might get a relief rally after the market bounced off 6410. I took the 9:30 long signal but got stopped out as the market broke down further. Instead of forcing trades, I waited for cleaner setups and caught small bounces off 6388 and 6374.
When my second attempt at 6374 failed, I stayed patient. By 11:20 we finally got buy signals, plus confirmation with doji and BFC candles. That’s when I went long, rode the bounce, and wrapped up the day with +131.49.
Overall, a solid day where patience paid off.
📰 News Highlights
S&P 500 FALLS FOR A FOURTH DAY, NASDAQ POSTS BACK-TO-BACK LOSSES AS TECH SHARES EXTEND SLIDE
🔔 VX Algo Signals (9:30am – 2pm EST)
8:00 AM Market Structure flipped bearish on VX Algo X3!
9:30 AM VXAlgo NQ X3 Buy Signal
9:32 AM VXAlgo ES X3 Sell Signal
11:00 AM VXAlgo ES X1 Buy signal (double signal)
12:00 PM VXAlgo NQ X1DD Sell Signal
12:16 PM Market Structure flipped bullish on VX Algo X3!
1:40 PM VXAlgo NQ X1DD Buy Signal
🔑 Key Levels for Tomorrow
Above 6445 = Flip Bullish
Below 6430 = Remain Bearish

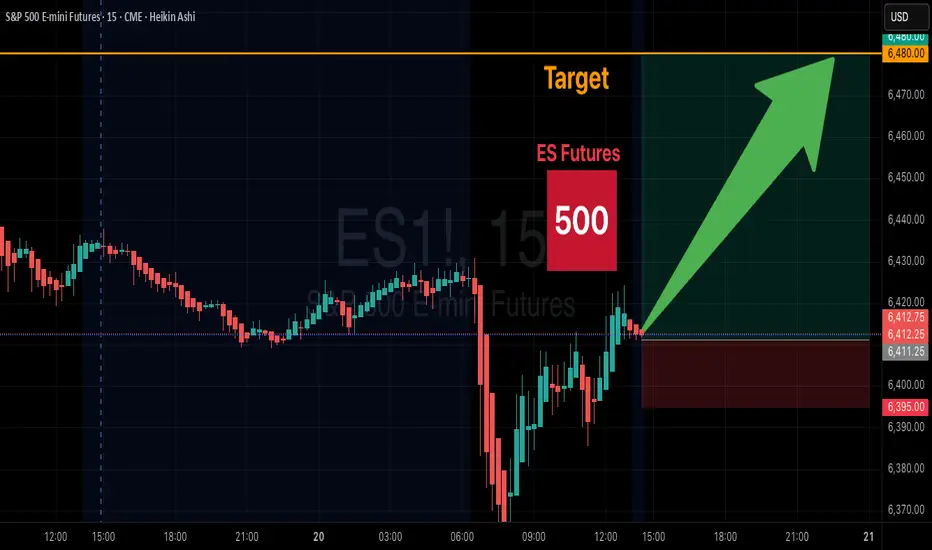
ES Futures Trade Setup – Long Opportunity
🎯 **ES Futures Trade Setup – Long Opportunity**
📌 **Instrument:** ES
📈 **Direction:** LONG
💰 **Entry Price:** 6415.50
🛑 **Stop Loss:** 6353.98 (1 ATR below entry)
🏹 **Take Profit:** 6480.00 (\~64.5 points)
📏 **Position Size:** 3 contracts
💪 **Confidence:** 65%
⏰ **Timing:** Enter at market open
⚠️ **Key Risks:** Mixed short-term signals may cause volatility. Move below 6400 could invalidate trade.
✅ **Rationale:** Long-term bullish trend remains intact; favorable risk-reward despite short-term bearish momentum.
ES Bullish continuationHelly traders, I have seen quite a few PD arrays to anticpate long positions at the points mentioned in the chart, have your nerves strong and see for price action if your analysis say bthe same, get in! Cheers and good luck everyone.
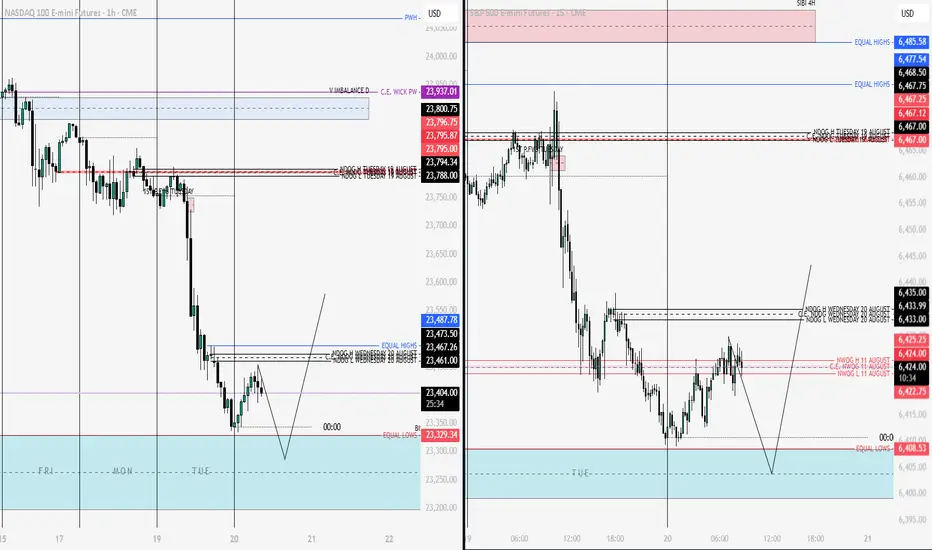
Nq & Es Analysis 20-08-2025Good morning everyone,
Today we are trading within a discount area, and therefore I will be looking for long opportunities targeting the equilibrium (50% of the range) measured from last week’s highs (ATHs). In addition to that, my main focus is on the imbalances left behind by yesterday’s price action, which remain an important target 🎯. The equal highs I have marked on the chart are also in play — provided that price finds support within the blue zone just below the equal lows.
Naturally, I will only look for this opportunity once the market opens after 09:30 AM NY time.
Wishing you all a disciplined and successful trading session.
⚠️ Disclaimer: This analysis reflects personal market observations and is for educational purposes only. It does not constitute financial advice.
ES - August 20th - Daily Trade PlanYesterday, we followed the trade plan, and the levels were very well respected. You can find this under August 19th Daily Trade Plan - Also link to the right under related publications.
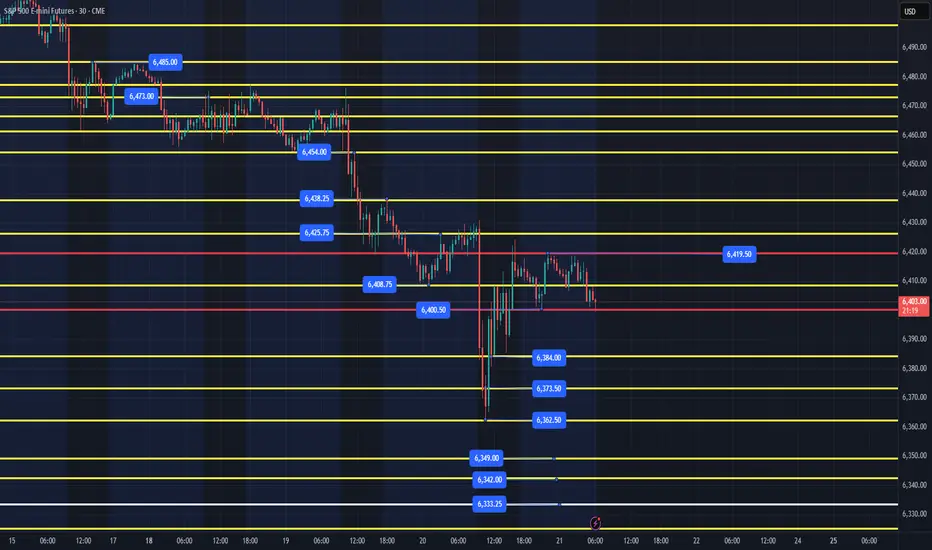
August 20th - Trade Plan - 5:35am EST
Overnight session high was 6438.25 and the low was 6408.75. This 30 pt zone has been consolidating overnight and we need price to flush the overnight low and reclaim or we need to clear the 6438.25 level, back test and then enter for a move to 6454 as first resistance level to take profits.
IF, we cannot flush and reclaim 6408, the next levels we are looking for price to react at are in yellow below, with a reclaim of the 6408 level being bullish. I like 6391 as best next level to flush and reclaim for a back test of 6408 and potentially move up the levels. IF, price is selling off and we do not reclaim 6391, 6369, 6350, 6333 are other key levels to look for price to flush and reclaim the next immediate level above price at that time.
I will post an update at 10am EST based on the NYSE open.
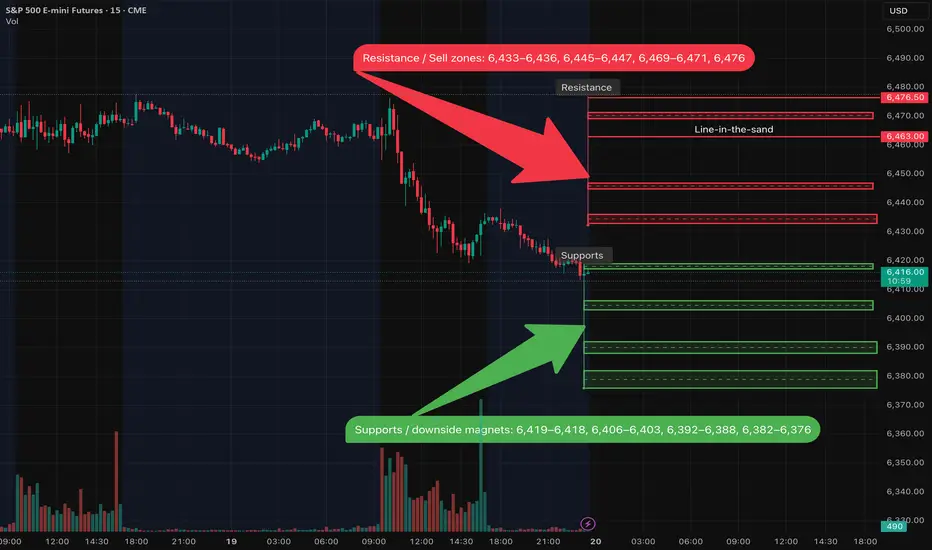
S 08/20 — Short bias below, Key Levels (watch FOMC minutes)Overview
Higher-timeframe trend has shifted lower. After failing at ~6,476, price broke the 6,446 shelf and printed a new low near 6,419 with expanding volume. As long as we remain below 6,463, I keep a short bias and will fade bounces into supply.
Key Levels
• Line-in-the-sand: 6,463
• Resistance / Sell zones: 6,433–6,436, 6,445–6,447, 6,469–6,471, 6,476
• Supports / downside magnets: 6,419–6,418, 6,406–6,403, 6,392–6,388, 6,382–6,376
Primary Plan — Bearish continuation
• Prefer selling failed retests into 6,433–6,436 or 6,445–6,447.
• Targets: first back to 6,419–6,418, then 6,406–6,403, and if momentum persists 6,392–6,388 / 6,382–6,376.
• Confirmation I want to see: intraday rejection wicks at the zone, momentum rolling over, and sellers stepping back in.
Alternative — Breakdown
• If price accepts below 6,418, I’ll look for continuation toward 6,403, then 6,392 / 6,376.
Invalidation / Neutralization
• Reclaiming 6,463 neutralizes the immediate short bias.
• Acceptance ≥ 6,471–6,476 opens squeeze risk toward 6,491 / 6,500; I’d stand aside on shorts until structure turns back down.
Event Risk (ET) — Wed 08/20
• 07:00 MBA Mortgage Applications
• 10:30 EIA Weekly Petroleum Status Report
• 13:00 U.S. 20-Year Treasury Auction
• 14:00 FOMC Minutes (Jul meeting)
Note: Expect headline-driven volatility around 14:00—I avoid initiating new positions into the release.
Posting Notes
This idea reflects levels visible on 1D/4H/1H (with 30m/15m for execution). I’ll update intraday if acceptance/rejection flips at the zones.
Sellers are in control but is it sustainableSettlers in the daily chart of the S&P 500 appeared to be in control based on Tuesday's movement and continued weakness in the early part of the Asia session. The charge is can this downward movement be sustainable. The next objective to the downside is 6410.

Day 12 — Trading Only S&P Futures | Big Loss LessonWelcome to Day 12 of Trading Only S&P Futures!
Today was a tough one. I started off leaning bearish after NVDA flashed a strong sell signal — chips usually lead the market — so I went in heavy shorting 6461. Got stopped out at 6471 for a big hit, and of course right after, the market flushed under 6450.
Tried again, but with poor entries, I was quickly down -592 on the day. At that point, I reminded myself of one thing: live to fight another day. Instead of forcing it, I scaled back, waited for cleaner setups, and clawed some of it back to finish at -295.
🔔 VX Algo Signals (9:30am – 2pm EST)
9:30 AM Market Structure flipped bearish on VX Algo X3!
9:42 AM VXAlgo NVDA X7 Sell Signal
10:30 AM Market Structure flipped bullish on VX Algo X3!
11:00 AM Market Structure flipped bearish on VX Algo X3!
11:20 AM VXAlgo ES X1 Buy signal
12:10 PM VXAlgo NQ X1DD Sell Signal
1:20 PM VXAlgo ES X1 Buy signal (double buy)
🔑 Key Levels for Tomorrow
Above 6465 = Flip Bullish
Below 6455 = Remain Bearish

AMP Futures | New 1-second update interval for bar replay.In this idea we will demonstrate how to access the new 1-second update interval for bar replay using TradingView.
