S 08/20 — Short bias below, Key Levels (watch FOMC minutes)Overview
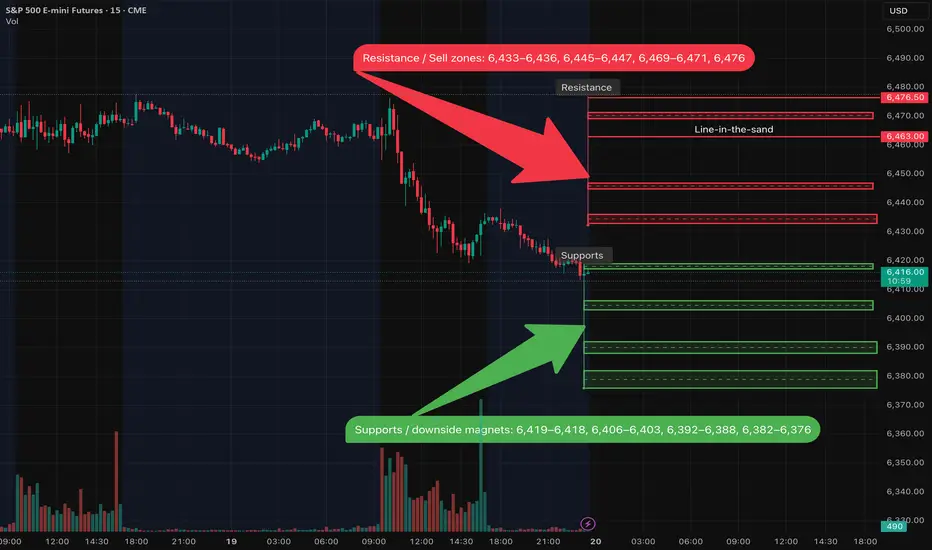
Higher-timeframe trend has shifted lower. After failing at ~6,476, price broke the 6,446 shelf and printed a new low near 6,419 with expanding volume. As long as we remain below 6,463, I keep a short bias and will fade bounces into supply.
Key Levels
• Line-in-the-sand: 6,463
• Resistance / Sell zones: 6,433–6,436, 6,445–6,447, 6,469–6,471, 6,476
• Supports / downside magnets: 6,419–6,418, 6,406–6,403, 6,392–6,388, 6,382–6,376
Primary Plan — Bearish continuation
• Prefer selling failed retests into 6,433–6,436 or 6,445–6,447.
• Targets: first back to 6,419–6,418, then 6,406–6,403, and if momentum persists 6,392–6,388 / 6,382–6,376.
• Confirmation I want to see: intraday rejection wicks at the zone, momentum rolling over, and sellers stepping back in.
Alternative — Breakdown
• If price accepts below 6,418, I’ll look for continuation toward 6,403, then 6,392 / 6,376.
Invalidation / Neutralization
• Reclaiming 6,463 neutralizes the immediate short bias.
• Acceptance ≥ 6,471–6,476 opens squeeze risk toward 6,491 / 6,500; I’d stand aside on shorts until structure turns back down.
Event Risk (ET) — Wed 08/20
• 07:00 MBA Mortgage Applications
• 10:30 EIA Weekly Petroleum Status Report
• 13:00 U.S. 20-Year Treasury Auction
• 14:00 FOMC Minutes (Jul meeting)
Note: Expect headline-driven volatility around 14:00—I avoid initiating new positions into the release.
Posting Notes
This idea reflects levels visible on 1D/4H/1H (with 30m/15m for execution). I’ll update intraday if acceptance/rejection flips at the zones.
ESH2026 trade ideas
Sellers are in control but is it sustainableSettlers in the daily chart of the S&P 500 appeared to be in control based on Tuesday's movement and continued weakness in the early part of the Asia session. The charge is can this downward movement be sustainable. The next objective to the downside is 6410.

Day 12 — Trading Only S&P Futures | Big Loss LessonWelcome to Day 12 of Trading Only S&P Futures!
Today was a tough one. I started off leaning bearish after NVDA flashed a strong sell signal — chips usually lead the market — so I went in heavy shorting 6461. Got stopped out at 6471 for a big hit, and of course right after, the market flushed under 6450.
Tried again, but with poor entries, I was quickly down -592 on the day. At that point, I reminded myself of one thing: live to fight another day. Instead of forcing it, I scaled back, waited for cleaner setups, and clawed some of it back to finish at -295.
🔔 VX Algo Signals (9:30am – 2pm EST)
9:30 AM Market Structure flipped bearish on VX Algo X3!
9:42 AM VXAlgo NVDA X7 Sell Signal
10:30 AM Market Structure flipped bullish on VX Algo X3!
11:00 AM Market Structure flipped bearish on VX Algo X3!
11:20 AM VXAlgo ES X1 Buy signal
12:10 PM VXAlgo NQ X1DD Sell Signal
1:20 PM VXAlgo ES X1 Buy signal (double buy)
🔑 Key Levels for Tomorrow
Above 6465 = Flip Bullish
Below 6455 = Remain Bearish

AMP Futures | New 1-second update interval for bar replay.In this idea we will demonstrate how to access the new 1-second update interval for bar replay using TradingView.

Nq & Es After Market 19-08-2025As we discussed previously, the market was trading within a premium zone, and indeed price moved lower. On the Nasdaq (NQ), we saw last week’s low being taken out, while on the S&P (ES) price has now entered a discount area within a daily FVG (Fair Value Gap). This may provide potential long opportunities during the New York afternoon session.
I deliberately avoided giving a firm directional call previously, even though I suspected price might fall, because trading is not about what we believe—it’s about what the charts show us.
Tomorrow, I will return with clearer scenarios and more directional guidance.
⚠️ Disclaimer: This analysis reflects personal market observations and is for educational purposes only. It does not constitute financial advice.

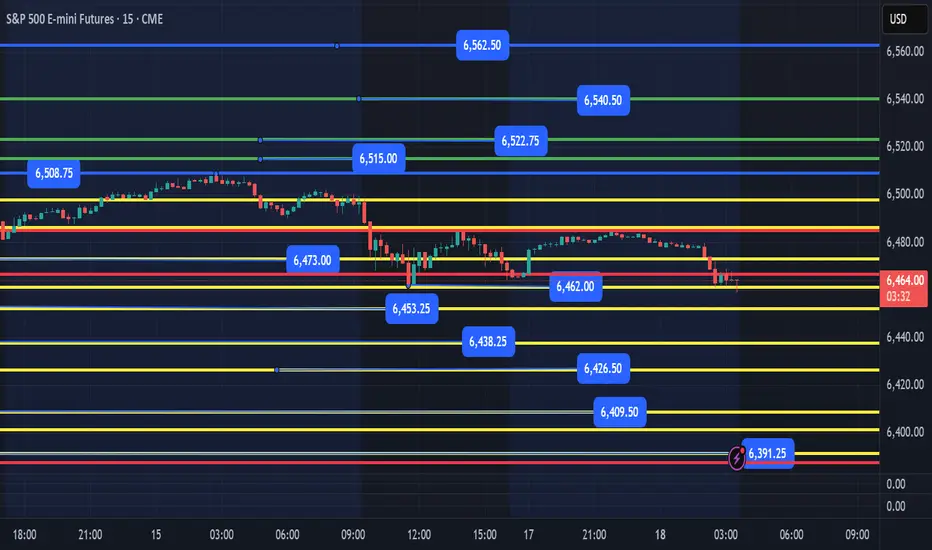
ES - August 19th - Daily Trade PlanLast night I wrote a post "ES-August 19th- Big Picture View of Price" and you can find it in the related publications to the right.
I said " You can see that we are in a range of 6452-6508. IF, price loses the support of 6452, we will probably need to test 6390 or below. IF, price can regain control above 6472-76, we should retest 6508 then 6522, 6541."
At 6:15pm in the opening session we popped to 6476.75 and rejected. I had mentioned yesterday that 6476 was a massive resistance. As I type this at 2:01am EST price has come back down to the bottom of the range at 6454 with the European open coming up in the next hour.
I also stated last night the following " Without a catalyst, news or some other reason, price will most likely just continue to chop around overnight between 6453 - 6485. We need price to flush a lower level like 6450-53 to continue higher. IF, price loses that level and can't clear 6473-76, I believe we could continue lower pretty fast in which I would get out the way and let price build a new support level and reclaim the next level in yellow above that price."
Price is still chopping in this range and I anticipate a move out of the range today, one way or another. Today's levels have not changed since yesterday's trade plan. You can see the related publication to the right.
We have had a tight range between 6454-6477 overnight and price broke yesterday's low and is currently trying to move higher. Pretty straight forward from here. We need to clear 6465 to retest the overnight high at 6477. IF, price loses 6450-53, We would then be looking for a nice reclaim of 6461 level to move higher IF, price does not reclaim the 6465 level on the back test, we will most likely keep moving lower with 6439, 6426, 6409, 6390 are the next levels below with 6390 the weekly low from last week and should see a good pop back up the levels above. We can't keep moving higher unless we reclaim 6477 level.
We could continue to chop around today until a news catalyst breaks the range and moves us one way or another. As I have stated, I like price to flush 2-3 levels, scare the retail trader, then short squeeze higher. The yellow levels should help you navigate price and a reclaim of a level is a good way to get a quick 10+ pts to the next level.
Looking for short on ESI never like to pick tops in markets. However, as we sit just below all-time highs, I see far more downside risk in this market than I do upside potential. Whether it's tariffs, prolonged wars, increasing inflation, or the fading shine of AI valuations, I struggle to see how we can sustain these PE ratios.
The last few trading days have been very low volatility, but the interesting thing I'm seeing is significant negative Cumulative Volume Deltas (CVDs) in the last hour of trading recently. This is telling me that we are not pushing these all-time-highs with strength, and that the market is cautious at the moment.
I don't think we'll push straight down, but I will look to take and hold on to a short if we get a pop that can't be sustained.

ES Analyses 08/19 Rejection short from 6479–6485 (OB + PDH)Fundamentals (what can move ES)
• 08:30 ET – U.S. New Residential Construction (Housing Starts/Permits). First move risk right at the print; can nudge yields and risk appetite. We’ll let the initial spike settle and then act on the HTF levels below. 
⸻
Key levels from your charts
Numbers rounded to the quarter where needed.
• PDH: 6484.25
• PDL: 6456.00
• ONH: 6475.25
• ONL: 6462.00
• RTH VWAP (today): 6466.50
• PMH / Asia H cluster: 6470.5–6471.75
• 30-min supply / OB: 6479–6485 (overlaps PDH)
• Liquidity/defense zone (“strong low”/Mon swing): 6452–6456
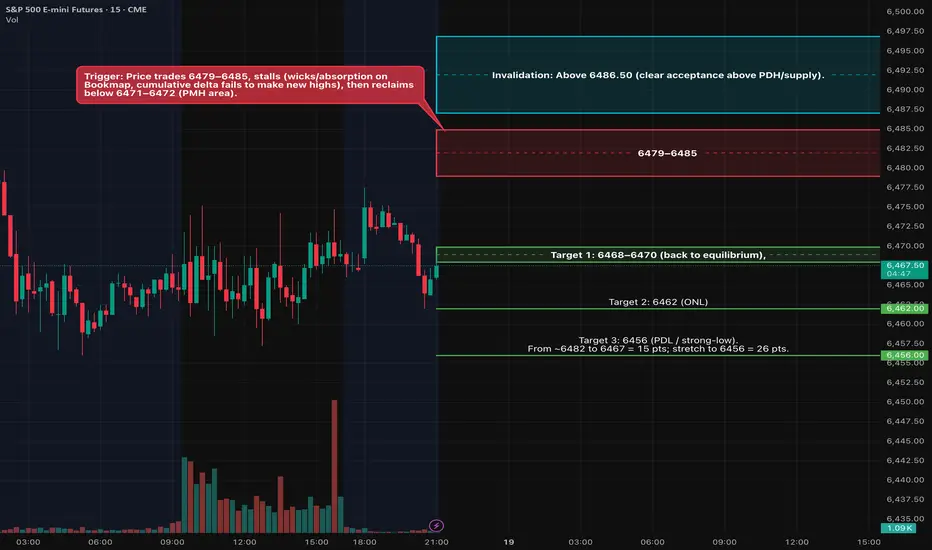
Think of 6468–6472 as the intraday “equilibrium” band we’ve been ping-ponging around; acceptance away from this band is what should start the 15+ pt drive.
Context: We press into the 30-min supply shelf that capped NYPM today.
Trigger: Price trades 6479–6485, stalls (wicks/absorption on Bookmap, cumulative delta fails to make new highs), then reclaims below 6471–6472 (PMH area).
Entry style: Stop-market on the reclaim or limit into a micro pullback after the failed pop.
Invalidation: Above 6486.50 (clear acceptance above PDH/supply).
Targets:
6468–6470 (back to equilibrium),
6462 (ONL),
6456 (PDL / strong-low).
From ~6482 to 6467 = 15 pts; stretch to 6456 = 26 pts.
Order-flow tells: Offers replenish 6480–6485; iceberg/absorption on up-ticks; delta divergence into the level.
Timing
08:30 ET data: stand aside for the first 2–5 minutes; let the impulse show its hand, then look for our triggers.
Federal Reserve Bank of New York
NY AM window: 09:45–11:30 ET.
NY PM window: 13:30–15:30 ET (if morning doesn’t give clean structure).
Neutral zone environmentThe neutral zone environment on the S&P 500 daily chart implies a sideways move for Tuesday.

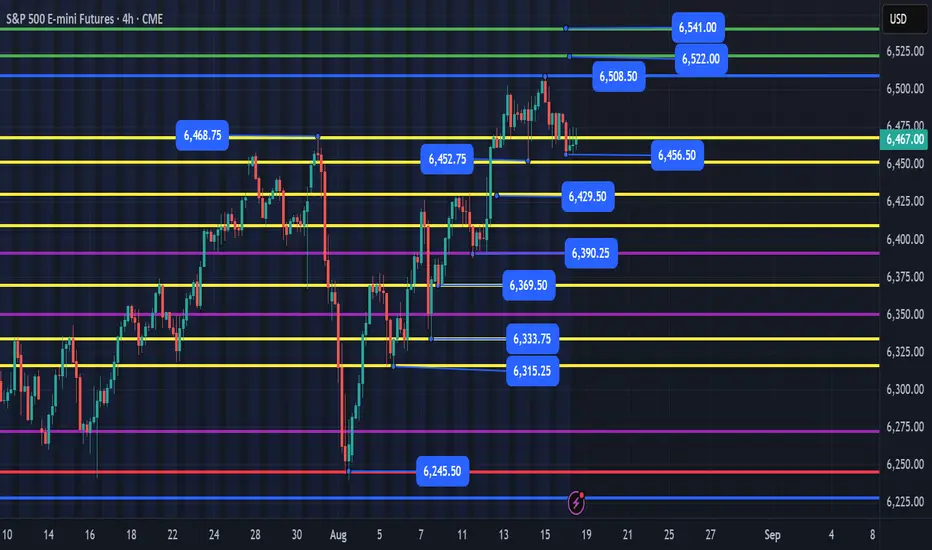
ES - August 19th - Big Picture View of PriceI wanted to post a 4hr chart of ES since we broke out in June and hit the 6245 zone July 1st. As you can see there are some clear levels of institutional buying. 6245 became support since July 2nd and we have tested this level 3X with last being August 1st. Each time institutions bought at this level and have been selling at higher prices. You can see that on July 31st we hit 6468.75 and price sold off nearly 225 points and buyers stepped back in on August 1st at 6245 and the cycle begins with selling at resistance and buying at supports of 6315, 6333, 6390, 6453-6456. WHY has price been very choppy in this 6456-6472 area? Price is either accumulating or distributing, but we never know until price loses a big support or resistance.
You can see that we are in a range of 6452-6508. IF, price loses the support of 6452, we will probably need to test 6390 or below. IF, price can regain control above 6472-76, we should retest 6508 then 6522, 6541.
6468 was the level that sold off in late July. Could this be the same level that causes another big sell off?
I have NO idea, that is not my job.
I find levels that institutions step in and buy/sell at. I follow the institutions footprint and enter trades using my edge at predefined levels.
I will be posting my Daily Trade Plan for August 19th before 8am EST. Without a catalyst, news or some other reason, price will most likely just continue to chop around overnight between 6453 - 6485. We need price to flush a lower level like 6450-53 to continue higher. IF, price loses that level and can't clear 6473-76, I believe we could continue lower pretty fast in which I would get out the way and let price build a new support level and reclaim the next level in yellow above that price.
Day 11 — Trading Only S&P Futures — Mixed Signals, +$199Welcome to Day 11 of Trading Only S&P Futures!
Today was all about adapting and not forcing trades. I’ve noticed I usually perform best later in the day, so I’ve been starting with smaller contracts to warm up. Profits started rolling in, but things felt different — market makers kept flipping structure and trying to trap traders.
I was expecting more downside, but once I saw the MM games, I decided to protect profits and lock in +$199.20 instead of being greedy.
📰 News Highlights
STOCKS END MOSTLY FLAT TO START THE WEEK AS INVESTORS LOOK AHEAD TO POWELL SPEECH, RETAIL EARNINGS
🔔 VX Algo Signals (9:30am – 2pm EST)
7:01 AM Market Structure flipped bullish on VX Algo X3!
9:58 AM Market Structure flipped bearish on VX Algo X3!
9:58 AM VXAlgo ES X3DD Sell Signal
11:30 AM VXAlgo NQ X1DD Sell Signal
12:30 PM Market Structure flipped bullish on VX Algo X3!
12:50 PM VXAlgo NQ X1DD Sell Signal
2:00 PM Market Structure flipped bullish on VX Algo X3!
🔑 Key Levels for Tomorrow
Above 6460 = Remain Bullish
Below 6450 = Bearish

ideia para o S&P500 18/8Price made a new lower this morning on a 2H, but on a LTF its a balanced buy, theres no agrressive or FVG in a LTF. my key level for buys is the price keep above the last agressive buy and old time high on 6.470 that coincidently and probably will be the VWAP. If the price goes above and rejects 6.470, i'll think on sell.

ES - August 18th - Daily Trade Plan3:30am EST - Daily Trade Plan Update
We had a tight range between 6467-6484 overnight and price broke the overnight low and have found buyers at the 6462 level. Pretty straight forward from here. We need to clear 6472 to retest the overnight high. IF, price loses 6460 we will most likely retest the 6453 level which was Friday's low. We would then be looking for a nice reclaim of this level to move higher. IF, price does not reclaim the 6460 level on the back test, we will most likely keep moving lower with 6429, 6408, 6390 are the next levels below with 6390 the weekly low from last week and should see a good pop back up the levels above. We can't keep moving higher unless we reclaim 6472 level.
Initial Plan below - Also can be seen in the related publication section to the right.
Our first support down is 6462 then 6453. Ideally, we can flush one of these levels, reclaim and move higher with this week's targets being 6522, 6540, 6562, then 6588.
IF, price does pullback and can flush either 6452, 6426, 6390 as key areas to be tested and try to keep the bullish trend in play. IF, we lose 6390, that would be concerning in the short term, and price will need to find another yellow support line below for a reclaim back up the levels.
Above 6390 and we should continue up the levels of 6522, 6540 with very bullish case up to 6588.
I have posted my weekly view and can be viewed by clicking the link under related publications. We did meet our weekly targets last week as discussed in the weekly plan.
ES (S&P 500 Futures) - Week Plan Aug 18–22Context (W/D/4H/1H/30M): ES is consolidating just under 6,500. Price is boxed roughly 6,466 ↔ 6,504/12 with a cluster of highs above and recurring demand tests below.
Key Levels (zones, not single ticks):
Resistance: 6,504–6,512 (near-term lid). Above that: 6,520–6,550 (weekly supply/“weak high”).
Decision level: 6,492–6,495 (where control often flips intraday).
Supports: 6,464–6,466 (first support) → 6,436–6,440 → 6,380–6,395 (deeper support).
How to read it:
Bull path: A firm break and hold above 6,504 favors a push toward 6,520 → 6,535 → 6,550.
Bear path: Failure at 6,495 or a clean break below 6,464 opens 6,440 → 6,390.
If price stays between 6,466 and 6,504, expect range behavior until a catalyst pushes it out.
Scenarios (next week):
Range continues: Chop between 6,466–6,512 until mid-week events.
Upside break: Hold above 6,504 → test 6,520–6,550 (watch for reaction there).
Downside break: Lose 6,464 with momentum → 6,440, then 6,390 if pressure persists.
Key events (ET):
Wed: Federal Reserve meeting minutes (afternoon).
Thu: Weekly claims; flash PMIs; existing home sales (morning block).
Thu–Sat: Jackson Hole economic symposium (watch for policy remarks).
Notes: Levels are zones and may see initial reactions before acceptance or rejection. This post is for market commentary/education only.

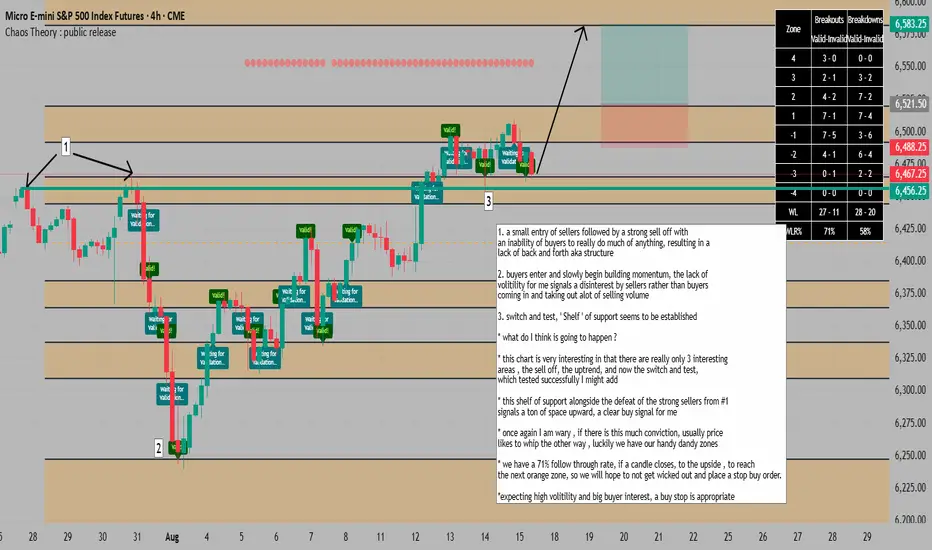
clear uptrend, with a resistance turned support (confirmed)=BUY1. a small entry of sellers followed by a strong sell off with
an inability of buyers to really do much of anything, resulting in a
lack of back and forth aka structure
2. buyers enter and slowly begin building momentum, the lack of
volitility for me signals a disinterest by sellers rather than buyers
coming in and taking out alot of selling volume
3. switch and test, ' Shelf ' of support seems to be established
* what do I think is going to happen ?
* this chart is very interesting in that there are really only 3 interesting
areas , the sell off, the uptrend, and now the switch and test,
which tested successfully I might add
* this shelf of support alongside the defeat of the strong sellers from #1
signals a ton of space upward, a clear buy signal for me
* once again I am wary , if there is this much conviction, usually price
likes to whip the other way , luckily we have our handy dandy zones
* we have a 71% follow through rate using the chaos theory indicator, if a candle closes, to the upside , to reach the next orange zone, so we will hope to not get wicked out and place a stop buy order.
*expecting high volitility and big buyer interest, a buy stop is appropriate
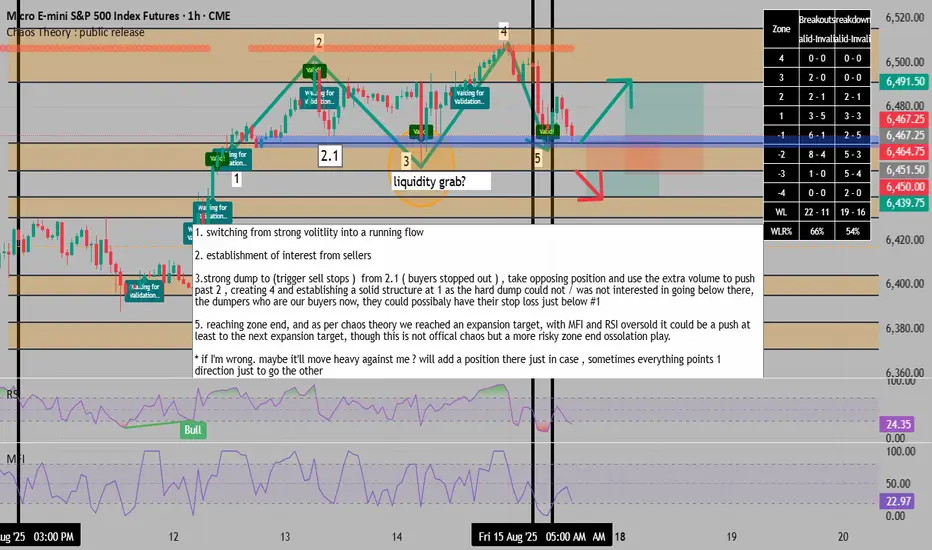
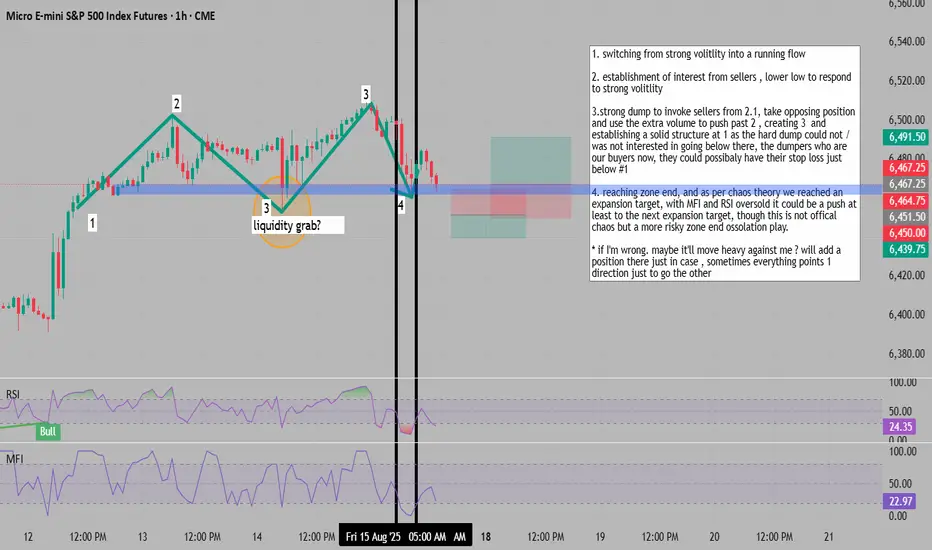
return to liquidity grab signals bull, else bear1. switching from strong volitlity into a running flow
2. establishment of interest from sellers
3.strong dump to (trigger sell stops ) from 2.1 ( buyers stopped out ) , take opposing position and use the extra volume to push past 2 , creating 4 and establishing a solid structure at 1 as the hard dump could not / was not interested in going below there, the dumpers who are our buyers now, they could possibaly have their stop loss just below #1
5. reaching zone end, and as per chaos theory we reached an expansion target, with MFI and RSI oversold it could be a push at least to the next expansion target, though this is not offical chaos but a more risky zone end ossolation play.
* if I'm wrong. maybe it'll move heavy against me ? will add a position there just in case , sometimes everything points 1 direction just to go the other
* Indicators used :
- Chaos theory : available for free on my script page
- RSI and MFI : available for free from community scripts
ES - August 17/18 - Daily Trade PlanI have posted my weekly view and can be viewed by clicking the link under related publications. We did meet our weekly targets last week as discussed in the weekly plan.
The plan for Sunday evening and into Monday is still looking for higher prices. Our first support down is 6462 then 6453. Ideally, we can flush one of these levels, reclaim and move higher with this week's targets being 6522, 6540, 6562, then 6588.
IF, price does pullback and can flush either 6452, 6426, 6390 as key areas to be tested and try to keep the bullish trend in play. IF, we lose 6390, that would be concerning in the short term, and price will need to find another yellow support line below for a reclaim back up the levels.
Above 6390 and we should continue up the levels of 6522, 6540 with very bullish case up to 6588.
I will post an update Monday before 8am EST with overnight session price action and what we should be looking for during the NYSE session.
Please follow for notifications when I post my daily trade plan and any updates throughout the session.

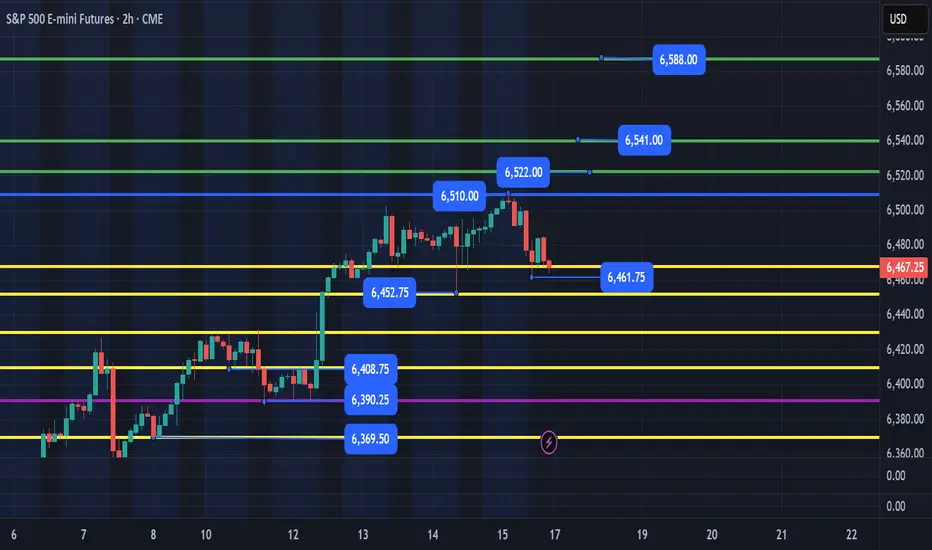
ES - Weekly Trading Plan - August 18th-22ndLast week I posted that I was looking for 6452, 6482 as my weekly main targets. The high of the week was 6510. You can see on the 2hr chart that 6452.75 was back tested with strong institutional buying and then we continued higher. Price ended the week with a mild pullback to the 6461 level.
Plan for next week is that we need to hold 6390, 6369. for us to continue higher. Ideally, we do not lose 6452 with 6426 being the breakout and 6390 the low of the week.
IF, price does pullback and can flush either 6452, 6426, 6390 as key areas to be tested and try to keep the bullish trend in play. IF, we lose 6390, that would be concerning in the short term, and price will need to find another yellow support line below for a reclaim back up the levels.
Above 6390 and we should continue up the levels of 6522, 6541 with very bullish case up to 6588.
I will post a daily trade plan this week on the 15 min chart and will follow my plan to find areas that we should get level to level moves upwards.
Follow so you can be notified when my daily trade plan is released.
Liquididty grab points to potential big money positioning 1. **Pattern Recognition**: Identifying a transition from strong volatility into a running flow pattern.
2. **Seller Interest Established**: Lower low formation in response to the initial volatility spike, confirming seller presence at this level.
3. **Liquidity Grab and Reversal**: Strong dump designed to trigger sellers identified in point 2. Take the opposing (long) position here, using the increased volume from triggered sellers to push price past level 2, creating level 3. This establishes solid structure at level 1, as the dump showed no interest in breaking below it. The dumpers (now turned buyers) likely have stop losses positioned just below level 1.
4. **Zone End Target**: Approaching zone end with expansion target reached per chaos theory principles. With both MFI and RSI showing oversold conditions, expecting at minimum a push to the next expansion target. Note: This is an unofficial chaos theory application - a higher risk zone end oscillation play.
**Risk Management Note**: If the analysis is wrong, price may move heavily against the position. Consider adding a hedge position as insurance, as markets sometimes present all signals pointing in one direction only to reverse completely.
Neutral zone tradeThe structure in the S&P 500 daily chart is a neutral zone trade. The market is waiting for the outcome of the Alaskan meeting between Russia and United States.

Day 10 — Trading Only S&P Futures | $200+ Goal HitWelcome to Day 10 of Trading Only S&P Futures!
After waking up super early and not getting back to sleep, I spent most of my morning going through 13F filings to see where hedge funds are putting their money. The trading day started strong — market structure flipped bearish and price action followed perfectly.
I missed the exact market bottom by just 2 points, but patience paid off. I eventually caught the reversal back to the 5-min MOB and closed the day with a +212.54 gain — hitting the $200 daily goal I’ve been aiming for all week.
📈 What you’ll learn
How to stay patient after missing a perfect entry
Using market structure & MOB zones together
Why having a daily profit target helps discipline
Combining trading with ongoing market research
⏰ Timestamps
0:00 — Intro & Day 10 Recap
0:50 — Early Start & Hedge Fund 13F Research
1:40 — Market Structure Sets the Tone
2:10 — Missing the Bottom by 2 Points
3:00 — Catching the Reversal at 5-min MOB
4:00 — Key Levels for Tomorrow
4:30 — Closing Thoughts
📰 News Highlights
FED CHAIR CANDIDATE MARC SUMERLIN SUPPORTS 50BPS RATE CUT DUE TO INVERSION OF CURVE
🔔 VX Algo Signals (9:30am – 2pm EST)
8:30 AM Market Structure flipped bearish on VX Algo X3!
9:39 AM VXAlgo Market Structure flipped bearish - 9:31
9:40 AM VXAlgo NQ X1DD Sell Signal
11:00 AM VXAlgo NQ X1DD Sell Signal
12:40 PM VXAlgo NQ X1DD Sell Signal
12:50 PM VXAlgo NQ X3 Buy Signal
1:30 PM Market Structure flipped bullish on VX Algo X3!
🔑 Key Levels for Tomorrow
Above 6460 = Remain Bullish
Below 6440 = Bearish

ID: 2025 - 0126.5.2025
Trade #12 of 2025 executed.
Trade entry at 71 DTE (days to expiration).
Excellent fills this morning, well under mid.
Target profit is 5% ROI
Happy Trading!
-kevin

ES - August 15th - Daily Trade Plan5:45am EST - Daily Trade Plan - Overnight Session
Our overnight session opened around 6488 and have grinded up to 6508 (6pts shy of original target) and are currently back testing the 6488-6492 support that was a strong resistance the past couple of days. I expect price to hold the overnight session support in red; flush then reclaim this level to continue to our targets in green above (6514, 6525). We really want to hold the next level down at the 6473 yellow support and trendline in white. Below there we will want to get out of the way, let price find a level in yellow, flush, build a base and rally after reclaiming the nearest yellow support/resistance line on the chart.
As mentioned, this week it is OPEX today. Can be a tricky trading day, so wait for price to come to the levels and work the plan as price dictates the direction it wants to go.
I will update around 10am after NYSE open settles out.
