ES : Short levelThe level has been activated, so you can short it. I have slightly edited it since last time. It is best to scalp or pip it; I cannot promise any significant movement. Be careful when trading on news or at market close/open.
ESH2020 trade ideas
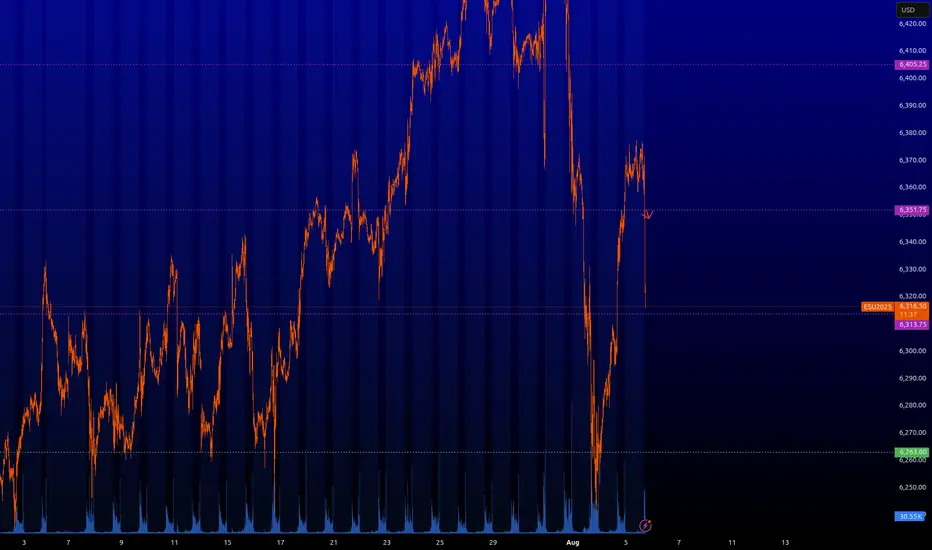
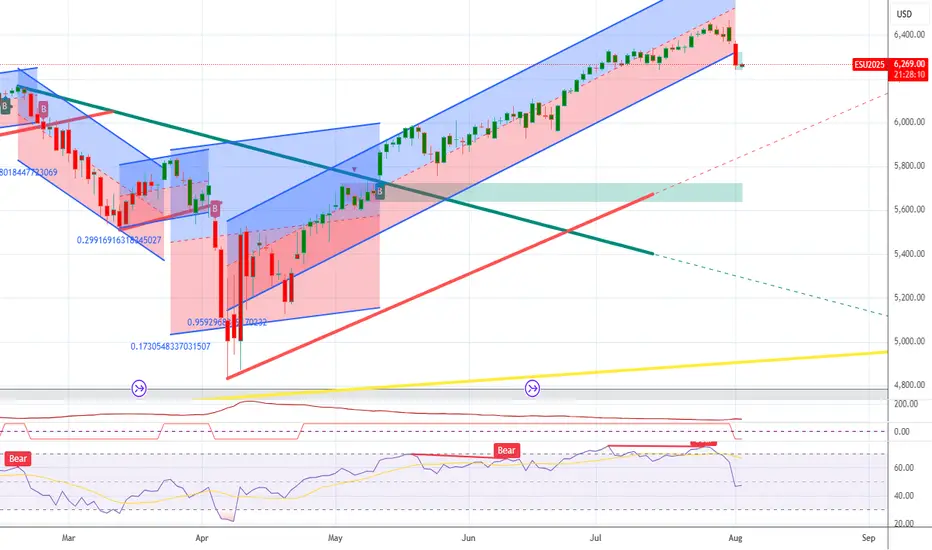
ES THOUGHTSES is on the verge of retracing to its monthly 50% correction mark, so my bias is bearish. Price retrace up nicely, looking for shorts to go lower. simple, sweet and short.

ES - August 5th - Afternoon Update1:25pm EST - Afternoon Update.
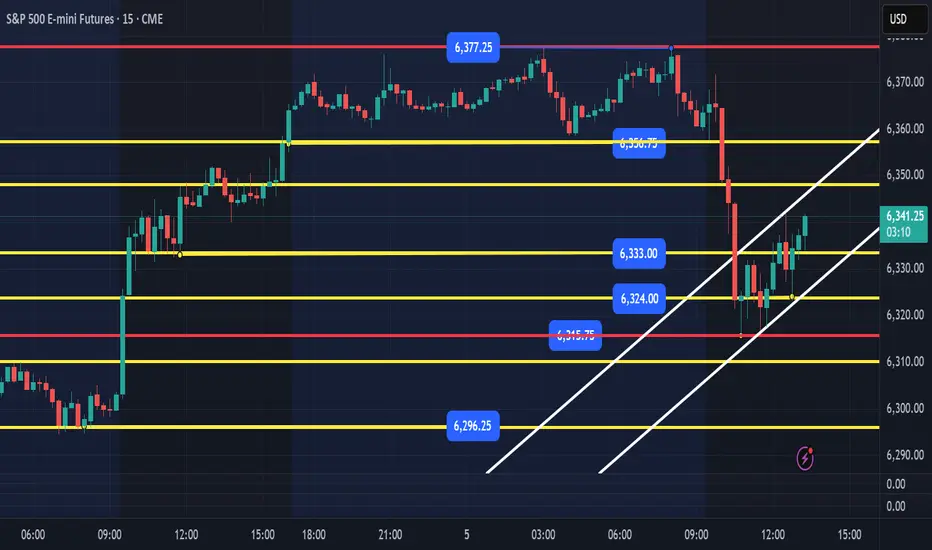
Price looks to be building a bear flag from the am sell off. This would be validated with a loss of 6323 level and you could look to short down to 6310, 6298. I would take my profit at 6310, as you could get a short squeeze right below or at the 6298 level. As a long ES trader, shorting for 10pts is not my edge. IF, you like to short that would be what to watch for.
I am still looking for a long at 6298 or 6275-77 flush and reclaim of these levels. We need some volatility and we might get some after 2pm today.
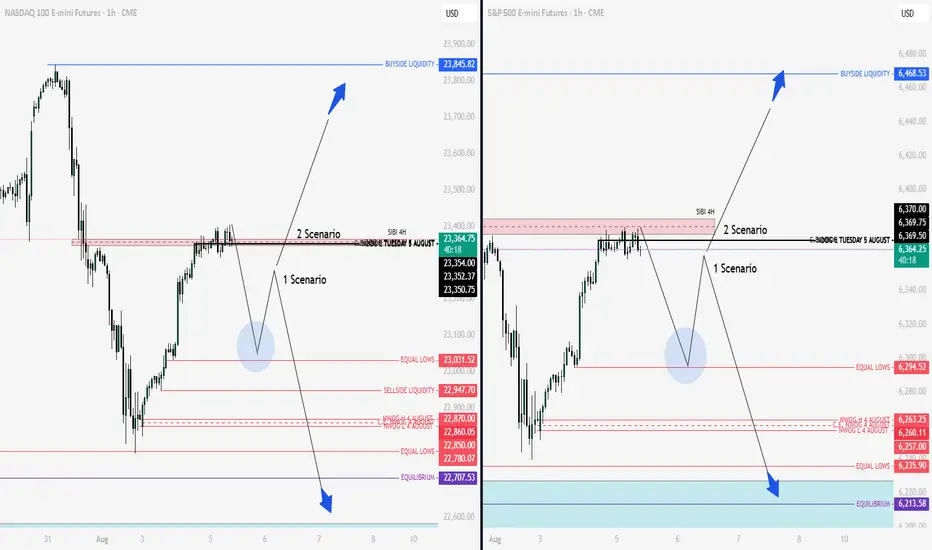
Nq & Es Key Levels and Scenarios 05-08-2025 We are currently positioned in a premium zone. This suggests that the price is likely to seek lower levels within discount areas. Therefore, upon the market opening, it will be crucial to observe price action in light of the increased volatility expected to enter the market.
The prevailing bias is that prices are likely to decline toward the predefined zones indicated on the chart. Depending on how price reacts at these key levels, we will be able to assess whether the downward movement will continue or if significant support will emerge, potentially leading to a full reversal to the upside.
In summary, there may be initial shorting opportunities, followed by potential long setups depending on the market’s reaction. Two scenarios have been outlined.
Wishing you all successful and well-considered trades.
/MES S&P Futures (ChopDay)Good morning guys here we have a 4hr ES Futures chart that I created clearly showing you a Yellow dotted bounding box which shows what I call a No Trade Zone / Institutional Liquidity Grab. In simple terms " Dont Trade / sit on your hands "
It seems that we are consolidating and awaiting for market direction either Up or Down, my educated guess is that we may have a little pump but higher probability to the downside based on my studies. You will see wicks above and below the bodies of the 4hr candles, that to me tells a story, what is the story? A day where the market will chop around most likely and take your money it is Bulls too scared to move higher and Bears scared to pull the trigger to the downside thinking they will get trapped but in my eyes the market is overbought and exhausted, it needs a break. Does it mean that it will drop, absolutely NOT, the market can in fact continue to push higher if it wants but in my opinion, it seems that down should be the way at least for the next few weeks or months.

ES - August 5th, 2025 - Daily Trading Plan7:45am EST - Overnight Session Update -
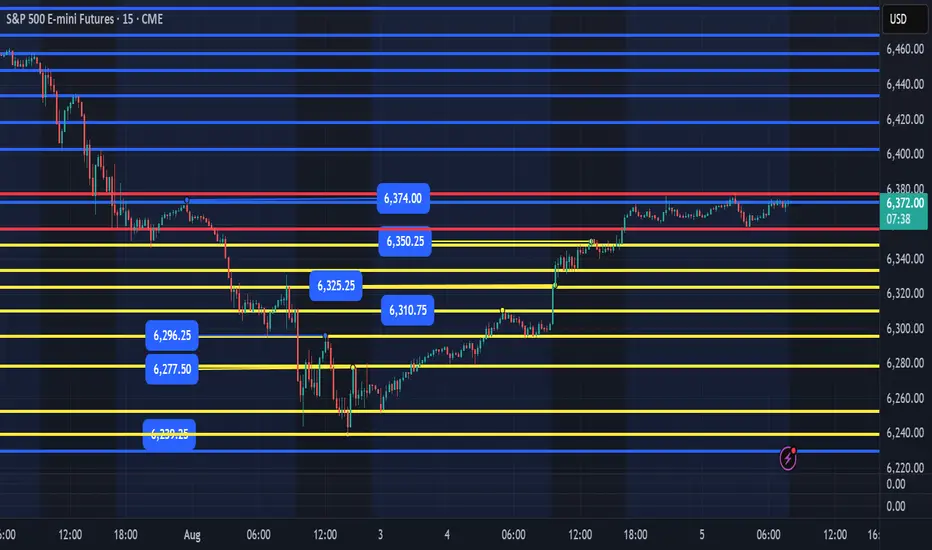
Yesterday we reached our main targets of 6325, 6350, 6375. Overnight we have been consolidating in a tight range between 6358-6378. We could get one good flush and recover of 6358 and we can long to 6378, 6400. If we breakout of 6375, we should continue higher to 6400, 6420+. I also would be careful as price has been in a narrow range, we could get a fake breakout above 6375. IF, price breaks out and then returns back inside the 6375 range, we can expect price to sell off and potentially pullback to retest the levels below. I hate trading a new position when price is at the high of the breakout and high of the session. I would rather wait to get a flush of 6358 and recover to long or flush much further down to the 6297 area and flush and recover would be even better.
I will update closer to 9:30am EST. My lean is to wait for a flush of 6358 and recover to long back to 6378, 6400.
Day 1 Trading Only S&P Futures — Starting with $200 Profit
Day 1 — Trading Only S&P Futures
Daily P/L:+ 204 :moneybag:
Sleep: 8 hours
Emotions: Tired and sored from muay thai.
:thought_balloon: Today’s Trade thoughts:
I was leaning bearish in the market because we had such strong selling pressure on Friday butonce we broke over the level i posted last week at 6330, I gave up on my bias and I just followed the signals and traded the the X1dd buy signal with @gohawks14 and shorted the Max gamma resistance around 6352 and called a day when i made $200.
I think for this week as we start the trading challenge, I want to have one account where i just make $200 and call it a day so this way i can build consistency and get my trading % up.
:bell:News Highlights:
DOW REBOUNDS NEARLY 600 POINTS, VIX PLUNGES AS U.S. STOCKS END SHARPLY HIGHER ON RATE-CUT OPTIMISM
:bar_chart: VX Algo Signals (9:30am – 2pm EST):
9:00 AM Market Structure flipped bullish on VX Algo X3!
10:10 AM VXAlgo NQ X1 Sell Signal
10:40 AM VXAlgo ES X1 Sell Signal
11:40 AM VXAlgo NQ X1DD Buy Signal (Double buy signal)
11:40 AM VXAlgo ES X1 Buy signal
12:40 PM VXAlgo NQ X1 Sell Signal
1:21 PM VXAlgo ES X1 Sell Signal
2:00 PM VXAlgo ES X3 Sell Signal
:chart_with_upwards_trend: Key Levels for Tomorrow:
Above 6332 = Bullish
Below 6300 = Bearish
:link: Recap & Charts: www.tradingview.com

Follow through to the upside is expectedFollow through to the upside in the S&P 500 daily chart is expected for Tuesday after the dramatic return of buyers on Monday.

Nq & Es Key Levels 04-08-2025 After MarketClosing exactly at the level I gave this morning...Incredible Accuracy...Just see the previous post to understand


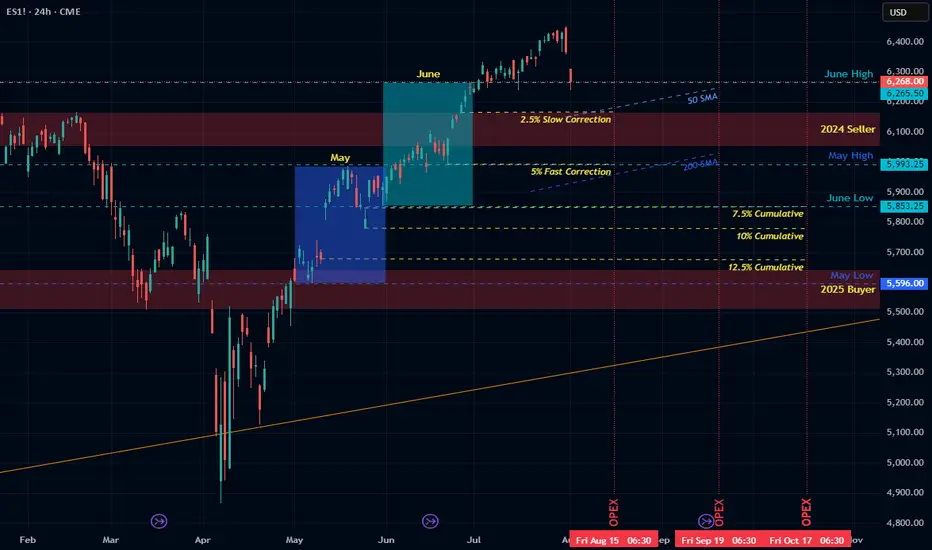
Path into Q3Outlook for the Next Few Months
• Now–August OpEx: -2.5% to -5% slow correction
• August–September OpEx: potential 5–7.5% additional decline
• By late Q3: cumulative 10–12.5% drawdown (target S&P ~5700).
• October: possible bounce — or acceleration if data worsens
• End of Year: risk of deep drop à la Oct–Dec 2018 if trends continue
Macro Backdrop
• Watch for margin compression, CPI surprise, and unemployment uptick
• Private data shows more fragility than government numbers
• QRA-driven liquidity tightening may amplify downside risk
Political Timing and Fed Policy
• Administration may welcome controlled decline to enable early 2026 rate cuts
• If market doesn’t decline soon, blow-off top/melt-up into midterms possible
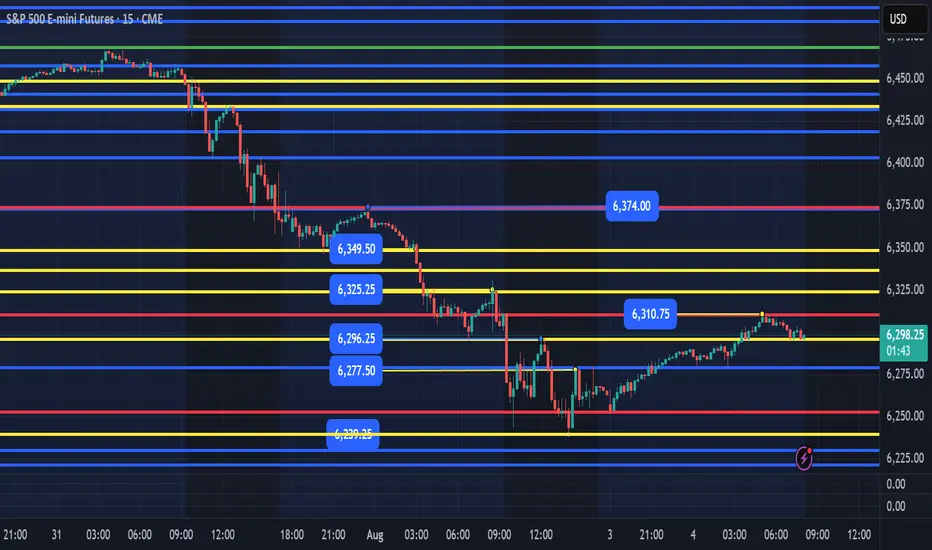
ES - Daily Session Trade Plan - Update August 4th, 2025 8am EST update -
Overnight price found a low at 6252 reached 6310 as the high. 6296, 6277, 6252 are the 3 main supports below. A flush and level reclaim of any of these supports should see price continue higher with targets of 6325, 6350, 6375.
IF price loses 6252 or Fridays low at 6240, these would be the higher quality levels we would want price to flush and reclaim for a move higher.
6297 support holds and we break the overnight high at 6310, the back test of this breakout would be worth a level to level move up to 6325.
The main levels I am watching is 6252 or 6240 to be tested, flushed and reclaimed. It would be best to wait for the 9:30am open and see how price reacts. I could see price flush in the first 30 mins, then catch bears offside and reclaim the Fridays lows. That would be a great short squeeze area to ride a couple of levels of back testing the overnight price.
Below Fridays lows and I will be waiting for price to build structure at the supports of 6225, 6210, 6194, 6175. If ES is selling hard into these areas, I would wait to enter any longs until I see structure build and reclaim the levels I have outlined. Let price come to you and be patient.
Corrective Dip or New Downtrend on the S&P 500 Futures?🟣 1. Impulses vs. Corrections – The Classical View
When price trends, it doesn't move in a straight line. Instead, it alternates between directional movements called impulses and counter-directional pauses or retracements known as corrections. Most analysts define an impulse as a sharp, dominant move in the direction of the trend—typically accompanied by rising volume and momentum indicators. Corrections, on the other hand, tend to be slower, overlapping, and often occur with declining volume.
Common methods to identify impulses vs. corrections include:
Swing structure: Higher highs and higher lows suggest impulse; overlapping lows suggest correction.
Fibonacci retracements: Corrections often retrace up to 61.8% of a prior impulse.
Moving averages: Price above a rising MA is often viewed as impulse territory.
Volume analysis and oscillators such as RSI or MACD are used to confirm price behavior.
Despite the abundance of methods, the distinction between impulses and corrections often remains subjective. That’s where the Directional Movement Index (DMI) provides an objective lens—especially when paired with price action.
🟣 2. Rethinking Impulses with the DMI Indicator
The Directional Movement Index (DMI), developed by J. Welles Wilder, offers a quantitative way to assess the strength and direction of price movement. It breaks down market activity into three components:
+DMI (Positive Directional Movement Index): Measures the strength of upward movements.
−DMI (Negative Directional Movement Index): Measures the strength of downward movements.
ADX (Average Directional Index): Quantifies overall trend strength but is optional in this discussion.
The key to applying DMI lies in the crossover between +DMI and -DMI:
When +DMI > -DMI, upward price moves dominate—suggesting bullish impulses.
When −DMI > +DMI, downward moves dominate—suggesting bearish impulses.
Calculation is based on a comparison of successive highs and lows over a specific lookback period—commonly set to 14 or 20 periods.
While EMAs track trend direction and momentum, DMI helps dissect who’s in control. This makes it a powerful filter when evaluating whether a breakdown or breakout is likely to become an impulsive trend—or just another correction in disguise.
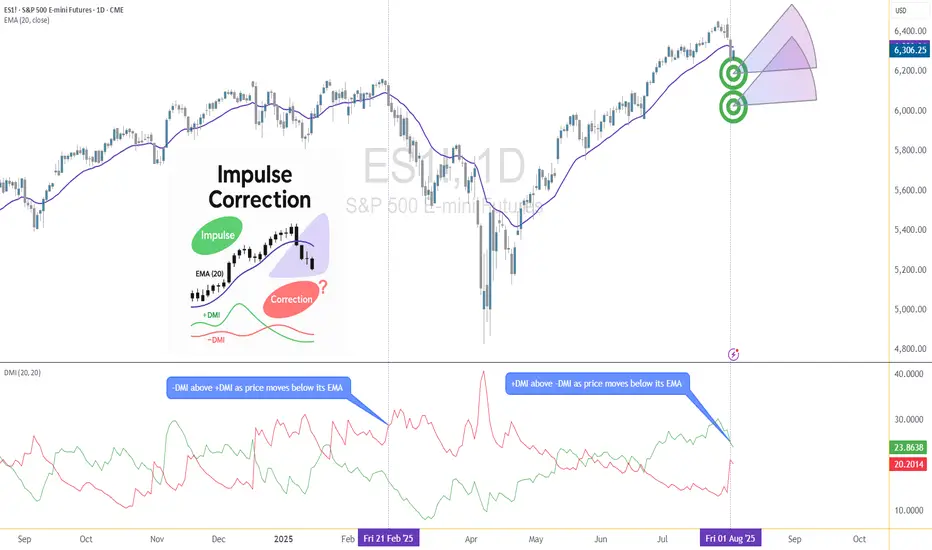
🟣 3. Case Study – Two Breakdowns, Two Outcomes
Let’s apply this logic to two recent moments on the E-mini S&P 500 Futures (ES) daily chart.
🔹 Feb 21, 2025 Breakdown
Price broke sharply below the 20-period EMA. At first glance, this looked like a potential trend reversal. The DMI confirmed this suspicion: −DMI surged above +DMI, signaling downside impulses were in control. The market followed through with a clear downtrend, confirming the move was not just a pullback—it was a shift in market structure.
🔹 Aug 1, 2025 Breakdown
A similar sharp break below the 20 EMA just occurred again. However, this time +DMI remains above −DMI, despite the bearish price action. This divergence tells a different story: the breakdown may not be impulsive in nature. Instead, it's likely a corrective dip within a broader uptrend, where buyers are still the dominant force.
This is a textbook example of how a moving average crossover without DMI confirmation can mislead traders. By combining these tools, we’re able to make more informed decisions about whether price action is signaling a true shift—or just a pause.
🟣 4. CME Product Specs – ES vs. MES
Traders can express directional views on the S&P 500 using two primary CME futures contracts: the E-mini S&P 500 Futures (ES) and the Micro E-mini S&P 500 Futures (MES). Both track the same underlying index but differ in size, capital requirement, and tick value.
✅ E-mini S&P 500 Futures (ES)
Symbol: ES
Contract Size: $50 x S&P 500 Index
Tick Size: 0.25 index points
Tick Value: $12.50
Initial Margin: Approximately $21,000 (varies by broker and through time)
Market Hours: Nearly 24/6
✅ Micro E-mini S&P 500 Futures (MES)
Symbol: MES
Contract Size: $5 x S&P 500 Index
Tick Size: 0.25 index points
Tick Value: $1.25
Initial Margin: Approximately $2,100 (varies by broker and through time)
The Micro contract provides access to the same market structure, liquidity, and price movement as the E-mini, but with a fraction of the exposure—making it ideal for smaller accounts or more precise position sizing.
🟣 5. Risk Management Matters
Understanding whether a market move is impulsive or corrective isn’t just academic—it’s the difference between positioning with the dominant flow or fighting it. Traders often get trapped by sharp moves that appear trend-defining but are simply noise or temporary pullbacks.
Using tools like DMI to confirm whether directional strength supports price action provides a layer of risk filtration. It prevents overreaction to every EMA crossover or sudden price drop.
Stop-loss orders become vital in both impulsive and corrective conditions. In impulsive environments, stops help lock in profits while protecting from reversals. In corrective phases, they act as circuit breakers against breakouts that fail.
Moreover, knowing the product you're trading is critical:
A single ES contract controls ~$320,000 of notional value.
An MES contract controls ~$32,000.
This disparity means poor sizing on ES can magnify errors, while proper sizing on MES can offer flexibility to test, scale, and hedge with tighter capital control.
Whether you're reacting to price or preparing for continuation, risk management is the only constant. It’s what turns analysis into disciplined execution.
When charting futures, the data provided could be delayed. Traders working with the ticker symbols discussed in this idea may prefer to use CME Group real-time data plan on TradingView: www.tradingview.com - This consideration is particularly important for shorter-term traders, whereas it may be less critical for those focused on longer-term trading strategies.
General Disclaimer:
The trade ideas presented herein are solely for illustrative purposes forming a part of a case study intended to demonstrate key principles in risk management within the context of the specific market scenarios discussed. These ideas are not to be interpreted as investment recommendations or financial advice. They do not endorse or promote any specific trading strategies, financial products, or services. The information provided is based on data believed to be reliable; however, its accuracy or completeness cannot be guaranteed. Trading in financial markets involves risks, including the potential loss of principal. Each individual should conduct their own research and consult with professional financial advisors before making any investment decisions. The author or publisher of this content bears no responsibility for any actions taken based on the information provided or for any resultant financial or other losses.
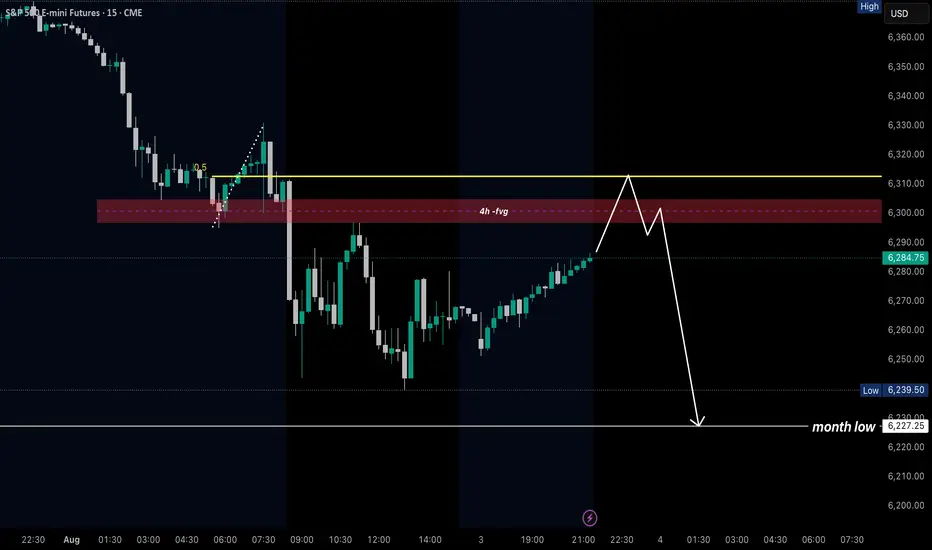
ES bearish sentiment for Monday aug 4thIll be watching for a bearish set up to form around the bearish 4 hr fvg to take out previous month low
SP500 ShortSP500 is now net short on the regression break.
I am short the Russell2000 from last week and I am considering this trade into Summer.
ES - August 4th, 2025 - Daily Trade PlanI am providing my plan for the session and will update before 8am EST with overnight session price movement and what I am looking to do during the 9:30am EST session. All levels below are labeled or colored.
6:07pm EST - Opening Session Overview for August 4th, 2025 - Daily Trade Plan
We could very well dip to 6230-40 range and then move back up the range to retest the 6375 level. The key levels I will be looking to reclaim and take some points from are as follows:
Resistances – 6297, 6315, 6330, 6350, 6370
Supports – 6240, 6225, 6190.
Ideally, we lose Fridays low of 6239 and reclaim it for a level-to-level move. If not, we need to continue to build structure between 6296 and 6240. 6275 was rejected 2x on Friday late and if we clear 6275, a back test of this would be a good place to grab points to 6296 and then possibly continue to 6315, 6330, 6350, 6370.
I will not be shorting or engaging in any level below 6240, unless structure builds at the 6225, 6190 lowest it would want to go.
Update will be provided by 8am EST for 9:30am EST Session open.

ES | SP500 - Weekly Recap & Gameplan - 03/08/25📈 Market Context:
Traders are currently anticipating a possible 0.25% rate cut during the upcoming September FOMC meeting, which continues to support the broader bullish framework.
Although the market pulled back after the Non-Farm Employment Change data came in below expectations, overall optimism remains.
Sentiment has now cooled off from last week's greed and shifted to a more neutral stance. Historically, August tends to bring some chop and pullbacks, but the structural bias still leans bullish.
🧾 Weekly Recap:
• ES kicked off the week with strong upward momentum, climbing steadily into Thursday.
• Along the way, price swept a key 4H swing high, breaking into new highs before initiating a retracement.
• This price action hinted at a short-term distribution and possible liquidity grab ahead of a correction.
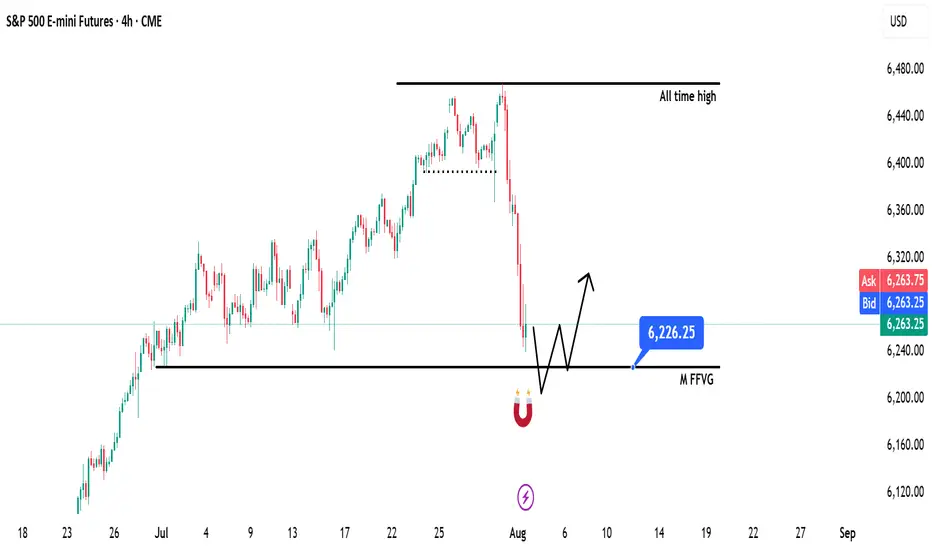
📌 Technical Outlook & Game Plan:
→ I'm anticipating a move into the Monthly Fair Value Gap — a high-probability liquidity zone on my radar.
→ That area could act as a springboard for bullish continuation or at least provide a strong reaction.
→ Until that happens, I remain short-biased targeting the 6226$ zone, which I've marked as a major level.
🎯 Setup Trigger:
Once price taps 6226$, I'll monitor for:
• Clear break of structure on the 4H and 1H timeframes
• Formation of new demand zones indicating potential reversal
→ On confirmation from the lower timeframes, I’ll shift my focus toward long setups, potentially targeting new highs.
📋 Trade Management:
• Stoploss: Below the demand zone formed on 1H–4H
• Target: I’ll trail my stop to lock in profits as price moves higher
• Note: Although I’ll be watching for ATH retests, I plan to manage risk actively and book profits along the way
💬 Like, follow, and comment if this breakdown supports your trading! I’ll be sharing more detailed setups and educational posts — stay connected!
This is a focus the Index marketIt's Sunday and you might want to look at the S&P when the Market opens later tonight. For 2 days the S&P went lower and I think you can categorize this as an expanding Market and it's very tradable. You can even miss the trade on Thursday and still make a good return on Friday. Also I would call this a spike pattern and my assumption is that the market had a range on the first day that was Thursday and then it doubled the range on Friday. There's very good volatility in the S&P and I believe there is an order to it that can help you find trades that otherwise leave you with no options when they really do exist. At the end of the video I put on a range box by definition it can't be a perfect box because I need a little bit more information probably on Monday but it might be Tuesday..... And it doesn't always work but if you take this approach to the market and if you use the tools that I work with including 2 bar reversals and you're willing to Short because sellers are who are making money on the S&P on Thursday and Friday and possibly own Monday. Most Traders will never short .... And they will miss tremendous opportunity. I will follow up on this Market on Monday or Tuesday.

Possible cluster for Short on SP500An area I am closely monitoring lies between 6478 and 6516, particularly if the current high of 6152.75 (marked on December 16) is breached.
Analyzing the swing starting from the low of 3502 in October 2022, the major tops have followed a distinctive pattern in percentage terms:
3/40
5/40
8/40
13/40
21/40
The pattern suggests that each subsequent high is obtained by summing the numerators of the previous upward moves (e.g., 3 + 5 = 8, 8 + 5 = 13, and so on) while the denominator remains fixed at 40. Following this logic, the next high should be 34/40 (21 + 13).
I am confident in the reliability of this pattern because when I sum the numerators (21 + 34) and the denominators (40 + 40), the resulting level (55/80) aligns with a minor high. Similarly, by summing 55/80 and 21/40, using the same logic, I arrive at 76/120, which corresponded to a very significant high in July 2024.
While these levels may not be perfectly precise, they represent key areas of interest that warrant close attention.
If you are interested in this type of analysis, particularly when integrated with GANN angles, feel free to contact me privately at this email: drake36@inwind.it.

Still Bullish BiasOn the 4HR , there is already 2 legs down to start the month, similar to what happened in May. Markets typically has had 2 legs down before moving higher. Its August and its gonna be choppy.
We may test the tip of last years candle before we move even higher, which is another probably 80-100 points. However the hourly seems to reject this idea based on a 9 TD Sequential Count as the first alert failed and Bear continues pushing the price down. When in doubt always look at a higher timeframe. Just my thought of the probable outcome. Trade safe.

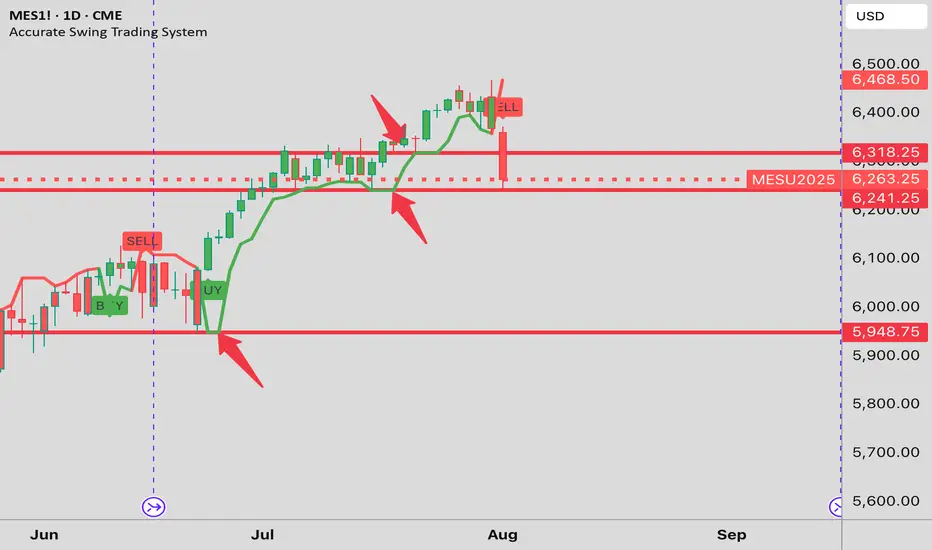
Friday's support clearly shown This is why I use the Accurate Swing Trading System (Ceyhun). Look at it in default configuration on this daily MES1! chart. I drew the red horizontal lines where the indicator line is "flat". That is what I am trying to show you. An "Emergent Quality" of the indicator. I note the line at 6,241 and the LOD at 6239.50. ( line at 6318 failed to support the price) My experience with it says it's better than Fibonacci, Camarilla etc. Where do we go from here?.....The market will show us....Let the Ceyhun show you support and resistance on shorter term charts....You will be glad you did. Happy Trades. DAP
Time to catch its breathAfter the break to lower prices in the daily S&P 500 chart, the expectation for Monday is for the market to stop and catch its breath which means are not looking for a big day down on Monday but rather a sideways so only slightly lower move without new fundamental information to stimulate the market.

08/1/25 Trade Journal, and ES_F Stock Market analysis EOD accountability report: +440
Sleep: 6 hours
Overall health: Good
VX Algo System Signals from (9:30am to 2pm)
— 9:30 AM Market Structure flipped bearish on VX Algo X3!
— 10:12 AM VXAlgo ES X1 Buy signal
— 10:20 AM VXAlgo NQ X1 Buy Signal
—12:30 PM Market Structure flipped bullish on VX Algo X3!
— 1:00 PM Market Structure flipped bearish on VX Algo X3!
— 1:50 PM VXAlgo ES X1 Buy signal,
— 3:00 PM Market Structure flipped bullish on VX Algo X3!**
What’s are some news or takeaway from today? and What major news or event impacted the market today?
Market range expanded a lot today, we dropped over 100 points today and sometimes i forget to adjust my bracket orders to go for 10 -15 points take profits when the volatility is so high. But overall, it was a good day, I knew to be patient as market was wild and sometimes you want to just snipe a few trades and call it a day before you get caught on the wrong side.
The great thing about big moves is that it will eventually hit a major level and it will react really well, you just have to wait for it.
a great question is will the market recover? Or is going back down to April prices?
News
*STOCKS TUMBLE TO END THE WEEK, VIX SPIKES AS SOFT JOBS DATA STOKE ECONOMIC JITTERS
What are the critical support levels to watch?
--> Above 6330= Bullish, Under 6310= Bearish
