Micro E-mini Russell 2000 Index Futures (Dec 2025)
No trades
Related futures

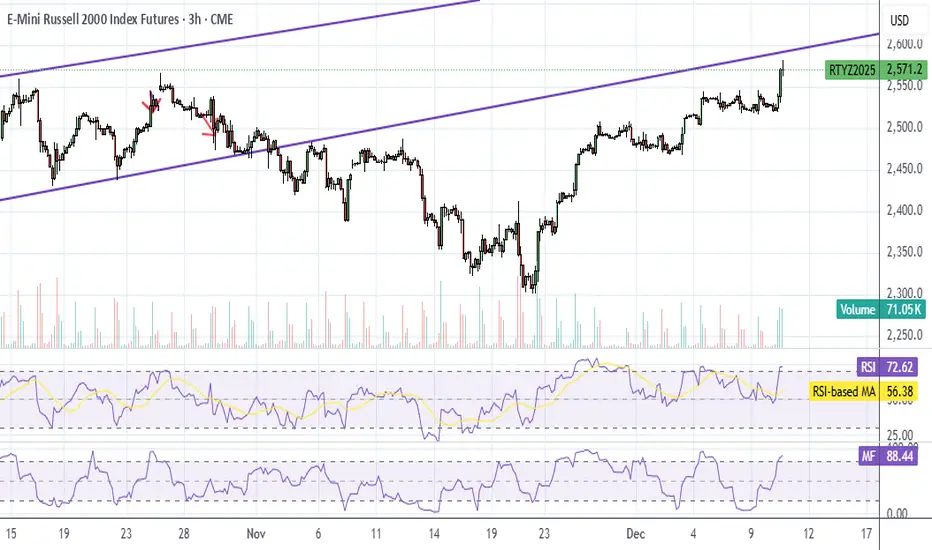
RTY UpdateRTY and YM (Dow) are overbought on RSI and MFI, so probably more whipsaw tomorrow, lol.
I looked at it because I was thinking about going long on a retail stock. Looks like I'm too late on that one.
FDAX also hit overbought...

RTY UpdateRTY is overbought on both RSI and MFI but I think it backtests that purple line before dropping.
Expecting a pump tomorrow morning then back to teh whipsaw. See my ES plot./
Russell 80% gain in 2026We are headed North. Channel is clear and has no been confirmed. Next stop is north. Do not short. Buy the dip territory all year. Enjoy. Should be a lot of fun.

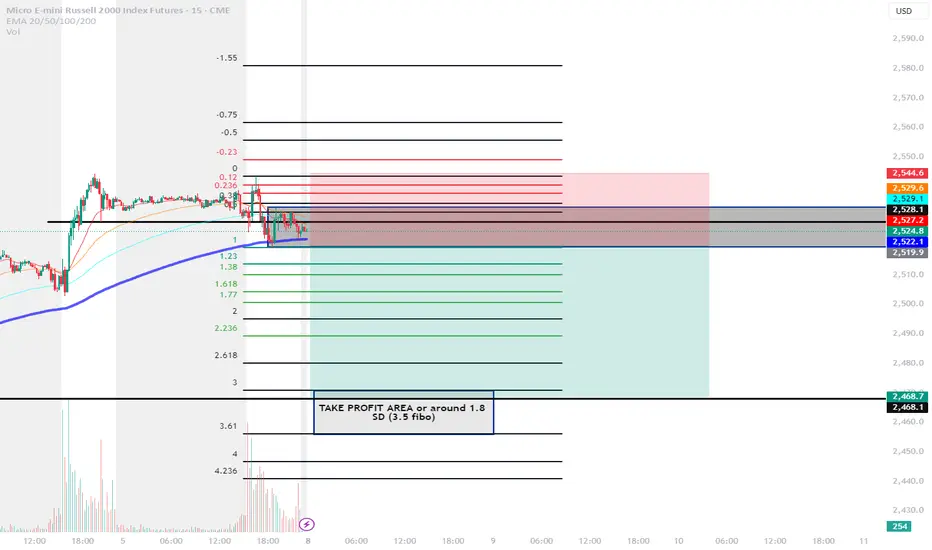
Short RTY, M2K IdeaI believe if we broke the box to the downside. A huge selloff will happen to 1.5 Standard deviation or 3 Fibonacci level drawn from Friday range
RTY Premarket UpdatePosting premarket update because I showed it went oversold yesterday. MFI hit overbought already, don't chase it.

RTY UpdateI said I'd wait until indicators show something before trading, RTY MFI hit oversold before market opened, so I went long today....
but I realized what I should have done is buy IWM call options on open, lol. Next time. RSI is almost overbought, I expect it to go above teh line just like last tim

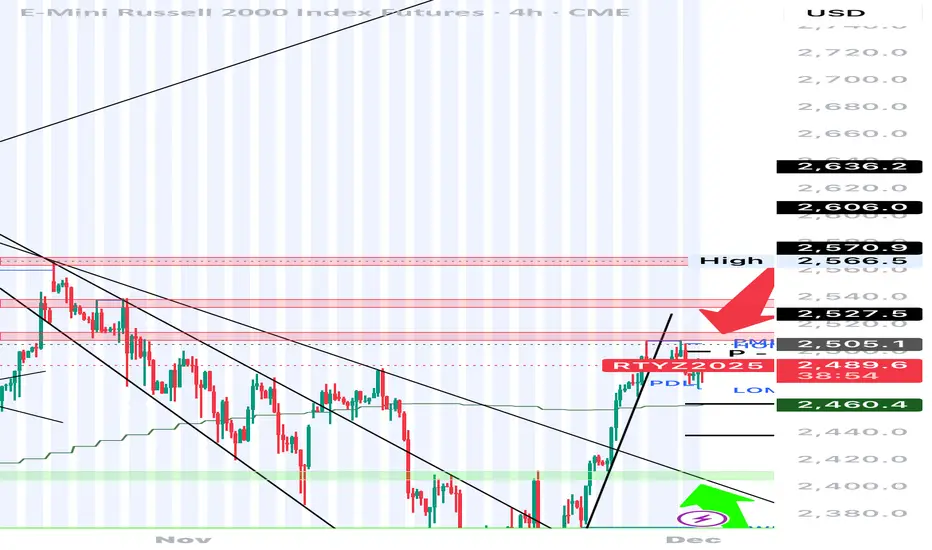
RTY BUY and SELL ZonesSetups i am watching this week
Buy zone - Green arrow (2411-2400) - (swing) confluence for this Green zone
Clean Sweep of 25 - Nov low
Strong support zone in hourly (4h)
TL support
Sell zone - (2520-2510 ) confluence
Clean sweep of PMH,PWH, PDH & 29 Oct High
Resistance Zone
Always enter the Tr

RTY - Bull and sell zonesSetups i am watching this week
Buy zone - Green arrow (2411-2400) - (swing) confluence for this Green zone
Clean Sweep of 25 - Nov low
Strong support zone in hourly (4h)
TL support
Sell zone - (2520-2510 ) confluence
Clean sweep of PMH,PWH, PDH & 29 Oct High
Resista

See all ideas
Summarizing what the indicators are suggesting.
Neutral
SellBuy
Strong sellStrong buy
Strong sellSellNeutralBuyStrong buy
Neutral
SellBuy
Strong sellStrong buy
Strong sellSellNeutralBuyStrong buy
Neutral
SellBuy
Strong sellStrong buy
Strong sellSellNeutralBuyStrong buy
A representation of what an asset is worth today and what the market thinks it will be worth in the future.
Displays a symbol's price movements over previous years to identify recurring trends.
Frequently Asked Questions
The current price of Micro E-mini Russell 2000 Index Futures (Dec 2025) is 2,501.0 USD — it has risen 0.25% in the past 24 hours. Watch Micro E-mini Russell 2000 Index Futures (Dec 2025) price in more detail on the chart.
The volume of Micro E-mini Russell 2000 Index Futures (Dec 2025) is 783.00. Track more important stats on the Micro E-mini Russell 2000 Index Futures (Dec 2025) chart.
The nearest expiration date for Micro E-mini Russell 2000 Index Futures (Dec 2025) is Dec 19, 2025.
Traders prefer to sell futures contracts when they've already made money on the investment, but still have plenty of time left before the expiration date. Thus, many consider it a good option to sell Micro E-mini Russell 2000 Index Futures (Dec 2025) before Dec 19, 2025.
Open interest is the number of contracts held by traders in active positions — they're not closed or expired. For Micro E-mini Russell 2000 Index Futures (Dec 2025) this number is 38.95 K. You can use it to track a prevailing market trend and adjust your own strategy: declining open interest for Micro E-mini Russell 2000 Index Futures (Dec 2025) shows that traders are closing their positions, which means a weakening trend.
Buying or selling futures contracts depends on many factors: season, underlying commodity, your own trading strategy. So mostly it's up to you, but if you look for some certain calculations to take into account, you can study technical analysis for Micro E-mini Russell 2000 Index Futures (Dec 2025). Today its technical rating is buy, but remember that market conditions change all the time, so it's always crucial to do your own research. See more of Micro E-mini Russell 2000 Index Futures (Dec 2025) technicals for a more comprehensive analysis.