Analysis for What’s Coming - AI Bubble Sentiment The US markets have been described as “on a rally” for quite some time. I would not agree if it is meant to describe the overall US market, but would agree if it refers specifically to AI or tech stocks. Why?
Among the four major US indices, the Russell—representing a much broader base of US-listed
Related futures

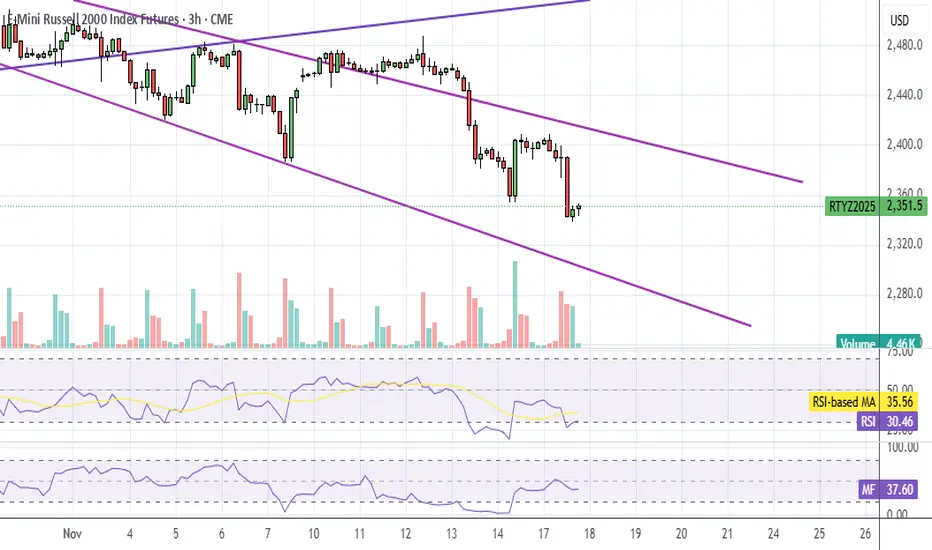
RTY UpdateSeems like the market has given up on small caps, lol. They're not even bothering to pump futures unless MFI and RSI get way oversold. Will most likely hit the purple line below.
Also, small caps aren't done tanking until garbage like FCEL go back down to where they belong. I'll plot it.
RTY UpdateMFI hit overbought already, but they're pumping it anyways on NVDA earnings which really has nothing to do with small caps. Jobs report tomorrow though.
This remains the index to short, but I'll probably wait until Monday.
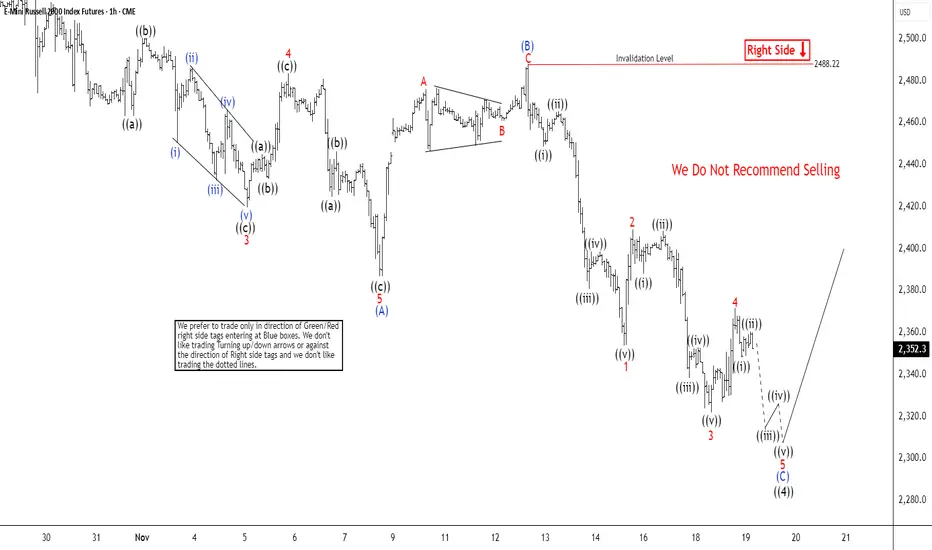
Zigzag Structure in Russell (RTY) Nears Resolution Around 2300The short-term Elliott Wave outlook for the Russell 2000 Index (RTY) indicates that the decline from the October 25, 2025 peak is unfolding as a zigzag corrective structure. From that high, wave 1 concluded at 2473.9, followed by a corrective rally in wave 2 that terminated at 2517.2. The Index then
RTY UpdateDaily MFI is almost oversold, but I'm not sure that matters.
I'm still bearish on small caps because there's still a bunch of total garbage companies that haven't fallen to proper levels, such as FCEL.
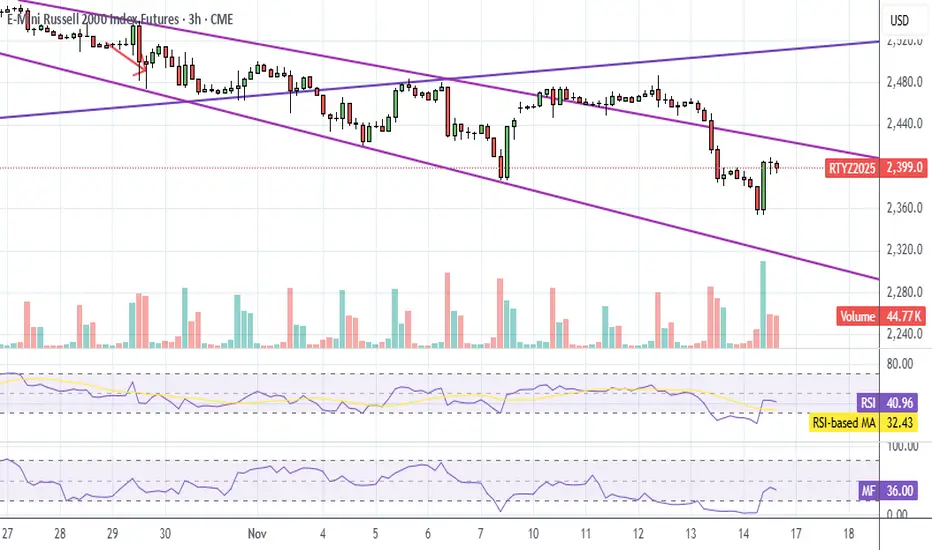
RTY UpdateRTY not only filled the Sunday gap but also the TACO gap.
Not sure where the market is headed long term, but I expect a bounce either tomorrow or Monday.
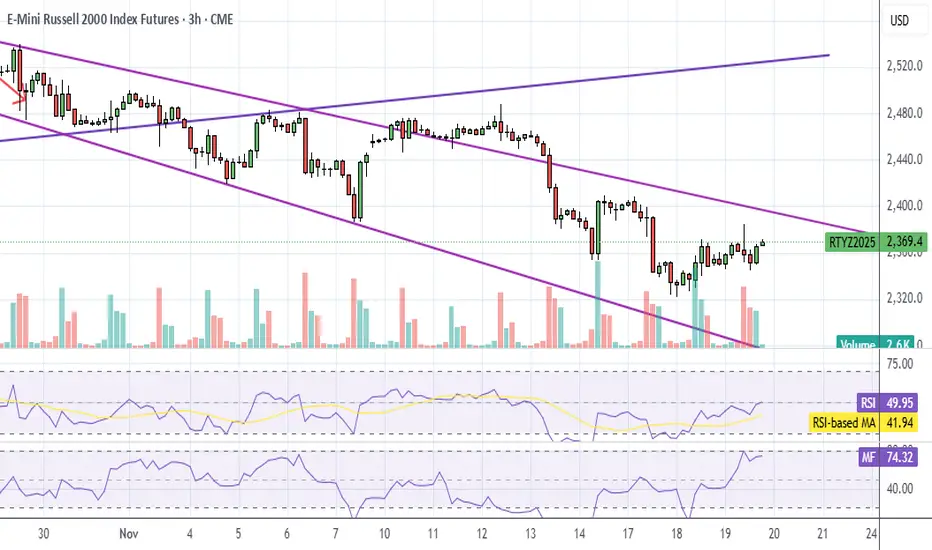
The bearish part is that it's back in the down channel. It has to break back through the purple line to rally. Not sure if it does or not.
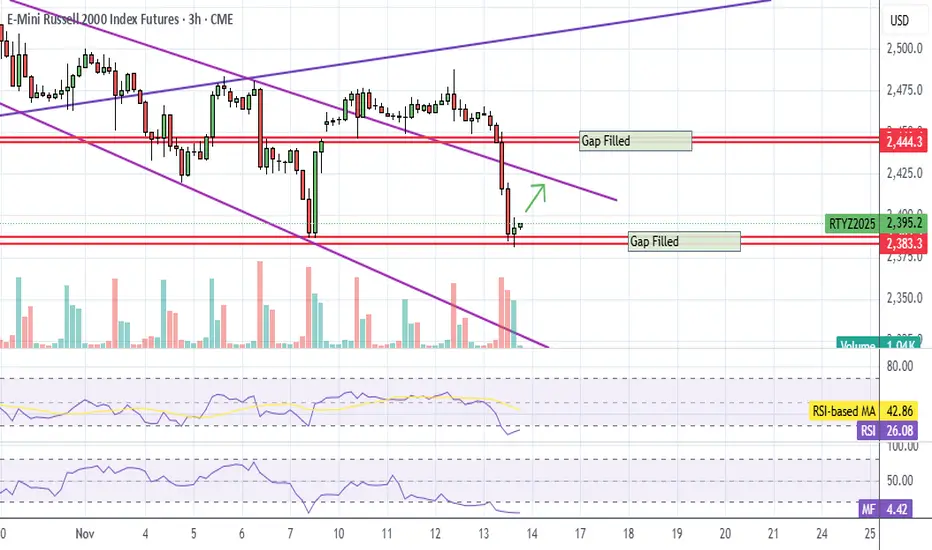
RTY UpdateIndicators are neutral.
I don't think it'll rally like I thought so I deleted the green arrow. Every time they stop pumping futures, small caps just drop, like this morning and afternoon.
Probably just drifts sideways until ES and NQ get overbought then goes down with the rest of teh market.

RTY Open GapRTY left an open gap after the 1 hour break.
That's gonna fill, it's coming back down.
Note: 15 min chart, ignore indicators

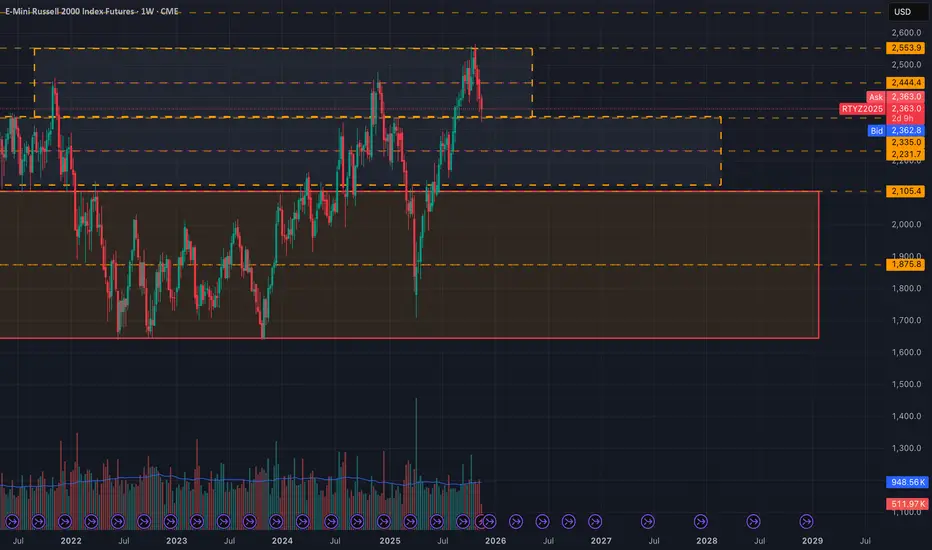
RTY Box LevelsI've taken some time to chart the Russell 200, and I have to say the box is looking quite excellent.
Nice and clean levels, makes a fella wanna put a bid in.
I am not used to trading this name(literally traded it the first time on Monday), but it seems like a good time so far.
I'll be on the loo
Upside momentum is slowing downBe cautious on the long side in the S&P 500 daily chart. Momentum still favors the upside. However, the structure indicates that momentum is slowing down so be cautious on the long side of this market.

See all ideas
Summarizing what the indicators are suggesting.
Neutral
SellBuy
Strong sellStrong buy
Strong sellSellNeutralBuyStrong buy
Neutral
SellBuy
Strong sellStrong buy
Strong sellSellNeutralBuyStrong buy
Neutral
SellBuy
Strong sellStrong buy
Strong sellSellNeutralBuyStrong buy
A representation of what an asset is worth today and what the market thinks it will be worth in the future.
Displays a symbol's price movements over previous years to identify recurring trends.
Frequently Asked Questions
The current price of Micro E-mini Russell 2000 Index Futures (Dec 2025) is 2,375.3 USD — it has risen 2.80% in the past 24 hours. Watch Micro E-mini Russell 2000 Index Futures (Dec 2025) price in more detail on the chart.
The volume of Micro E-mini Russell 2000 Index Futures (Dec 2025) is 136.74 K. Track more important stats on the Micro E-mini Russell 2000 Index Futures (Dec 2025) chart.
The nearest expiration date for Micro E-mini Russell 2000 Index Futures (Dec 2025) is Dec 19, 2025.
Traders prefer to sell futures contracts when they've already made money on the investment, but still have plenty of time left before the expiration date. Thus, many consider it a good option to sell Micro E-mini Russell 2000 Index Futures (Dec 2025) before Dec 19, 2025.
Open interest is the number of contracts held by traders in active positions — they're not closed or expired. For Micro E-mini Russell 2000 Index Futures (Dec 2025) this number is 31.35 K. You can use it to track a prevailing market trend and adjust your own strategy: declining open interest for Micro E-mini Russell 2000 Index Futures (Dec 2025) shows that traders are closing their positions, which means a weakening trend.
Buying or selling futures contracts depends on many factors: season, underlying commodity, your own trading strategy. So mostly it's up to you, but if you look for some certain calculations to take into account, you can study technical analysis for Micro E-mini Russell 2000 Index Futures (Dec 2025). Today its technical rating is sell, but remember that market conditions change all the time, so it's always crucial to do your own research. See more of Micro E-mini Russell 2000 Index Futures (Dec 2025) technicals for a more comprehensive analysis.