From Shutdown Relief to AI Anxiety — Two Narratives Driving ESMarket Theme
The week began on a strong footing, driven by a bullish Sunday reopen in ES after news broke that the 43-day government shutdown was set to end, following the Senate’s late-night support for a potential agreement on November 9th. This relief catalyst created early upside momentum, pushing the index toward all-time highs (ATHs).
However, the tone shifted mid-week. The rally lost steam as markets refocused on a growing concern: the sustainability of current Tech and AI valuations. Investors are becoming more sensitive to the possibility of overstretched AI-related capital expenditure and an emerging bubble narrative, especially with heavyweight earnings and forward-guidance looming. This led to a rotation out of high-beta tech and into safer or less-extended sectors.
On the macro front, Fed speakers adopted a more cautious—if not outright hawkish—tone, emphasizing that a December rate cut is far from assured. The recent government shutdown created a backlog in key economic data releases, leaving policymakers and traders alike without clear visibility into the true state of the economy. The lack of data has amplified uncertainty and reduced the market’s conviction around the timing of any potential policy easing.
In short:
The market is caught between two opposing forces:
The optimistic narrative (shutdown resolved, path to ATHs, resilience in U.S. growth), and
The risk narrative (valuation excess, policy uncertainty, narrowing breadth).
This push-pull dynamic has resulted in compression rather than continuation, with a heavy focus on clarity from upcoming data and major earnings.
What is the Market Doing?
Last week formed an inside week, with the entire range trading within the prior week’s range and settling close to the previous week’s close. This signals indecision and balance, as neither buyers nor sellers had the conviction to push the market into expansion.
Current price action shows the market compressing between:
6875 — previous week’s VPOC / 27 Oct weekly VAL
6740— 13 Oct weekly VAH / 10 Nov weekly volume ledge
These levels are well-defined and respected. The upward trendline continues to hold, with multiple strong rejections signaling responsive buyers stepping in to bid prices back up.
The battle is now between buyers attempting to defend 6740 area which is also confluent with the daily trendline support, and sellers leaning on the overhead resistance close to 6875.
What to Expect in the Coming Week
The key line in the sand (LIS) this week:
→ 6755.25 — Previous week's settlement
Bullish Scenario
If 6755 holds as support, expect buyers to attempt a push toward:
6874.50 — previous week's VPOC
6905.5— weekly 1-SD volatility high
Anticipate responsive sellers in this area.
However, if price breaks above 6874.50 with pace and volume and accepts above it, the path opens for a retest of the ATHs as momentum players and trapped shorts fuel continuation.
Bearish Scenario
If the market accepts below 6755 and fails to reclaim it on any pullback:
First downside target: 6660 — 13 Oct weekly VAL
If buyers fail to respond there, expect an acceleration lower from long liquidation toward:
6605— weekly 1-SD volatility low
6504 — previous month's low (deeper target)
This scenario strengthens if the trendline breaks and sellers begin stepping down aggressively.
Neutral / Compression Scenario
If the market remains trapped between 6875 and 6740 with no breakout supported by pace and volume:
Expect two-way rotational trade
Continued compression and balance within the well-defined range
A buildup of energy that may resolve later in the week with data, earnings or fundamental catalysts
Conclusion
As we start the new week, ES remains tightly coiled between well-defined levels, with the market waiting for clarity from data, earnings, and policy signals. Whether we break from compression or continue to balance, the key will be how buyers and sellers respond around 6755 and whether there are new fundamental catalysts.
As always, I’d love to hear your view on the markets and ES this week? — Drop it below — and give it a boost so more of the community can join the conversation.
Glossary Index for all technical terms used:
VAH (Value Area High)
VAL (Value Area Low)
VPOC (Volume Point of Control)
SD (Standard Deviation)
Trade ideas

Survived a Market Selloff | +$241 Trading S&P Futures (Day 71)Ended the day +$241 trading S&P Futures, but it didn’t come easy.
The market started off range-bound, and I traded the highs and lows cleanly — up $300 by 1PM.
Then the bottom fell out, and I got caught in a false range break, watching my account swing from +300 to -500.
Thankfully, I bought at BIA’s key support zone during the late-session recovery and clawed my way back.
Today was all about staying composed when everything flips fast.
Two takeaways today:
Walk away when you say you will — extra orders can cost you.
Range days can break suddenly; keep wider stops when volatility increases.
Above 6820 is bullish, below 6782 turns bearish.
We’re seeing signs of momentum fading, so tomorrow might bring continuation or deeper retracement.

The Truth About Timeframe Analysis (No One Wants to Tell You)*You’re not confused because the market is chaotic.
You’re confused because your framework is garbage.*
🔥 Timeframes Don’t Lie — But Traders Do
Let’s be real:
You jump between timeframes looking for “confirmation,”
but all you’re really doing is collecting excuses.
1H looks bullish
15M looks like a breakout
4H is pulling back
5M is breaking structure in the opposite direction
Now you have five different opinions in your head
and exactly zero conviction.
You hesitate.
You enter late.
You get trapped.
You flip bias like a rookie.
This isn’t “market randomness.”
It’s simply a lack of hierarchy.
⚡ The Market Isn’t Messy. YOUR PROCESS Is Messy.
Every timeframe gives you a “mini truth.”
Without structure, you mix them together into something that feels like analysis…
but is actually noise dressed as logic.
That’s why you keep:
❌ trading micro signals against macro structure
❌ believing every candle is a reversal
❌ ignoring invalidations because you “like the setup”
❌ frying your brain before you’ve even risked a dollar
You don’t need another indicator.
You need a logic system that crushes noise and exposes REAL probabilities.
🔥 The 3 Variables (The Part Traders Think They Understand… But Don’t)
Most traders “kind of” know what trend, zones, and candles are.
And “kind of” is exactly why they lose.
In this model, each variable has a precise definition, variations, and probability weights that change depending on the context.
You’re not reacting emotionally — you’re measuring.
That’s what makes the system mechanical.
1️⃣ Trend — The Market’s Actual Intent (Not Your Guess)
Definition:
The structural direction defined by higher timeframes — not the last 3 candles on 5M.
Variations:
Strong trend
Weak/aging trend
Neutral compression
Context impact:
A strong trend entering a strong zone with a confirming candle = high probability.
A tired trend hitting a counter zone = danger.
👉 Trend isn’t “up or down.”
It’s how mature and healthy that direction is.
2️⃣ Zone — Where the Real Decisions Are Made
Definition:
Price areas that actually matter: supply, demand, break/retests, major SR.
Variations:
Fresh zone (strongest)
Retested zone (usable)
Overused zone (dead)
Context impact:
Zones inside dominant trend → continuation setups
Zones against dominant trend → only valid with strong multi-timeframe alignment
Zones broken on mid-timeframes → bias must be re-evaluated
👉 Zones aren’t lines.
They’re probability clusters.
3️⃣ Candle — The Signal That Confirms… or Invalidates Everything
Definition:
The micro-expression of intent: rejection, displacement, absorption, continuation.
Variations:
Rejection wick
Displacement/imbalance
Compression
Fake strength traps
Context impact:
A “strong candle” in a weak zone means NOTHING.
A clean rejection + structure shift inside a strong zone + aligned trend = top-tier entry.
👉 Candles are not signals by themselves.
They’re filters.
💥 The Edge Isn’t the Variables — It’s Their Alignment
Anyone can draw zones and identify candles.
Losing traders do it every day.
The real edge comes from understanding:
how each variable shifts with context
how its probability weight changes
how alignment creates high-probability setups
how misalignment warns you to STOP IMMEDIATELY
Once each variable has a precise meaning
and precise behavior inside each context…
The system becomes mechanical.
No more emotional gambling.
No more “I think this is a reversal.”
No more overthinking.
Just one rule:
If the variables align → execute.
If they don’t → wait.
📶 The Only Timeframe Hierarchy That Makes Sense
📌 High Timeframes (4H / 1H)
→ Define true market bias
→ Only overridden by strong opposite confluence
📌 Mid Timeframes (30M / 15M)
→ Confirm or challenge the bias
→ Can create valid setups if rules align
📌 Entry Timeframes (10M / 5M / 2M)
→ Execution only
→ No bias allowed here
This structure kills FOMO, kills hesitation, and kills the “I changed my mind” syndrome.
🚀 The Two Setups That Actually Pay
1️⃣ Precision Setups (Low-Risk / High-Accuracy)
1:1 to 1:2
Clean, frequent, reliable.
2️⃣ Momentum Setups (When Everything Aligns)
1:3+
Rare — but violent and highly profitable.
If you’ve ever seen the market move exactly as you forecasted…
That was confluence.
You just didn’t know how to replicate it.
💀 Stop Trading Noise. Start Trading Probability.
This model does NOT eliminate all losses.
It eliminates the avoidable, stupid ones caused by emotional reactions and inconsistent bias.
Give me 10 trades executed under true confluence,
and the results explain everything.
📣 Want Chapter 2?
I’ll break down the full confluence model and the exact rules that make it repeatable.
Follow me here on TradingView,
save this idea,
and comment “CH2” if you want the next release.
More coming soon —
but only for the people actually paying attention.
Day 72 — AI Bubble Fears Hit the Market | S&P Futures RecapStarting to get a bit worried about the stock market. Everything feels tied to NVDA earnings this week, and we’re starting to lose major support levels across multiple timeframes. I took a few losses overnight, so I went into the morning a bit more hesitant and wanted to wait until the market slowed down before committing.
I made some small profits trading off Bia's order and took a few scalp trades off the 1-minute MOB, which helped stabilize the day. This wasn’t a high-conviction environment for me, so I stayed defensive and focused on execution.
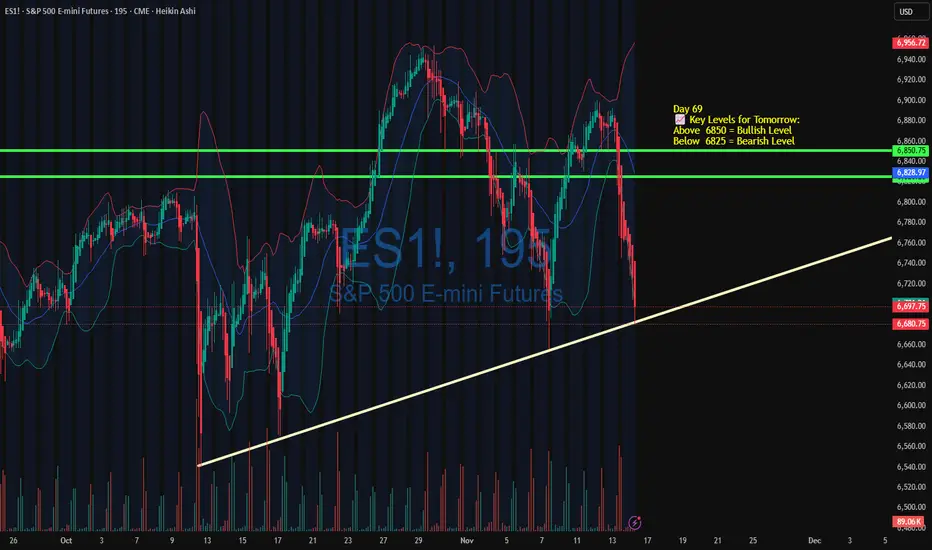
📈 Key Levels for Tomorrow
🔼 Bullish Above: 6725
🔽 Bearish Below: 6710
These are the two main pivot levels I’m watching.
Above 6725 we may see buyers regain control.
Below 6710 the bearish wave accelerates.

ES UpdateQuite the pump on NVDA earnings especially considering the stock is up only 5% AH.
Appears the algos are on and pumping, so I expect to go overbought, but that depends on jobs report (Sept data) and Fed meeting minutes tomorrow.
I'm guessing we get a 3 day rally like the last pump (overlay is the early Nov pump), then the selloff resumes next Tuesday. There is a potential of a Thanksgiving holiday melt up though.
I think I'll wait until the Fed meeting minutes before deciding what to do. No positions, I dumped my GM calls this morning. Did not enter into any trades, because of NVDA, jobs report, and Fed minutes.

ES Supply-Demand Long TradeTook a small position on buying the ES 15-minute level of demand.
Technicals = bullish/ mixed depending on outlook
Fundamentals = bullish
Sentiment = mixed
FED/News will impact this event.

NASDAQ BEARISHLooking at last weeks charts, I saw that it went very far up in the first few days but then plummeted, this week has seen that bear run go further down. If i had to say with NVDA earnings coming out soon, that it will be bearish overall.

Trendline Support hitPrice has pulled back into a key technical zone and is now testing a long-term rising trendline that has held multiple times throughout the past several weeks. This trendline has acted as a structural support area, aligning with prior swing lows and validating the broader uptrend structure.
Today’s decline pushed ES directly into this support, and the reaction here will likely determine the directional bias for the next session.
What I’m Watching:
Reaction to the trendline on the next retest
Whether volume confirms a true bounce or a breakdown
Price behavior as it re-approaches the highlighted green zone, which has repeatedly acted as both support and resistance
If we close under 6680 today, All is lost and we will drop a lot more.
Day 73 — Perfect Rejection at the 2-Hour MOB | S&P Futures TradiEnded the day +$529.40 trading S&P Futures. Today was a solid bounce back, with the morning analysis playing out almost perfectly. I managed to catch the top of the day and ride the momentum down right as we rejected the 2-hour MOB. It felt good to be in sync with the market structure, especially with the volatility leading up to the Nvidia earnings release. The signals were clean, the execution was sharp, and it was just one of those days where the plan came together.
🔑 Key Levels for Tomorrow
Above 6725 = Bullish Below 6710 = Bearish
📰 News Highlights
NVIDIA SHARES JUMP 5% AFTER 4Q REVENUE OUTLOOK TOPS ESTIMATE

Day 74 — Surviving a 242-Point Crash MoveEnded the day +$450.40 trading S&P Futures, but I’m walking away feeling tilted despite the profit. We sniped the 48-minute MOB resistance right out of the gate—just as planned in last night’s video—but I never expected the market to flush 242 points from top to bottom. That is a "market crash" level move. My P/L was a complete rollercoaster, swinging from +$400 to negative and back again. I’m grateful to end green, but after a session this volatile, I’m likely locking my account and taking a mental break tomorrow.
🔑 Key Levels for Tomorrow
Above 6725 = Bullish Below 6710 = Bearish
📰 News Highlights
BITCOIN FALLS 3% TO $87,000, LOWEST SINCE APRIL

ES 6700 Reaction Zone: Volume Cluster & Fair Value Gap SetupES formed a strong support at 6700, created by a sharp rejection, a heavy volume cluster, and a clean fair value gap. Buyers stepped in aggressively at this zone and turned the sell-off into an uptrend. The beginning of the volume cluster and FVG marks the key reaction point. Waiting for a pullback into 6700 gives a solid long opportunity.

ES - November 18th - Daily Trade PlanNovember 18th- Daily Trade Plan - 6:30am
*Before reading this trade plan, IF, you did not read yesterdays, or the Weekly Trade Plan take the time to read it first! (You can see both posts in the related publication section) *
If my posts provide quality information that has helped you with your trading journey. Feel free to boost it for others to find and learn, also!
My daily trade plan and real-time notes that I post are intended for myself to easily be able to go back and review my plan and how I did from an execution perspective.
--------------------------------------------------------------------------------------------------------
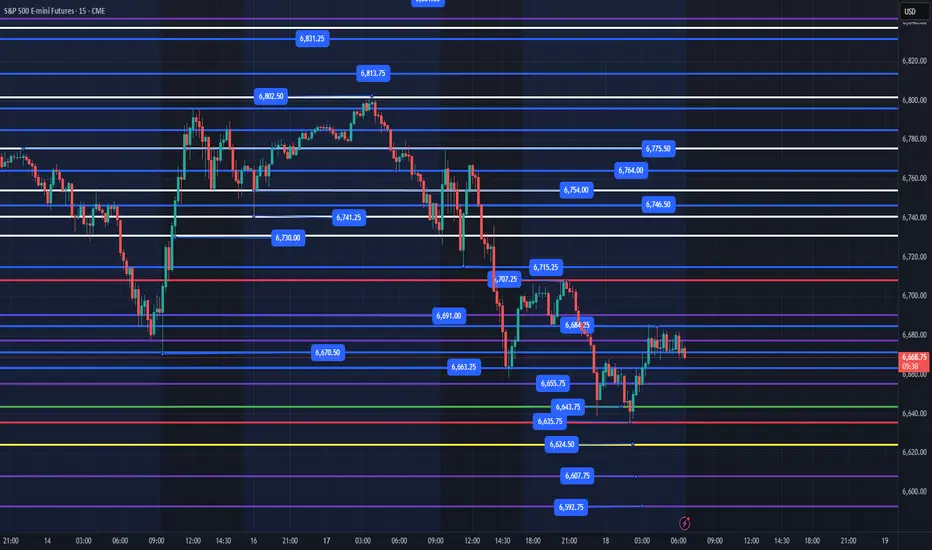
Yesterday, we had good reactions at our key levels. Price ultimately went lower into the last hour of trading, and we got a nice, failed breakdown of 6670 that rallied into the close to finish of the day. You can review yesterday's plan and price action by viewing the post in the related publication section.
Today we have a pretty straightforward plan that I will go over below!
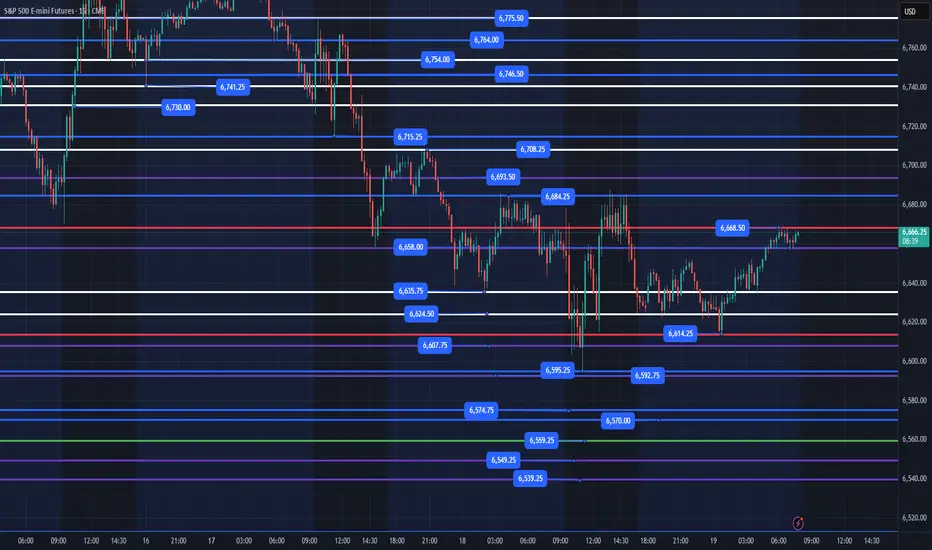
Our overnight high was 6707 (Right below our 6713 level from yesterday). Our overnight low was 6635 which we put in a nice, failed breakdown of 6643. This pattern of price losing a low, then quickly reclaiming that low is a pattern we will continue to see in a volatile and downward trending market. Price is building a really nice base between 6667 and 6684. I anticipate this will continue higher and retest the overnight high of 6707. Any reclaim of 6684 on a back test should give us a good entry or a flush of 6663 and reclaim would take us higher, also. Until price can clear 6715, price is still in a lower high, lower low trend!
Key Levels Today -
1. Loss of 6663 and reclaim
2. Loss of 6635 and reclaim
3. Reclaim of 6684 with a back test of this level for possible entry.
Below we have 6624 and some past weekly levels of 6607, 6592. These levels will be key and the flush of one of them and reclaim should keep us moving higher. The safer place to enter is to wait for it to clear the level from above, back test that level and then enter.
We have Thanksgiving next week and I would not be surprised if price tests the 6540 level by Friday and we rally end of the week as retail and sentiment becomes more bearish.
I will post an update around 10am EST
----------------------------------------------------------------------------------------------------------------
Couple of things about how I color code my levels.
1. Purple shows the weekly Low
2. Red shows the current overnight session High/Low (time of post)
3. Blue shows the previous day's session Low (also other previous day's lows)
4. Yellow Levels are levels that show support and resistance levels of interest.
5. White Levels are previous day's session High/Low
ES UpdateI guess I was right Friday afternoon, it is a repeat of teh circled area. Expecting everything to hit oversold tomorrow.
Gap direction will depend on FDAX which is oversold and at support. If it breaks support, indicators may not work because Europe will go into a free fall.
NVDA earnings Wed AH, jobs report THU premarket, Fed minutes Thu.

ES (SPX, SPY) Analysis, Levels, PA Forecast, Setups Fri (Nov 21)Analyzing Today’s Sharp Market Decline
The significant selloff observed today was not an arbitrary event. The day began with a robust rally following another impressive earnings report in the AI-chip sector, which propelled futures sharply upward and triggered a short squeeze in the Nasdaq. However, the release of a stronger-than-anticipated jobs report shifted the market's sentiment. While hiring showed signs of rebounding, the unemployment rate also ticked higher, undermining the prevailing narrative that the Federal Reserve would soon lower interest rates.
This development served as a stark reminder of the ongoing restrictive monetary policy, coupled with slowing economic growth and exorbitant valuations in the tech sector. Major investment funds capitalized on the morning’s strength in AI and large-cap stocks as an opportunity to reduce their risk exposure. Additionally, systematic trend-followers faced compulsion to sell once the S&P 500 fell below critical support levels.
The environment for high-beta assets, including cryptocurrencies, is already in a “reset” phase, which left little incentive for dip-buying at lower price points. As the E-mini S&P 500 futures broke through the previous day’s support levels, the situation escalated into a full liquidation. This perfect storm involved trapped long positions from the morning breakout, stop-loss orders falling into execution beneath yesterday’s lows, and mechanical selling, culminating in the largest intraday reversal since the spring.
Market Outlook
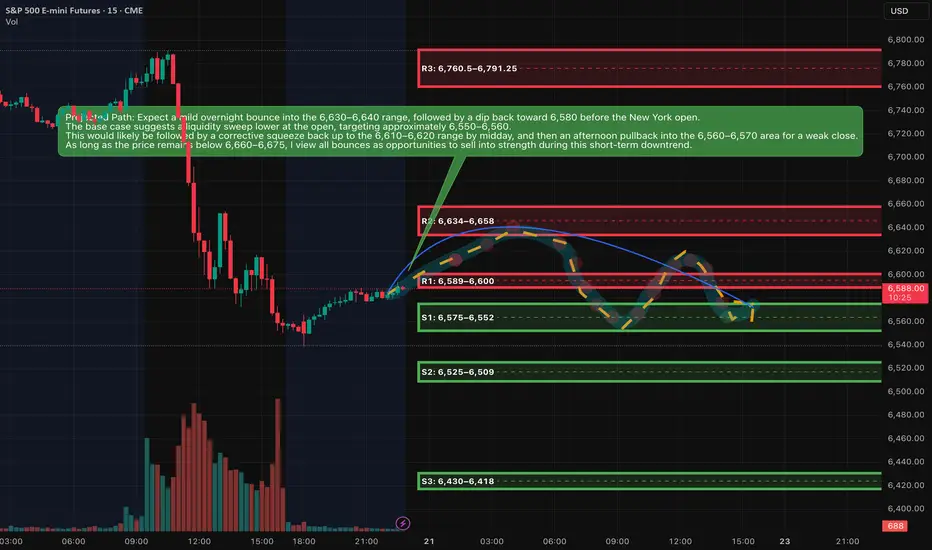
The current market sentiment is skewed bearish as the ES remains entrenched below the critical 6,660 to 6,700 range. The price is hovering near a significant demand zone established around the lows of the previous trading day and today’s New York session. While we can expect some upward bounces, these movements appear to be temporary rallies within an ongoing downtrend, rather than indicators of a potential new upward leg.
Market Analysis: Is This the Beginning of a Downtrend or a Temporary Shakeout?
In the recent developments within the E-mini S&P 500 (ES) on the daily timeframe, we’ve observed the formation of a distinct lower high following the recent all-time peak. This shift has seen prices breach the last identified higher-low area, establishing a new narrative. The sequence has transitioned from a higher high to a lower high, culminating in a movement into prior demand zones marked by increased volume, all while momentum appears to be rolling over.
On the four-hour chart, the prevailing trend reflects a series of lower highs and lower lows. The recent selloff has further entrenched this trajectory into the discount zone, now signaling proximity to the next Fibonacci retracement target below.
While momentum indicators have already dipped from overbought conditions, they have not yet reached deeply oversold thresholds, indicating potential for another leg downward following any short-term corrective bounce.
From a broader perspective, the long-term trend remains positive; however, a short- to medium-term corrective phase appears to be in play. Today’s market dynamics suggest we may be in the midst of this corrective leg rather than witnessing the final downturn.
As prices have recently entered a significant demand zone, a bounce lasting one to three sessions—or a period of sideways consolidation—seems likely before any potential further decline.
In summary, while current conditions favor a move towards lower prices in the days ahead, the market likely anticipates a "lower after a bounce" scenario rather than an immediate and steep decline.
Key resistance zones
Resistance is written as bands, not single ticks.
R1: 6,589–6,600
This band sits around the current Asia-session high and the underside of today’s New York low. It is the first lid above price. If rallies stall here, the tape stays heavy and favors another test of the lows.
R2: 6,634–6,658
This is the main breakdown zone from today, centered around the New York afternoon high and the upper edge of the late-session range. As long as ES trades below this shelf, the short-term downtrend remains intact and every bounce is suspect.
R3: 6,760.5–6,791.25
This band covers the New York morning low-to-high range and the origin of the big sell leg. If price ever retests this area and fails, it is a prime region for larger swing shorts. Only sustained trade and closes above this pocket would suggest the current corrective leg is ending.
---
Key support zones
S1: 6,575–6,552
This is the immediate floor combining the Asia-session low, New York afternoon low, and prior-day value low. It is where we are effectively trading now. Expect reactive bounces and stop-runs here, as both sides are active.
S2: 6,525–6,509
This is the next downside magnet if S1 breaks cleanly. It aligns with a fib extension and 4-hour demand. A decisive move into this region would represent the next step down in the correction.
S3: 6,430–6,418
Deeper extension and prior higher-timeframe demand. If the correction matures into a more serious pullback over several sessions, this pocket becomes a reasonable medium-term downside destination.
A++ Setup 1 – Short from R2 supply (continuation short)
Direction: Short
Entry zone: 6,638–6,648
SL (hard stop): 6,678
TP1: 6,588
TP2: 6,552
TP3: 6,515
Invalidation (structure):
If we get a 15m full-body close above 6,675, treat the short idea as invalid and stand aside; market is likely shifting into a squeeze toward 6,700+ instead of extending the down leg.
---
A++ Setup 2 – Quick-reclaim long from S1 demand (counter-trend bounce)
Direction: Long
Entry logic: need a flush then reclaim
Entry zone (after reclaim): 6,562–6,568
SL (hard stop): 6,538
TP1: 6,610
TP2: 6,638
TP3: 6,660
Invalidation (structure):
If price breaks below 6,552 and 15m closes stay below 6,545 without a fast reclaim, the bounce idea is invalid; then you wait for the deeper S2 zone instead of forcing longs here.
Good Luck !!!
Skittish marketThe structure in the daily chart of the S&P 500 implies a skittish market that is moving on concerns that fundamental reality. Therefore I am not looking for a big move down on Friday but rather a rest day and inside day as we go into the weekend.

S&P 500 E-mini Futures: Short Target Achieved, Long Setup 21.Nov
S&P 500 E-mini Futures: Short Target Achieved, Long Setup in Play
Today’s session on the S&P 500 E-mini Futures (ES) presented a textbook example of how patience and planning pay off in intraday trading. Let’s break down the trade idea, execution, and the next steps.
Market Context
Instrument: S&P 500 E-mini Futures (ESZ2025)
Current Price: 6,547.25 (-0.16%)
Timeframe: 15-minute chart
Session Behavior: After an initial push higher, the market showed signs of exhaustion near the previous high, creating an opportunity for a short scalp before considering a long re-entry.
Trade Recap: Short Position
Earlier today, a short position was initiated near the supply zone (highlighted in red on the chart) around 6,594.50, targeting a retracement toward the mid-range.
Entry: Around 6,594.50
Target: 6,532.25 (achieved successfully)
Reasoning: Price rejected the upper liquidity zone, forming lower highs and signaling a short-term bearish move. Volume spikes confirmed selling pressure.
This short trade hit its target cleanly, validating the setup and risk management.
Current Setup: Long Bias
With the short target achieved, the focus now shifts to a long re-entry. Here’s why:
Demand Zone: Price reacted strongly near 6,532.25, sweeping liquidity and bouncing back.
Volume Profile: Notice the spike in buying volume at the lows, suggesting accumulation.
Structure: The market is forming a higher low on the 15-minute chart, indicating potential bullish continuation.
Long Plan
Entry Zone: Between 6,532.25 and 6,528.25 (green zone)
Stop Loss: Below 6,523.25 (to protect against deeper liquidity sweep)
Target: Sweep of the day’s high near 6,604.75 or equal highs at 6,594.50 for partials.
Key Observations
Liquidity Sweep: The wick below 6,532.25 suggests stop hunts before reversal.
Risk-to-Reward: Favorable setup with tight stop and clear upside targets.
Market Sentiment: Despite intraday volatility, the broader trend remains bullish, supporting the long bias.
Conclusion
The short scalp was a success, and now the market offers a compelling long opportunity. Traders should monitor price action closely around the demand zone and manage risk diligently. If the bullish momentum holds, a sweep of the day’s high is likely.
✅ Pro Tip: Always wait for confirmation before entering a reversal trade. Volume and price structure are your best friends in identifying genuine shifts in momentum.
Do your own analysis before taking any decisions these are only my way of looking at the market today and valid for today only

Bullish Hidden Divergence Suggests Rally Toward ResistanceThe S&P 500 E-mini bounced off strong support near 6,567, forming a bullish hidden divergence on the MACD indicator. This signals potential upside momentum as price aims to retest the key resistance level at 6,953. Traders should watch for confirmation of this move to capitalize on a possible continuation of the uptrend.

ES - November 19th - Daily Trade PlanNovember 19th- Daily Trade Plan - 7:50am
*Before reading this trade plan, IF, you did not read yesterdays, or the Weekly Trade Plan take the time to read it first! (You can see both posts in the related publication section) *
If my posts provide quality information that has helped you with your trading journey. Feel free to boost it for others to find and learn, also!
My daily trade plan and real-time notes that I post are intended for myself to easily be able to go back and review my plan and how I did from an execution perspective.
--------------------------------------------------------------------------------------------------------
Quick recap of yesterday - Loss of 6635 and reclaim
We lost 6635 at the open and it was a pretty big solid red candle. We then had buyers' step in around 6603 and we had a battle between 6603-6635. We never reclaimed the 6635 level until 11:30am (15 min) candle and that was a great flush below 6603 and reclaim and that was the entry as we can see that price lost a key level (In this case it was weekly and session low) that when reclaimed rallied and you could have entered at any of the key levels above to rally into the 6684 resistance.
---------------------------------------------------------------------------------------------------------
Overnight low is 6614 and overnight high is 6668. As I type this trade plan, price is coming into the 6668 level and is trying to stay above 6658. This should be pretty straightforward today.
Key Levels Today
1. 6614 - We should get one more flush and reclaim of this level before we have to retest yesterday's low at 6595.
2. 6635 - This is the Bull/Bear line in this choppy range between 6684 - 6595. IF we can lose this level and reclaim it should be good for a bounce.
3. 6607 - Any loss and recovery of this level should give us some points.
4. 6595 - Highest Quality level that a loss down to 6581 and recovery should be a good level for points.
Below there and we do not have much of interest until 6570 with 6550 & 6539 the highest quality levels to engage in.
NVIDIA earnings are out after the bell, and my general lean is that price will not do too much today and should continue to chop in this range and overnight could have a sell off down to the 6540 level and then rally and put in the weekly low tomorrow. (This is not information I am trading on, just an observation of how price could react). I will be trading only the flush and reclaim of the levels I have outlined. Remember, we have Thanksgiving next week and I would not be surprised if price tests the 6540 level by Friday and we rally end of the week as retail and sentiment becomes more bearish.
I will post an update around 10am EST
----------------------------------------------------------------------------------------------------------------
Couple of things about how I color code my levels.
1. Purple shows the weekly Low
2. Red shows the current overnight session High/Low (time of post)
3. Blue shows the previous day's session Low (also other previous day's lows)
4. Yellow Levels are levels that show support and resistance levels of interest.
5. White Levels are previous day's session High/Low
ES - November 17th - Daily Trade PlanNovember 17th- Daily Trade Plan - 7am
*Before reading this trade plan, IF, you did not read yesterdays, or the Weekly Trade Plan take the time to read it first! (You can see both posts in the related publication section) *
If my posts provide quality information that has helped you with your trading journey. Feel free to boost it for others to find and learn, also!
My daily trade plan and real-time notes that I post are intended for myself to easily be able to go back and review my plan and how I did from an execution perspective.
--------------------------------------------------------------------------------------------------------
On Friday I posted an update note around 12:28pm and wrote a summary of the key levels and their reactions as we squeezed on Friday. I also wrote "Price can still reach 6808 and potentially as high as 6842. Price will need to cool off and needs to hold 6746 as it is the most significant level (Yesterday's Low) we could flush down to 6730 with no lower than 6713 with any pullback, but I would not be interested in any action until it recovered the 6746 level. IF that happens, we will have a shot of clearing 6892 next week and head to ATH's heading into end of month"
6pm open last night we quickly lost 6746 at the open down to 6740, quickly reclaimed 6746 and rallied overnight to 6802 before pulling back around the European open to 6764. This was a classic failed breakdown. WHY? We can see that 6746 was Thursday's low, it was also strong resistance on Friday and now we got more points from this level at the open and has been a strong support since the squeeze on Friday.
Overnight high is 6802 and low is 6741. Any loss of 6746 and reclaim should be good for another try at the overnight high. 6764 loss and reclaim should be another decent level for some points.
Key Levels Today-
1. Loss of 6764 and reclaim
2. Loss of 6741-46 and reclaim
3. Loss of 6731 (maybe down to 6721 area) and reclaim
4. Loss of 6713 and reclaim
5. Loss of 6670 and reclaim (Highest Quality - Friday's Low)
Support Levels - 6764, 6741-46, 6731, 6713, 6703, 6691, 6677, 6670, 6654, 6643
Resistance Levels - 6775, 6785, 6802, 6813, 6831, 6842, 6851,
I will post an update around 10am EST
----------------------------------------------------------------------------------------------------------------
Couple of things about how I color code my levels.
1. Purple shows the weekly Low
2. Red shows the current overnight session High/Low (time of post)
3. Blue shows the previous day's session Low (also other previous day's lows)
4. Yellow Levels are levels that show support and resistance levels of interest.
5. White Levels are previous day's session High/Low

ES1 - Scary Face Done, Markets Warming Up
A fast bullish whipsaw recovery needed to arrive or very bearish scenarios could play out.
And now that bullish whipsaw may well be printing to pull the trend out of the fire.
On S&P Futures this may prove to be a slightly lower low liquidity shakeout and moving on up.
If it gets impulsive here then its even possible that the correction is over with no bearish cause carried over.
Stocks are warming up and crypto (TOTAL and BTC) are bouncing from tidy ratios - signalling a potential bottom.
Its been a scary area but this is likely to be the prime dip buy territory.
Assets warming up today may be starting new bull trends whereas assets sitting quietly may not.
This all remains relevant so long as there is not another stock index upside whipsaw.
If there is then its back to the bearish lens - but its looking good here and there are plenty of breakouts in ... stocks.
As said before, the 1.618 is a little way above and that is the next ratio based liquidity juncture.
If S&P can get moving then I think it gets there and we may see some significant bull trends 🧐.

HOW-TO: Analyze Support, Resistance & Short-Term DirectionHOW-TO: Analyze Support, Resistance & Short-Term Direction Using Volume Scope Pro (1H Example)
Introduction
This HOW-TO explains how to use the Volume Scope Pro — Order Flow Volume Analysis indicator to identify support and resistance, interpret order-flow signals such as absorption and distribution, evaluate buyer/seller strength, and determine a short-term market bias on the 1-hour timeframe.
1 — Chart Settings & Data Inputs
• Main timeframe: 1H
• LTF (Low-Timeframe data): 15-second volume blocks
• LTF coverage: ~115 bars
• Instrument: MES1! (CME Micro E-mini S&P 500)
This setup provides a high-resolution view of order flow behind each hourly candle by aggregating ultra-low timeframe volume behavior.
2 — Buy & Sell Volume Behavior
BUY Side:
• Buy Current Amount ≈ 18.539K
• 20-period Buy Average ≈ 54.044K
→ Buyers are significantly below their normal activity level.
→ Interpretation: Buyers are NOT supporting current price levels.
SELL Side:
• Sell Current Amount ≈ 17.073K
• 20-period Sell Average ≈ 50.857K
→ Sellers are also below average, but buyer weakness is far more pronounced.
Summary:
In higher timeframes like 1H, lack of buyer activity is often more important than strong selling. Here, buyers are too weak to create a sustained bottom.
3 — Trend Angle Convergence & Divergence (Trend θ)
BUY:
• Price vs Buy Volume (3 and 20 periods) = Divergent
→ Price attempts to hold or bounce are NOT backed by buyer aggression.
SELL:
• Price vs Sell Volume (3-period) = Convergent
→ Short-term movement is driven by sellers, strengthening the bearish bias.
4 — Delta Analysis
• Current Delta ≈ +1.46K
• Global Delta (100 candles):
– Positive Δ Sum ≈ 273.812K
– Negative Δ Sum ≈ 225.671K
Interpretation:
Although short-term delta is positive and long-term delta slightly favors buyers, the price structure does NOT reflect bullish dominance.
This type of delta behavior often indicates absorption rather than a trend shift — meaning buyers are active but ineffective at moving price.
5 — Support & Resistance Zones (SR Engine)
Volume Scope Pro identifies two main zones:
• Resistance Zone: 6880.75 ~ 6885.25
• Support Zone: 6707.75 ~ 6766.75
Current Position:
Price is holding inside the upper boundary of the Support Zone.
There was a minor bounce, but the reaction lacked strength and failed to break structural highs.
6 — Order-Flow Overlay Signals (OB / Distribution / Absorption)
• Multiple OB and Distribution labels appear near upper structure → clear signs of supply, selling pressure, and exhaustion at highs.
• OS and ABS signals at support did not result in meaningful continuation → weak follow-through from buyers.
Combined with weak buy volume, the market shows bearish intent.
7 — Short-Term Projection
Given:
✓ Weak buy volume compared to averages
✓ Sellers showing short-term dominance
✓ Converging sell-side angles
✓ Price reacting weakly to support
✓ Strong supply clusters above
✓ Delta showing ineffective buying
→ Short-term bearish continuation is the more probable scenario.
As shown on the chart, the Short Position tool highlights:
• Entry around the upper support boundary
• Stop above the minor pullback high
• Target near the lower support boundary
This forms a clear, structured bearish setup with defined R:R.
Disclaimer
This publication is for educational purposes only. Volume Scope Pro does not guarantee profit or certainty of market direction. Traders must perform independent risk management and verification at all times.

ES (SPX, SPY) Analysis for Week Ahead (Nov 17th - 21st)Market Analysis: ES1 - Navigating Recent Price Action and Upcoming Economic Catalysts
Current Price Context:
The E-mini S&P 500 (ES1) is currently trading in the range of 6,755 to 6,785, following a sharp pullback from the 6,880 to 6,900 peak and a notable rebound off the 6,650 levels. While both the weekly and daily structures exhibit an overarching uptrend characterized by higher highs and higher lows, we are presently experiencing a mid-pullback phase, with prices resting below a newly established supply zone spanning 6,850 to 6,900. Importantly, we remain above the key demand shelf situated around 6,650 to 6,670.
Big Picture Overview: Weekly and Daily Trends
- Weekly Analysis: Over recent months, ES has ascended from approximately 6,000 to the 6,900 level. The past few weeks have seen a new high printed, followed by a red candle signaling a pullback towards mid-range levels. Despite this corrective move, we maintain a buffer above the preceding weekly low near the 6,500 to 6,550 range, affirming the uptrend. The current price action appears more as a corrective pause rather than a definitive peak.
- Daily Perspective: After reaching a new high just shy of the 6,900 mark, the market retreated into the mid-6,600s before bouncing back. Recent daily candles indicate a phase of consolidation within the 6,730 to 6,780 range, characterized by wicks on both ends and diminishing body sizes, alongside reduced volume compared to earlier volatility. Oscillator indicators are retreating from overbought conditions but appear to be stabilizing, suggesting a digestion phase rather than a full-scale momentum breakdown.
Shorter Timeframe Analysis (4-Hour and 1-Hour):
- On the 4-hour chart, a completed downward impulse from around 6,880 to the low 6,650s has been observed, with the price touching the 1.272 Fibonacci extension at approximately 6,653. Additional Fibonacci levels below include 6,597 (1.618) and 6,536 (2.0). The price action around the 1.272 extension has prompted a robust response, featuring significant green candles and increased volume, establishing a base between 6,700 and 6,800.
- On the 1-hour chart, the market exhibits a minor uptrend (from lower lows to higher highs) that has encountered resistance around 6,780. Currently, price action is consolidating near a pivot level of 6,750, leading to the establishment of a balance range between 6,720 and 6,780 as we head into Monday.
Summary: The broader context remains bullish on higher timeframes, with a corrective phase taking root on the medium timeframe, while the short-term landscape indicates balance. This scenario represents a classic "trend pullback parked on key support," with next week's developments likely steering us either back toward the highs or engendering a deeper test of 6,600 or 6,550, contingent on forthcoming economic data and Fed commentary.
Macro and Event Landscape: A Busy Week Ahead
The recent U.S. government shutdown has resulted in a considerable backlog of economic data releases. Market participants will be closely monitoring delayed payroll data, along with other significant indicators such as industrial production and housing metrics that are being released simultaneously. This aggregation of data is anticipated to introduce intraday volatility, particularly during the 8:30 to 10:00 AM ET windows.
Key Economic Indicators to Watch:
- Core Data Releases: In the week of November 17–21, critical releases include:
- Empire State manufacturing index
- Import and export price indices
- Industrial production and capacity utilization figures for October
- Housing starts and building permits scheduled for mid-week
- Additional delayed labor data later in the week as agencies address the backlog.
- FOMC Minutes and Fed Commentary: The release of the FOMC minutes from the late October meeting will communicate the Fed's confidence in the recent improvements in inflation and its openness to potential rate cuts in December. A lineup of Fed speakers is set to take the stage, likely influencing market sentiment and causing price reactions based on their comments.
- Corporate Earnings: Noteworthy earnings reports from Nvidia and major retailers, including Walmart, are on the calendar. Nvidia's performance will be scrutinized as a barometer for the AI segment, while insights from retail giants will provide a glimpse into consumer health as the holiday season approaches. Strong results coupled with optimistic guidance tend to buoy ES, while any disappointments could weigh on index futures, especially given the concentrated leadership from a handful of major tech stocks.
Market Sentiment and Positioning: Rate-cut expectations for December have decreased to about 40%, leaving investors cautious but not overly alarmed. This environment allows for potential relief rallies if data and Fed sentiments tilt favorably, while a series of negative reports may trigger a notable risk-off sentiment.
Conclusion: The upcoming week is poised to be event-driven, lacking a singular "mega" release like CPI but rather presenting a series of medium-to-large catalysts (Fed minutes, late payrolls, industrial production, housing statistics, Nvidia, and Walmart). Traders should be prepared for choppy conditions and liquidity fluctuations around the release times, with clearer directional moves anticipated between these events.
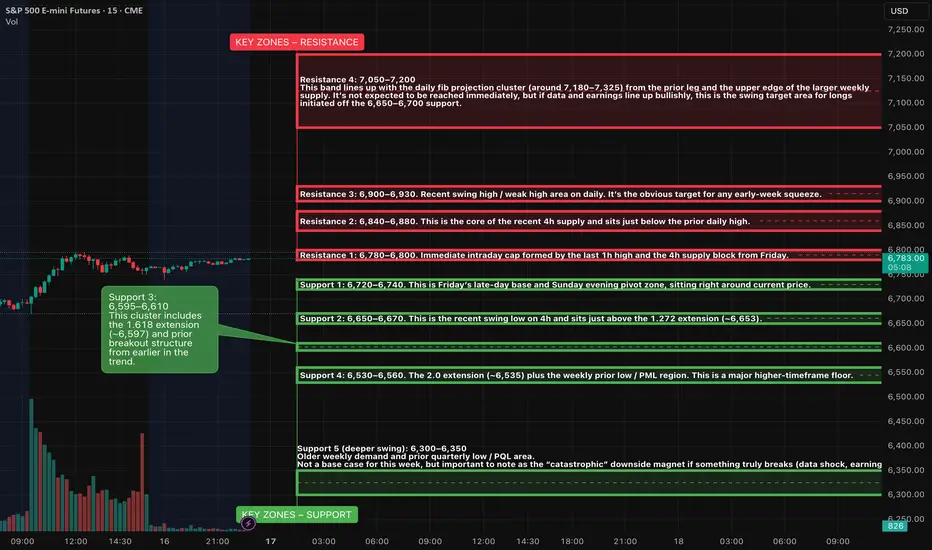
KEY ZONES – RESISTANCE
Resistance 1: 6,780–6,800
Immediate intraday cap formed by the last 1h high and the 4h supply block from Friday. This is the ceiling that has repeatedly turned price in the last session. A 1h or 4h close above 6,800 would confirm that buyers are back in control and likely aim for 6,850+ fairly quickly.
Resistance 2: 6,840–6,880
This is the core of the recent 4h supply and sits just below the prior daily high. It’s where the last strong sell program launched. If price trades into this pocket on light volume and stalls, that favours a lower-high top and another rotation back toward 6,720–6,700. If the tape pushes through decisively, shorts will be forced to cover.
Resistance 3: 6,900–6,930
Recent swing high / weak high area on daily. It’s the obvious target for any early-week squeeze. If this zone gets cleaned out and holds on the retest, the uptrend resumes and we can start talking about higher fib extensions and a run toward the 7,000 handle. A sharp rejection here, especially around Fed minutes or Nvidia earnings, would fit a double-top pattern and could kick off a deeper pullback leg.
Resistance 4: 7,050–7,200
This band lines up with the daily fib projection cluster (around 7,180–7,325) from the prior leg and the upper edge of the larger weekly supply. It’s not expected to be reached immediately, but if data and earnings line up bullishly, this is the swing target area for longs initiated off the 6,650–6,700 support.
KEY ZONES – SUPPORT
Support 1: 6,720–6,740
This is Friday’s late-day base and Sunday evening pivot zone, sitting right around current price. It lines up with the 1h equilibrium where price has been rotating. As long as ES holds above 6,720 on closing basis, buyers are defending the immediate balance and can make another push toward 6,780–6,800.
Support 2: 6,650–6,670
This is the recent swing low on 4h and sits just above the 1.272 extension (~6,653). It’s the first real higher-timeframe demand pocket of this pullback. A clean tag and strong bounce here would look like a classic trend-pullback low forming. A sustained break under 6,650 would suggest the market isn’t done repricing and opens the door to the deeper fibs.
Support 3: 6,595–6,610
This cluster includes the 1.618 extension (~6,597) and prior breakout structure from earlier in the trend. It’s the “deeper but still healthy” retrace area; if ES flushes into this band on bad data then snaps back, it can still preserve the weekly uptrend. Failing here would start to threaten the bullish structure and invite a test toward the prior weekly low.
Support 4: 6,530–6,560
The 2.0 extension (~6,535) plus the weekly prior low / PML region. This is a major higher-timeframe floor. If ES ever gets here this week, the tape is likely under stress, but it also becomes the zone where large buyers usually test the waters for a bigger swing entry. A weekly close below ~6,530 would be the first real warning that the uptrend is morphing into something more corrective or even distributive.
Support 5 (deeper swing): 6,300–6,350
Older weekly demand and prior quarterly low / PQL area. Not a base case for this week, but important to note as the “catastrophic” downside magnet if something truly breaks (data shock, earnings disaster, geopolitical flare-up).
SETUPS – WEEK AHEAD IDEA PACK
1. Trend-pullback continuation long from support
Location: 6,650–6,670 primary, 6,595–6,610 secondary.
Trigger idea:
Look for an overnight or early-week sweep into 6,650–6,670 that quickly rejects (long lower wick on 1h / 4h, strong reclaim back above 6,680). Ideally, this happens outside the heaviest data windows so it’s more order-flow driven than headline noise.
If that fails and price drives into 6,595–6,610 instead, repeat the same logic there: washout, strong reaction, then a reclaim of 6,620–6,630 as confirmation that buyers stepped in.
Upside path from this setup:
First target is the 6,780–6,800 cap. If that gives way, next magnet is 6,840–6,880, then a possible extension run at the 6,900–6,930 recent high area. Later in the week, if macro tailwinds show up, this move can stretch toward 7,000 and, in an optimistic case, into the 7,100+ fib cluster.
Risk management conceptually:
From a swing perspective, the “line in the sand” for this idea is under 6,595. A clean daily close below that level would invalidate the shallow-pullback idea and suggest we are heading toward 6,530–6,560 or lower.
2. Short-term fade from the 6,840–6,880 / 6,900 pocket
Location: 6,840–6,880 first, 6,900–6,930 as extension.
Trigger idea:
If ES trades up into 6,840–6,880 ahead of Fed minutes or the Nvidia/Walmart prints and shows tired price action (long upper wicks on 15m/1h, loss of intraday momentum, failure to hold above 6,860), that area is attractive for a tactical short aiming back toward the 6,780–6,750 pivot.
A more aggressive fade is possible into 6,900–6,930 if the first test breaches 6,880 but immediately stalls at the prior high.
Downside path from this setup:
First magnet is the 6,780–6,800 band, then the balance base at 6,720–6,740. If that gives way on a macro shock, sellers can push for a retest of 6,650–6,670.
Risk management conceptually:
For shorts initiated at 6,840–6,880, a protective stop makes sense above 6,910–6,920. Fades taken into a full sweep of 6,900–6,930 should respect a hard stop above ~6,950; above that, risk of a proper breakout toward 7,000+ increases sharply.
3. Range-trade scalps inside 6,720–6,780
While ES is stuck inside this intraday box, there is room for mean-reversion trades: buying dips into 6,720–6,730 and selling pushes into 6,770–6,780 with tight intraday stops. This is a lower-quality idea compared to the bigger levels, but it’s relevant if Monday and early Tuesday stay choppy while everyone waits for the meat of the calendar mid-week.
ES - November 21st - Daily Trade PlanNovember 21st- Daily Trade Plan - 6:45am
*Before reading this trade plan, IF, you did not read yesterdays, or the Weekly Trade Plan take the time to read it first! (You can see both posts in the related publication section) *
If my posts provide quality information that has helped you with your trading journey. Feel free to boost it for others to find and learn, also!
My daily trade plan and real-time notes that I post are intended for myself to easily be able to go back and review my plan and how I did from an execution perspective.
--------------------------------------------------------------------------------------------------------
I mentioned the following a couple of times this week in my Daily Trade Plan -
"Remember, we have Thanksgiving next week and I would not be surprised if price tests the 6540 level by Friday and we rally end of the week as retail and sentiment becomes more bearish."
Yesterday's Daily Trade Plan I wrote the following:
"Price can reach 6775-85 area that will be a good resistance level. As I have said many times, when price rallies like it has before the NYSE Open, it could be a trap, and Institutions could start selling around the 6775-85 area. We will need to see what price does in the first hour."
In my note at 1:55pm yesterday I wrote -
"Price is trying to lose the daily low and if we do, we should be looking at 6570 (Reclaim of 6592) or 6540 (Reclaim of 6550) being the next key levels to grab some points. When price has such a massive red day the way it has been on the 1hr chart. It is better to wait for the weekly lows and be patient."
Yesterday it looked like price was going to just take off and we had found our low for the week, then Institutions pulled the rug at 6790 and when you have more than 2 - (15 min red candles) like we did yesterday, just wait and be patient for price to find a low, flush it and recover it. Price tried to recover 6592 late afternoon but couldn't. Since we had a massive red day, we should attempt to retest the levels above all the way up to 6726 at minimum when we get the squeeze higher.
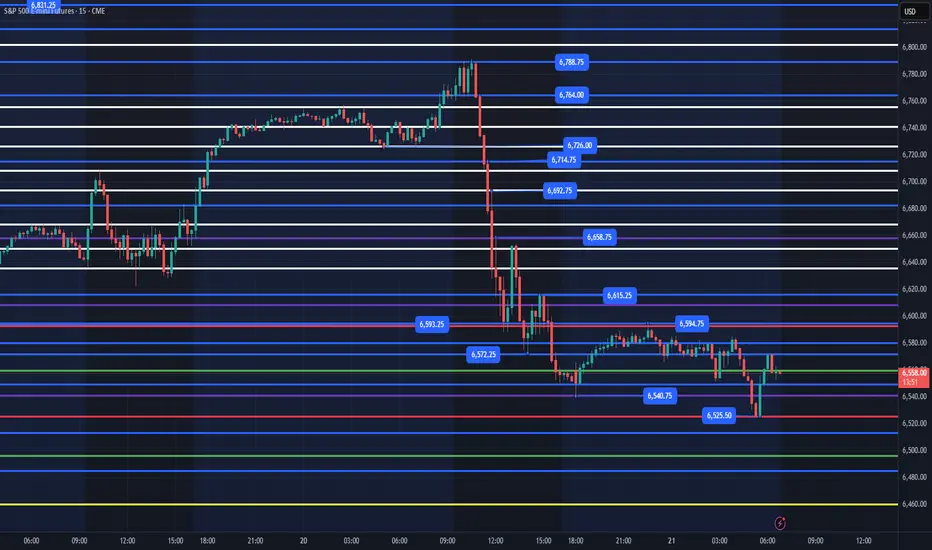
Overnight high is 6594 and the low is 6525. We attempted this am a nice flush and recovery of 6540 (Yesterday's Low) but have found resistance at 6570. If price can take out the 6594 level and back test it to move higher, that would be a nice level to look for points to take us higher. Below that we need to flush 6540 and reclaim or 6525 and reclaim.
I have no idea what price will do today, but my general lean is that we flush 6540 or 6525 and reclaim these levels for a squeeze higher. If price is flushing lower, I will just wait for the reclaim of these levels to ride higher. The other level I will be watching is 6594 and looking for a back test of that level to enter for higher prices.
Key Levels Today -
1. 6540 flush and reclaim
2. 6525 flush and reclaim
3. 6594 take out this level and enter on a back test.
We might only get a sell off down to 6550 with price taking out 6572 would be a good micro level to enter for a test of 6594.
I will post an update around 10am EST
----------------------------------------------------------------------------------------------------------------
Couple of things about how I color code my levels.
1. Purple shows the weekly Low
2. Red shows the current overnight session High/Low (time of post)
3. Blue shows the previous day's session Low (also other previous day's lows)
4. Yellow Levels are levels that show support and resistance levels of interest.
5. White Levels are previous day's session High/Low