Trap or Triumph?Is Ajax, the ''human fortress,'' luring Hector into a trap or is Ajax tiring? The dueling drama continues.
The px is coiling. It will breakout, whether up or down remains to be seen.
Reasons for it to break up.
1.Historical bull market
2.Q2 GDP est. +3.8%
3.Bulls have pushed back hard against the bears with massive volume, defending the vpoc.
4.Bears appear to be tiring - ascending triangle (px coil) and 9/26 10:00 exhaustion candle
5.Bulls have forced a close above 4 strong resistances.
6.Picture perfect double bottom on a one-hour chart
7.Almost too many reasons to list.
There is much financial news due out next week. I refer you to www.marketwatch.com and its U.S. economic calendar. Perhaps they are waiting for some direction from that basket of goodies. Most notably, the jobs report is a market mover. It comes out the first Friday of every month. That will be 10/3 at 08:30. There has been much controversy surrounding their numbers of late. Their numbers were found to be way overinflated. E.J. Antoni has been recently appointed. He is a real sharp guy.
How many bureaucrats does it take to change a light bulb? Seven. One to say everything is under control and six more to file reports saying it was not broken after all.
Whatever happens, we know how to manage margin, and our Trifecta Trading Plan of Breakouts, Dips and Pivots gives profits as we provide liquidity to the markets.
Trade ideas

Bloody Battlefield It's not over. 9/26 the bulls, breathing fire and dripping blood from the mighty sword of Monster H&S, breached four heavily fortified entrenchments. Can they hold this ground and advance?
We shall rewrite Greek mythology. Ajax, Greek warrior, 2nd only to Achilles, huge in stature, dueled Hector, Prince of the Trojans, to a draw. In this rematch Ajax, aka Monster H&S, will lose.
MNQ will go higher. If not now - definitely in the future.
Right now, Hector has firm footing. On 9/17 @ 14:00 NY time, with courage and strength, he defended his city, his family and his beloved wife, vpoc, with a mighty hammer blow. Twice more he stuck his foot in the ground and pushed back Ajax. Neigh, thrice. On 9/26 10:00 NY time, Ajax tired, Hector drove hard on him, pushing him back.
These heroes from antiquity battle on. A Pall of Darkness has descended from the heavens. Though we hear the clashes of hammer and sword and shields and their mighty shouts as they cry out, we cannot see them but for the Darkness. We shall take up this narrative when the Pall of Darkness lifts.


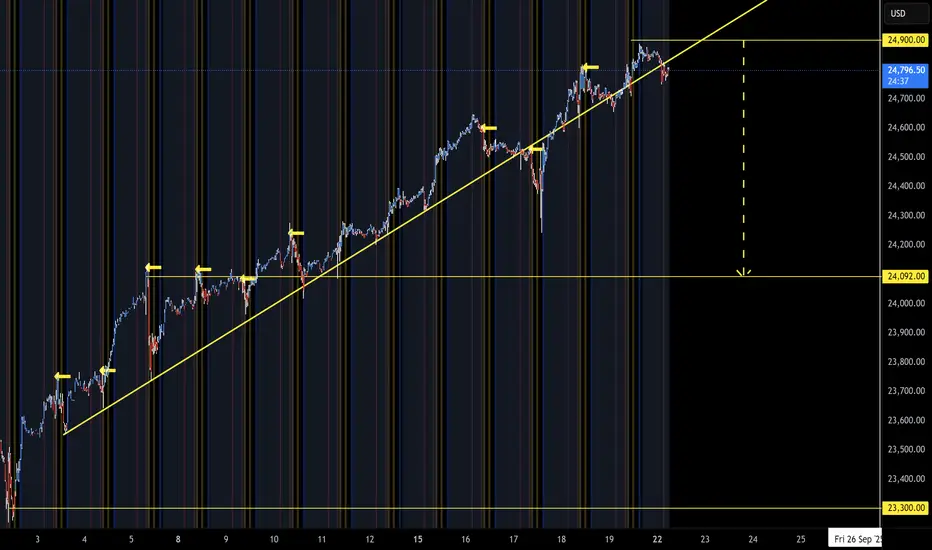
NQ Targets (09-22-25)NAZ with Friday-Monday O/N breakdown into Monday Open Drive (looking for Open Dive today). 24,900 is KL, Long above Short Scalp below to drop target test below.
4HR below with Blue YTD open level.
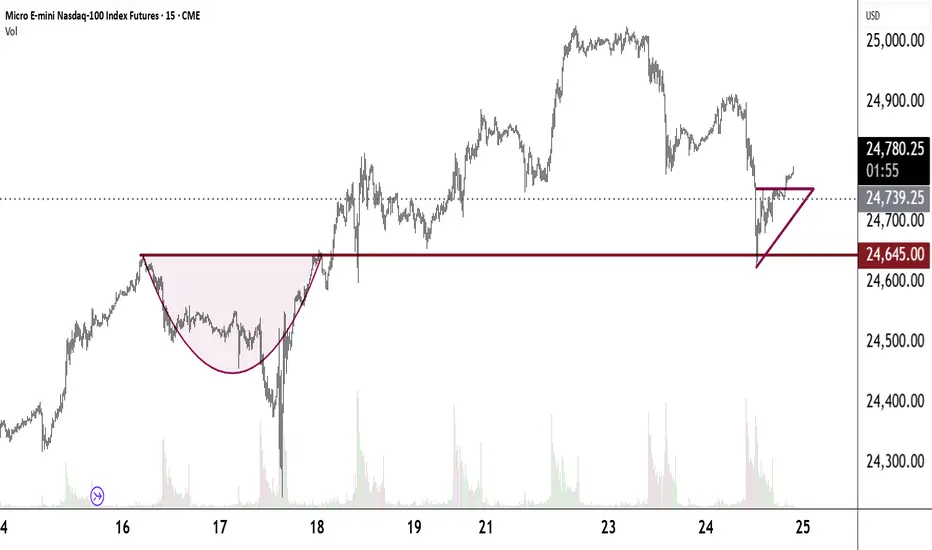
NQ Long I know it may sound a bit unusual to long with too much blood on the streets, but given the current conditions, as long as we are not trading below 24K, taking a long position remains the most logical option for me.
This long setup becomes invalid if price fails to follow the exact path I outlined in the green drawing. If price does not break above the yellow trendline, then a continuation to the downside remains the more likely scenario.

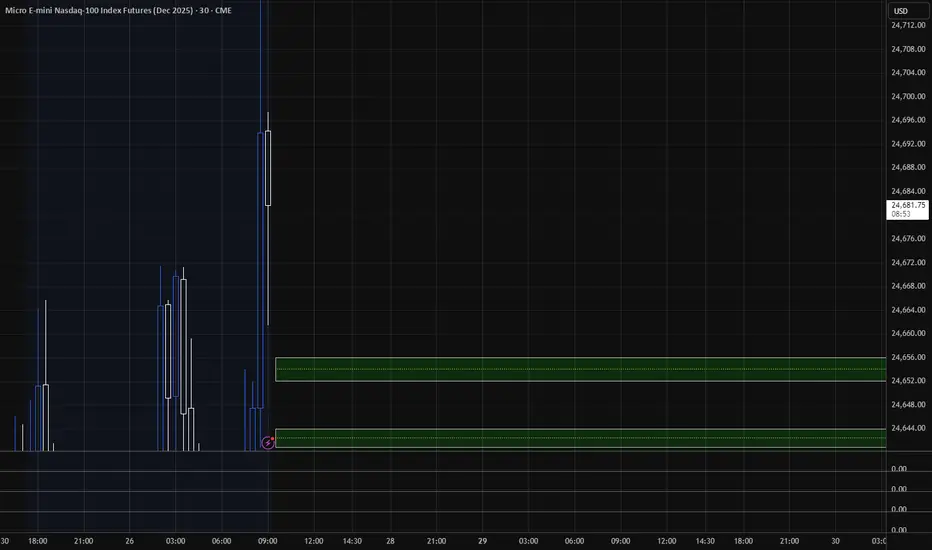
A Bullish Friday for NasdaqNow that support has been reached, I’m anticipating Nasdaq to resume its bull run. During the AM session, I’ll be watching for either a double bottom or an inverse head-and-shoulders pattern to form.
On the daily chart, I’m anticipating a rejection from the 24,600 Daily FVG.
It may be too early to confirm, so I’ll revisit and update this idea in the morning.
Lets go Long⚡

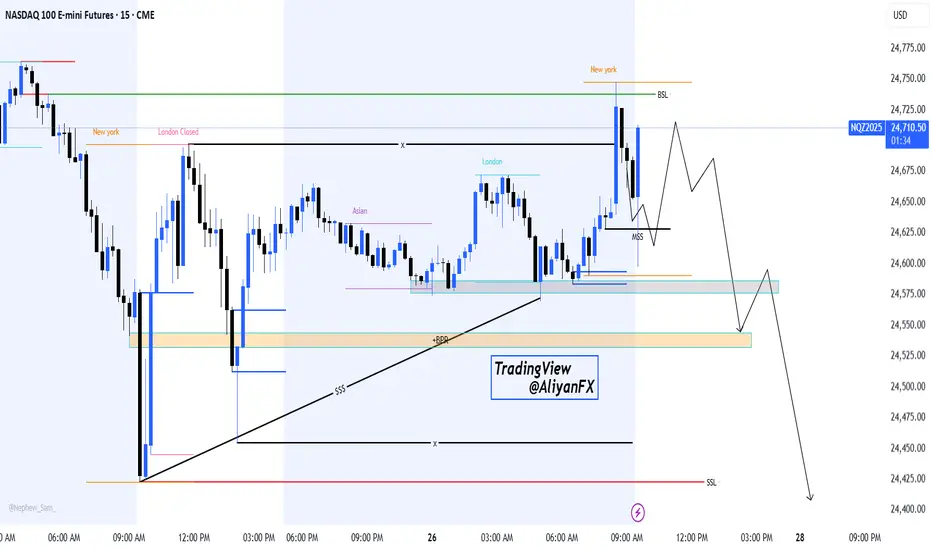
NASDAQ 100 – Potential Liquidity Grab & Bearish Continuation SetHello Billionaires!!
We All know that the Price has swept the New York session high (BSL) and is now showing signs of a potential market structure shift (MSS). If the short-term pullback holds, we may see a deeper retracement toward the demand zone (BPR + Asian range) before another leg down.
🔹Key Levels to Watch:
24,725 – 24,750: Liquidity grab zone (recent NY high)
24,575 – 24,550: Re-test area for possible continuation
24,500 – 24,450: Next downside target if bearish momentum continues
Bias: Short-term retracement followed by potential bearish continuation toward lower liquidity pools (SSL).
📌 This is an educational projection, not financial advice. Trade safe and always manage your risk!
Target areas - NQ price for Market open.9/26/25 These are the target areas - NQ price for Market open depending if price moves up or down. Will look for trades into these areas.
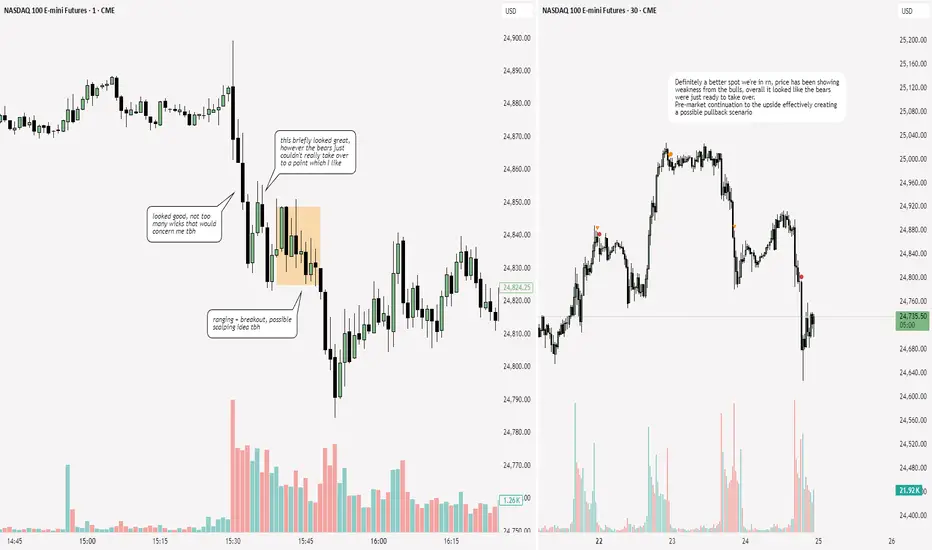
NDX/NQ1 - Morning Full Of Volume, Afternoon Full of TrapsGood Morning,
I hope all is well. Although I have not posted in a while, I am still very active. Having created a new strategy I can now start sharing posts to help you better your swings and day trading activity.
Read the chart for a quick analysis on the Nasdaq market conditions, which I use for my evaluation of the current economic standings on how the market will play out.
We have had quite the significant drop with the NDX over the last two days, This is due to a much needed correction. Right now the Nasdaq has exhausted the drop and traders will have some reprieve today in more favorable market conditions for the morning.
Avoid trading the afternoon today as it could be messy pending pull back is completed and follows through with its bearish wave pattern again.
Good Luck Today!

Nasdaq Pre-Market Long CIB Trade🔱 Here comes the CIB Trade 🔱
Price came down in 5 waves.
The CIB line gives us a heads-up if price breaks through it, and it did!
Now everyone and it's Grandma is long on the breakout.
"...let's scare them out, let's hit their Stop!"
Then we take off upon a test of the CIB-Line, which in essence is the same as a test fo a U-MLH or L-MLH after a break.
We have a nice target with a chance to hit of about 80% at the Centerline, and a fantastic tiny stop below the test at the CIB line.
Let's watch how this unfolds.

NQ - 9/26Alright, I think there is value to keeping the same T.A. as yesterday then updating the T.A. as each day goes so that I'll be more motivated to write out the MarketMeta better.
These are journals but I understand others want to understand the candle science of ranges and the 4 candles and 6 levels they create. It took me a long time to comprehend it as I studied the courses from C0TT0NC4NDYTA.
StudyGuideTA is the simplified version - AKA my personal notes and understanding using his definitions or "Science" of trading.
Yesterday's levels were tested and changed to dotted lines. Thick 2x yellow level Inv.BS evolved its role to a "bridge" - This is like the polarity point where levels is acting as resistance but then will act as support as price crosses and closes above it.

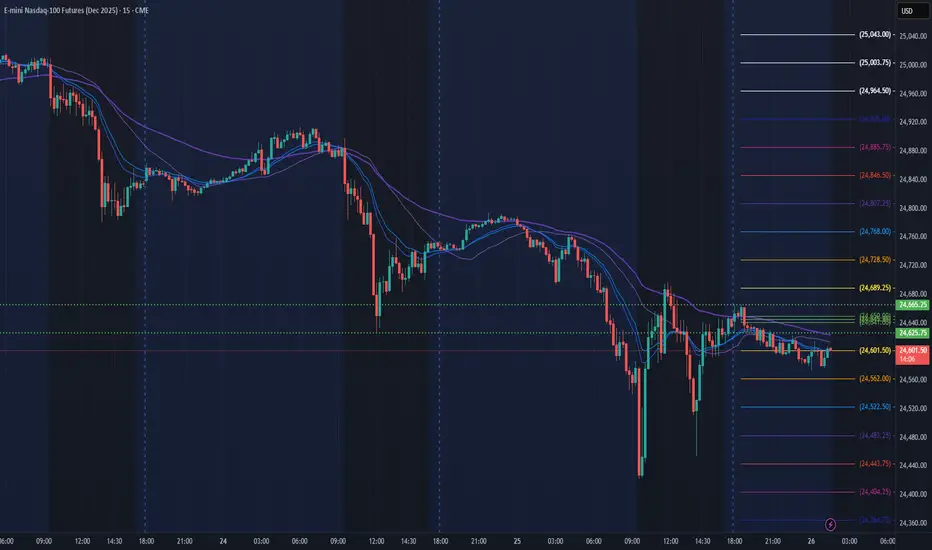
NQ Power Range Report with FIB Ext - 9/26/2025 SessionCME_MINI:NQZ2025
- PR High: 24665.25
- PR Low: 24625.75
- NZ Spread: 88.5
Key scheduled economic events:
08:30 | Core PCE Price Index (MoM|YoY)
Session Open Stats (As of 1:15 AM 9/26)
- Session Open ATR: 276.26
- Volume: 29K
- Open Int: 277K
- Trend Grade: Long
- From BA ATH: -1.7% (Rounded)
Key Levels (Rounded - Think of these as ranges)
- Long: 25204
- Mid: 23571
- Short: 21939
Keep in mind this is not speculation or a prediction. Only a report of the Power Range with Fib extensions for target hunting. Do your DD! You determine your risk tolerance. You are fully capable of making your own decisions.
BA: Back Adjusted
BuZ/BeZ: Bull Zone / Bear Zone
NZ: Neutral Zone

Double Bottom on VPOC vs Monster Head & ShouldersWho will win this epic battle? A close above the neckline and then a bounce off it...No matter - I have Breakout Orders every 10 points beneath it and every 5 points above it. Every entry has a 19-point target.
Pros:
1.Historical bull run - The Fourth Indusrial Revolution
2.2nd QTR GDP 3.8%
3.Growth-oriented administration
4.Peace-minded administration
5.Deregulations being slashed
6.Industries are onshoring
7.Terrific tax incentives to buy, build and grow
8.Earnings strong: S&P 500 up 7.7% YOY; 9 consecutive QTRs of gains
Watch carefully PCE report Friday, 08:30 NY time.
If the markets like it, we may easily dance on top of old man's head and then go higher. If they don't - we'll be ready to Buy the Dips and Pivots.
Stay tuned.

yesterday tradethis is i post yesterda, very nice trade.
Overall Trend:
There is a clear downward trend in recent sessions, with the price dropping significantly from levels near 25,000 USD down to around 24,482 USD.
The recent movement shows strong selling pressure, with a sharp decline in the latest hours.
Support and Resistance Levels:
Support is observed around the 24,400 USD to 24,370 USD zone, where the price has bounced after a steep fall.
Key resistance levels are near 24,770 USD and 24,870 USD, where the price has struggled to break through multiple times.
An additional resistance zone is highlighted around 24,920 USD.

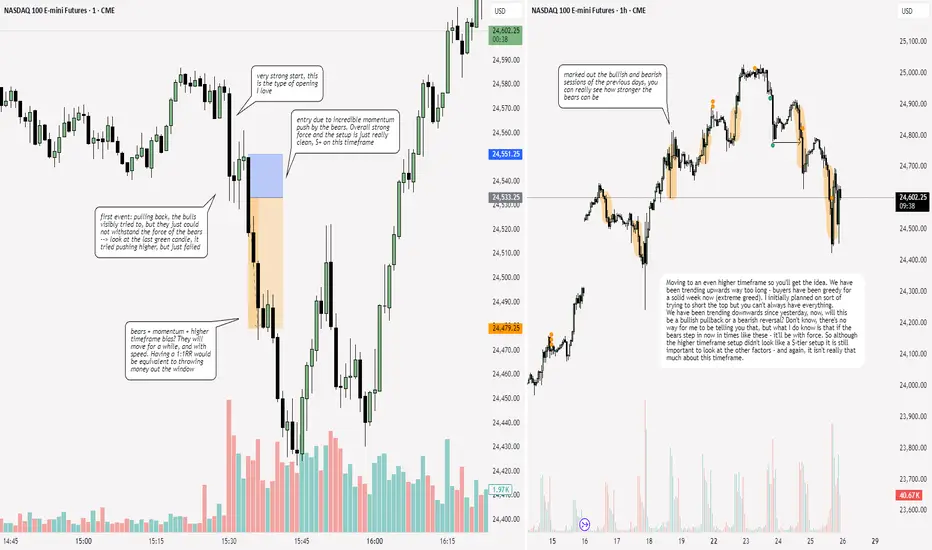
NQ: 260th trading session - recapPatience pays off - and again: I knew it was a great trade. I felt it, I always need to remind myself that if I'm not sure like today then it won't be a great trade. Easier said than done tho
Buy the Dip in all its GloryWait for the Bounce.
The GDP just came in. 2nd qtr. growth 3.8%. A fabulous number. The Fed keeps saying 1.8% is normal. To hell with normal! To hell with the Fed's model!
Trump's growth policies are working.
Why are the markets down?
Earnings are the Mother's Milk of growth. Earnings have been soaring.
Inflation concerns are rising.
Are we waiting for tomorrow's PCE inflation report?
This thing will bounce to new highs.
Bond rates creeped up this morning - bad for the markets. To hell with handwringers! Barring Armageddon, this market is going up.

NQ 9/25Lets see if this distribution finds support. we lost a 4hr trend so a daily levels (red) or 4hr (orange) will need to reverse it.

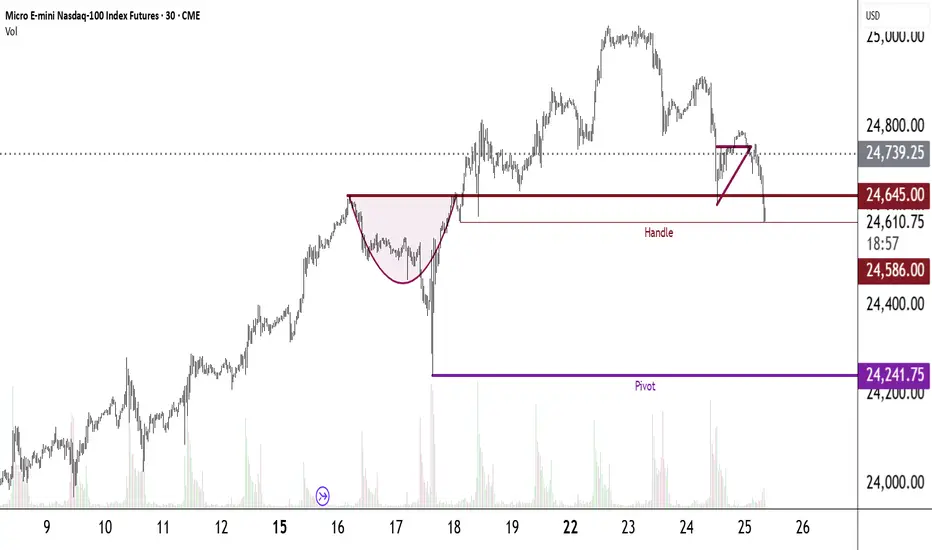
Inflation Data & SupportWe are at the low of the handle on this magnificent cup and handle pattern. The Big Question will it hold?
GDP estimate and other important news out Thursday, 9/25 08:30:00 NY time.
PCE out Friday, 9/26 08:30:00 NY time.
Both will be market movers. We will retrace to new highs. Are you ready to ride the waves?
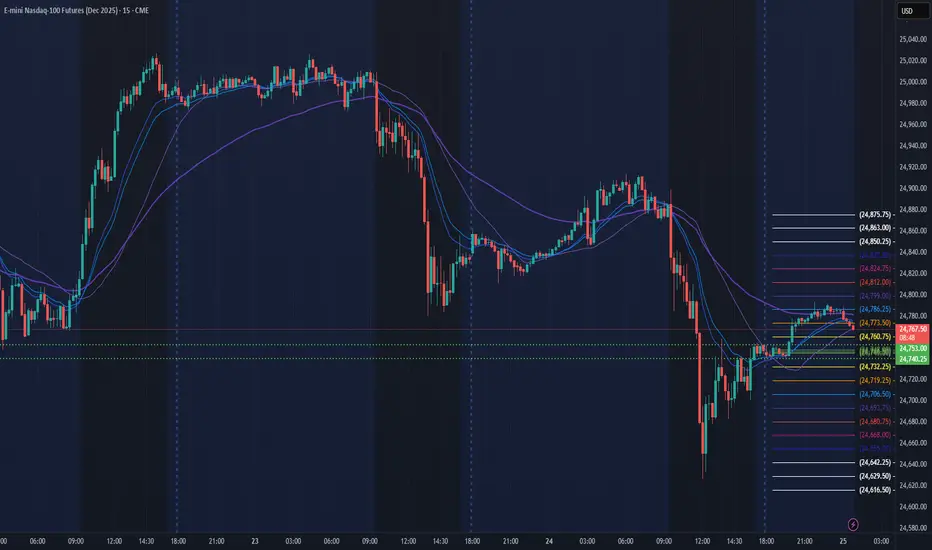
NQ Power Range Report with FIB Ext - 9/25/2025 SessionCME_MINI:NQZ2025
- PR High: 24753.00
- PR Low: 24740.00
- NZ Spread: 29.0
Key scheduled economic events:
08:30 | Initial Jobless Claims
- Durable Goods Orders
- GDP
10:00 | Existing Home Sales
Session Open Stats (As of 12:15 AM 9/25)
- Session Open ATR: 267.80
- Volume: 16K
- Open Int: 274K
- Trend Grade: Long
- From BA ATH: -0.9% (Rounded)
Key Levels (Rounded - Think of these as ranges)
- Long: 25204
- Mid: 23571
- Short: 21939
Keep in mind this is not speculation or a prediction. Only a report of the Power Range with Fib extensions for target hunting. Do your DD! You determine your risk tolerance. You are fully capable of making your own decisions.
BA: Back Adjusted
BuZ/BeZ: Bull Zone / Bear Zone
NZ: Neutral Zone
Precise Plan & ContextBeautiful chart. How to interpret it? How to trade it? How to manage risk?
One must have a precise plan, contextually interpret the charts and manage risk.
Precise Plan
1.Buy the Breakouts
2.Buy the Dips
3.Buy the Pivots
Buy the Breakouts
1.Wait for a bounce
2.Set a buy to open (bto) stop market order above the bounce
3.Enter a sell to close (stc) limit order
Buy the Dips
1.Wait for a bounce
2.Set a bto limit order less than the close of the bounce
3.When it fills set a stc limit order
Buy the Pivots
1.Find a strong Support
2.Set a bto limit order
3.When it fxs set a stc limit order
More Details
My Breakouts
1.I always stack them to the ceiling.
2.Most of the time I place a bto stop mkt order every 5 points.
3.For each entry I set a 19-point target.
NOTE: You must tailor this to your risk tolerance and to your account size.
NOTE: I do not place a stop loss. I manage risk by always keeping a close eye on Intraday Margin and Initial Margin. These are all-important. This cannot be over emphasized.
NOTE: Another way I manage risk is by not overlapping my trades. For example, if my margin requirements need some breathing room, I will not enter another trade until the prior trade has fxed its target.
My Buy the Dips
1.I usually wait for a bounce.
2.I buy them in descending 5-point intervals
3.19-point target for each trade
NOTE: Often, even a good bounce fails and the px goes lower. Always plan for this. Always.
NOTE: I always have accumulation/distribution areas clearly visible on my charts. This is where buyers and sellers have met in the past. Maybe they will meet here again.
NOTE: My goal is to have 5 a day. Here is the math with my broker: 5 trades x 5 days x 36.18 P x 50 weeks = $45,225.00. I am way ahead of that goal.
NOTE: Past performance is not indicative of future performance.
My Pivots
1.Look for a strong pivot.
2.I always aim to get a 101-point target.
Context is extremely important.
1.Learn how to interpret a chart. I assume most of you have learned the basics. If you haven't Jerremy Alexander Newsome has many great videos on YouTube. He also has much info on his website, reallifetrading.com. Investopedia is another great resource.
2.News is vital. News moves markets. Look at Liberation Day, 4/2/25. Look at June 13th, the day Israel bombed Iran. The jobs report comes out every first Friday of the month. Earnings reports matter. FOMC day, PCE, inflation data etc. etc. etc... I always look at MarketWatch's U.S. economic calendar. It's free and an invaluable resource. Find a reliable economic news source. I always have Fox Business on. They have great hosts and great guests. You will get a great economics education. Maria Bartiromo comes on at 06:00:00 NY time and she sets the day for any important events you should know.
3.We are in an historical bull market marking the early days of The Fourth Industrial Revolution - that of AI & Robotics.
I'm probably forgetting somethings right now. I will add them as I think of them. Here is one now - most of the time I am looking at a 5-minute chart. Here's another - I use Session Volume Profile charts daily. Each session (trading day) will have a point of control (poc). Buyers and sellers meet here. Sometimes a poc will not be touched by the next session's candles. It then becomes a virgin point of control (vpoc) and its significance becomes greater.
Until now, I have included many entries, many results and much math. I wanted you to get a feel for these things. They are the essence of trading. Perhaps going forward I won't post these, at least not so often.
I fear that I have been ham-handed in my posts - like a machine gun laying down rapid, unaimed firepower. I think this post best describes my trading plan and my thoughts on how important context is to trading. Context is far more comprehensive than just a chart, not to minimize the importance of charts. A chart, I suppose, could be pictured as a ship and context is the sea upon which that ship sails.
I hope this helps you have a Precise Trading Plan suitable to your singular needs, and that you see how vital and comprehensive Context is.
SELLBearish Order Block (Supply Zone):
Price rejected strongly from the supply zone marked between ~$24,770–$24,820.
Large wicks and volume spike indicate heavy selling pressure from this zone.
Break and Retest:
Price previously broke below a support level (~$24,780), then retested that zone before selling off again.
This confirms the zone has flipped from support → resistance.
Volume Confirmation:
High sell volume bars on rejection confirm institutional selling.
Follow-through candle closed below the support-retest level.
Market Structure:
Lower highs and lower lows forming, indicating short-term bearish trend continuation.

NQ: 259th trading session - recapSkipped school totally today and was able to pull off a BUNCH of work concerning my strategy and further future inquiries