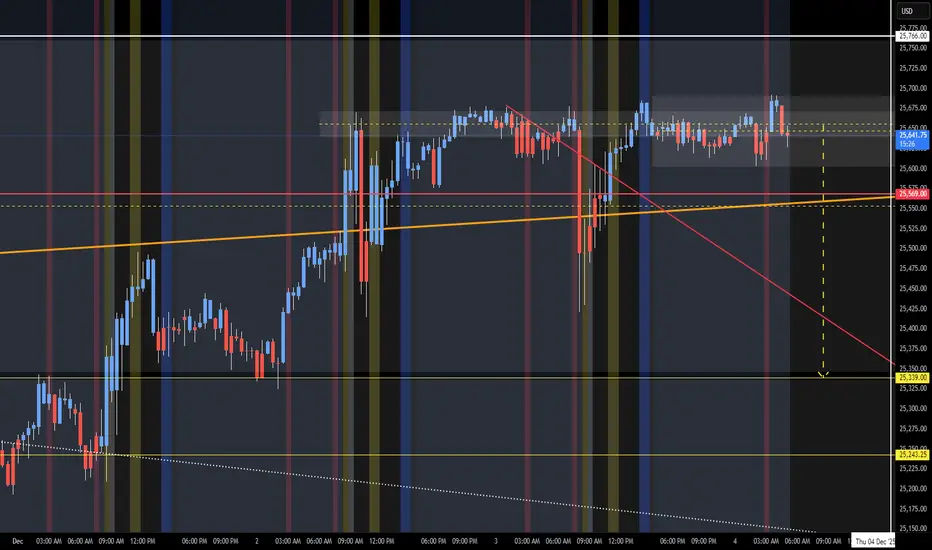
NQ Short (12-09-25)Basically same idea as Monday, not expecting much until Fed Decision. The O/N did use some failed auctions to pump the NAZ above nearside Danger Zone of 25,620-40 to upper resistance and KL 25,735, we are back under DZ at this time. Range today may be 630-730 for next move should the NAZ stay above 25,580, under play lower KL's.
Trade ideas

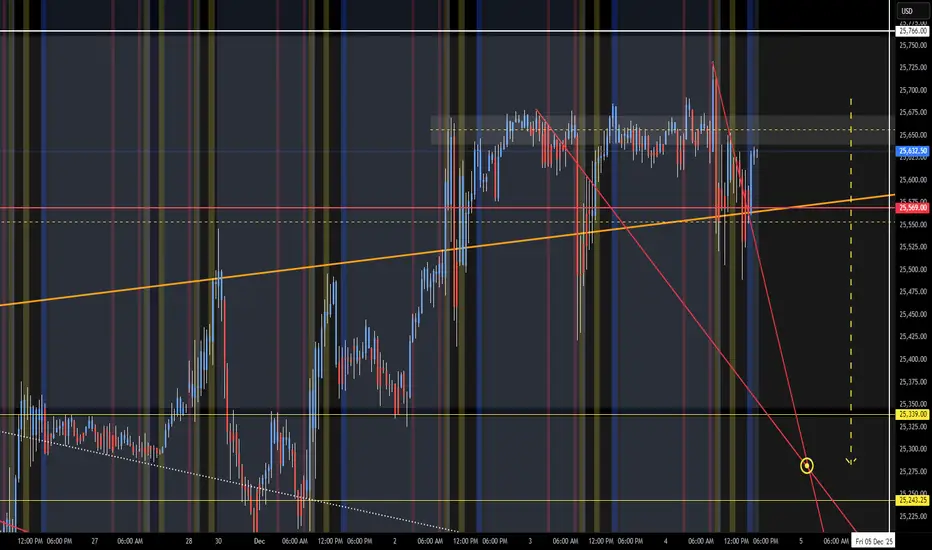
NQ Targets (12-05-25)Yellow arrow is lower target and 25,766 is upper Turn Zone. Past three days have been struggling to stay in range above orange TL below. O/N will have to pump it up and Reg Session will have to sell it off (big). Other option is snail life higher into Friday - Monday Long Play, just watch the head fakes long and failure of Dead Zone dip buying lift.
NQ Short (12-11-25)The yellow arrow is from my Monday Post, the Short Trade at KL 828 was a classic Edge Trade in the opposite direction at a Key Level. NAZ move back to mid level of the 1,000 point Churn Zone. Just felt that balance would show up and recent weak PA up was setting up a Long Trap. The Orange TL is what to watch and started back on 10/22. NAZ may rotate around, short under and long above. IDS27 view below


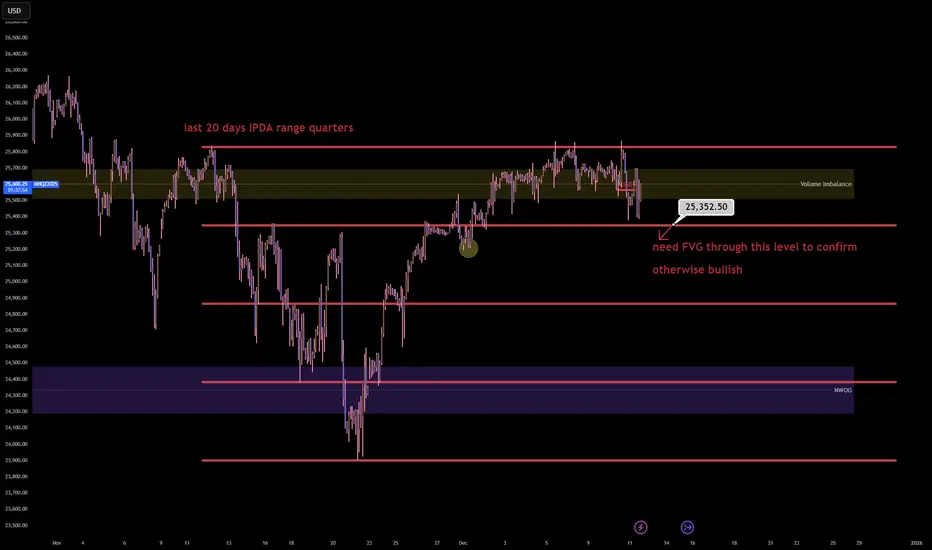
NQ1! (Nasdaq 100) has entered the terminal phaseThe Nasdaq 100 has entered the terminal phase of its 20 day institutional dealing range and is currently executing a distribution program within the premium quartile. The failure to sustain price acceptance above the 25,700.00 Volume Imbalance suggests the algorithm is preparing for a mean reversion event to rebalance the monthly ledger.
The present price action represents a classic 'Bull Trap' at the upper boundary of the range where retail momentum is being absorbed by institutional limit sell orders ahead of a repricing to equilibrium.
Entry: 25,550.00 (Sell Limit)
Stop loss: 25,880.00 (330.00 points)
Take profit: 24,850.00 (700.00 points)
Risk to reward ratio: 2.12R
CME_MINI:NQ1! CME_MINI:MNQ1! IG:NASDAQ
The Opportunity
The 20 day IPDA lookback reveals that price is oscillating within a defined premium distribution block between 25,350.00 and 25,850.00. The market has expended significant energy to reach this valuation but has failed to close the daily candles above the key Volume Imbalance at 25,700.00.
This rejection signature implies that the 'Santa Rally' narrative has been utilized to engineer exit liquidity for smart money positions accumulated at the lows. The algorithm is an efficiency engine and it cannot justify a new macro expansion leg without first revisiting the internal range equilibrium to capitalize the move.
The Entry
Initiating a short position in the 25,550.00 to 25,600.00 zone aligns with the institutional logic of selling the upper 25% of the monthly range. This zone offers the highest statistical edge as it places the entry directly against the 'Ceiling' of the current volatility profile while targeting the 'Floor' of the recent expansion.
The Volume Imbalance acts as a natural defensive barrier for the stop loss as the algorithm will typically respect this array during a distribution phase.
The Invalidation
The bearish causal chain is ontologically corrupted if price achieves a daily close above the 25,880.00 range high. Such an event would signify a 'Blue Sky' breakout and a shift in regime from range bound to trending.
If the market accepts price above this threshold it implies that the premium valuation has become the new floor and the algorithm is targeting the 26,000.00 psychological level.
Key Trajectory Waypoints
Target 1: 25,350.00 | Type: 75% Range Quartile | Probability: 70% | ETA: 24 Hours
Target 2: 24,850.00 | Type: Range Equilibrium (50%) | Probability: 60% | ETA: 2-3 Days
Target 3: 24,400.00 | Type: NWOG / Discount Target | Probability: 40% | ETA: Next Week
The Shadow Reality
A 35% probability exists for the antithetical reality: The Range Expansion.
In this scenario the current consolidation is a 'High Tight Flag' and the algorithm ignores the equilibrium requirement to force a squeeze into the 26,000.00 level immediately.
This reality is confirmed if price holds above 25,650.00 for two consecutive 4 hour closes.

NQ Short (12-08-25)NAZ is barley alive and showing signs of slowing to the upside, while kicking out some very quick 100-200 drop test bombs. NDX may need to gap fill at 25,898 and we could see an M with decent drop test (Fed Day would work). On NQ it is looking like Turn Zone at 26k or so. After the drop test and final 2 weeks of the year, we may look Long with low volume PA & Mr. Retail and his BTD strategy. This may set up a better Short in 2026.
NDX YRD

NQ UpdateORCL earnings caused a drop AH, NQ has been going sideways for a week and a half now, lol.
Can't make any money when it's going sideways, find something else...

NQ Short (12-04-25)Nothing new, still liking the Short. Seems like market is waiting on Stimulus, QE or something because price action is aimless. Only appears to lift in O/N, Dead Zone or any lower volume trading period. Open Drive selloff of no return, or not.
NQ levels BearishTake a look at my charts and levels I call things ahead of things and see action before it happens

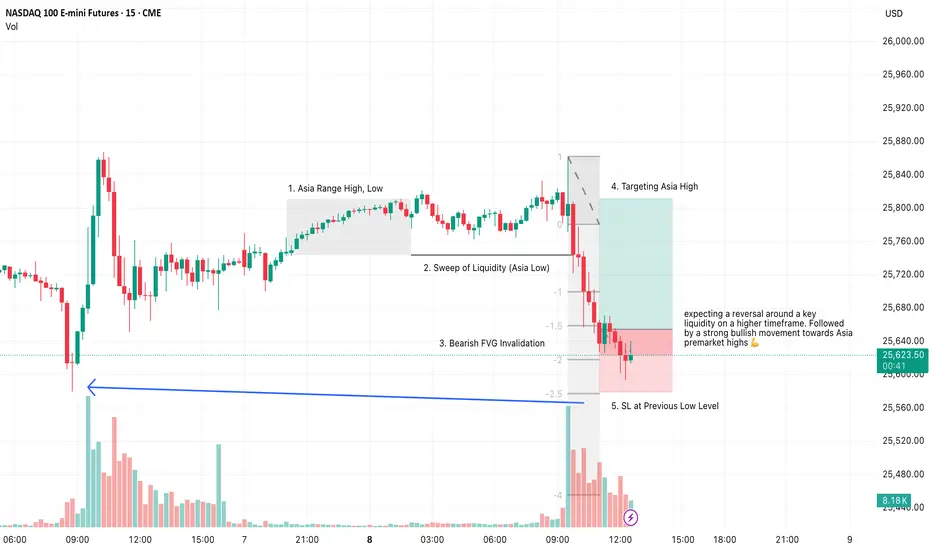
Alt Trading: Asia Fib Strategy Long, NQ1, December 8th 2025With this long I want to systematically exploit the overnight Asia range instead of just marking it and guessing. I waited for a liquidity sweep of the Asia low, followed by price entering the standard deviation fib -2 to -2.5 range. Then a long confirmation on the invalidation of a bearish iFVG. Setting my risk SL and TP to respect higher timeframe key liquidity levels 💪
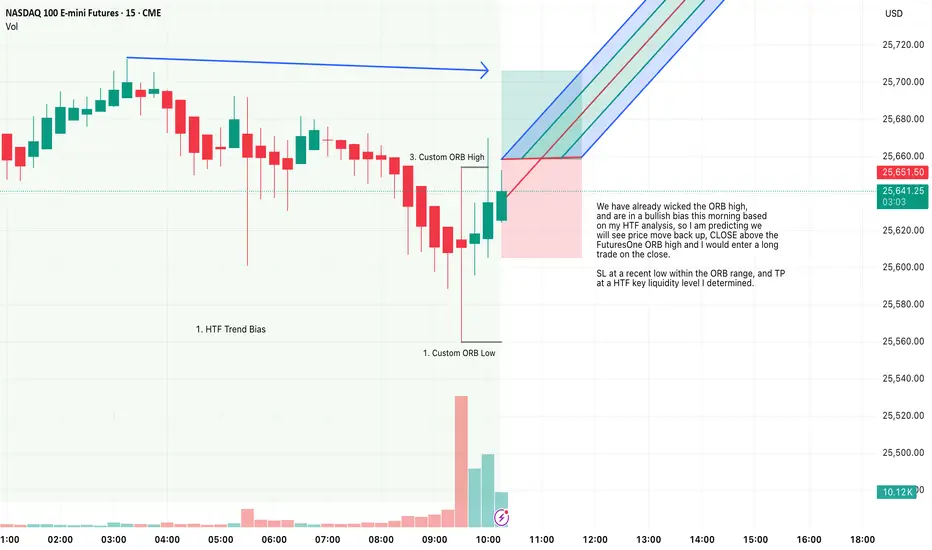
FuturesOne ORB, Long, NQ1, HTF Bias EntryFor this Idea, I am looking at a Long on NQ1.
Price has already wicked the ORB high,
and are in a bullish bias this morning based
on my HTF analysis, so I am predicting we
will see price move back up, CLOSE above the
FuturesOne ORB high and I would enter a long
trade on the close.
SL at a recent low within the ORB range, and TP
at a HTF key liquidity level I determined.
Release the kraken thenopen the tartarus may I say, lets find Krampus ;)
sell short every base. and have fun with the rebounds.
Carry on, this party for eternity!

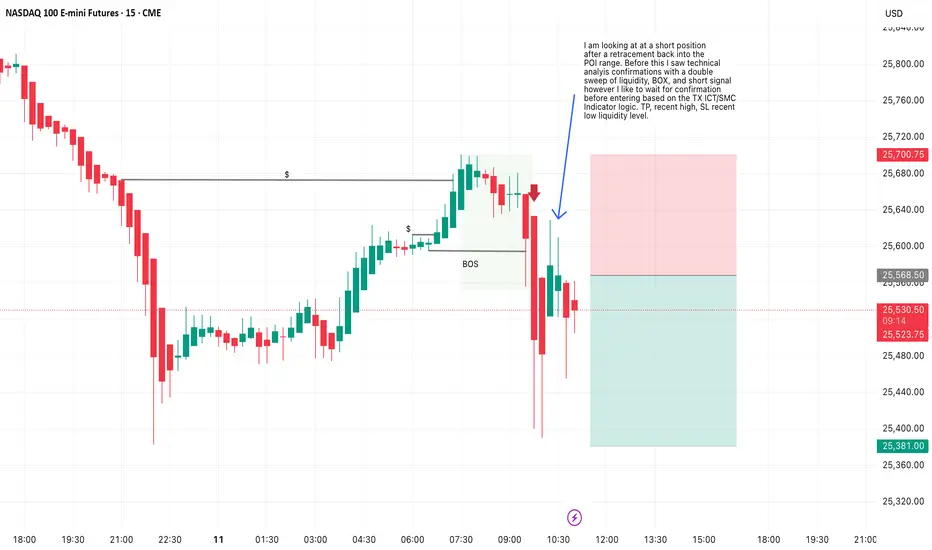
TX ICT/SMC Based NQ1 Short, Liquidity level based SL,TPI am looking at at a short position after a retracement back into the POI range. Before this I saw technical analysis confirmations with a double sweep of liquidity, BOX, and short signal however I like to wait for confirmation before entering based on the TX ICT/SMC Indicator logic. TP, recent high, SL recent low liquidity level.
Scalping the 1 minute using HTF OHLC strategy: Prop Firm StratSimple Scalping, Trading Take Profit Testing account. Using my Best Trade Set up Strategy on the 15-minute candles.

NQ UpdateMFI hit oversold yesterday but FDAX is overbought so watch out. NQ may double or triple bounce into oversold territory.
One thing I know is taht I'm not carrying any long position over the weekend. If FDAX drops Monday, we'll see futures go red.

Looking at three of Bobby's marketsNovember 8th we looked at three of Bobby's markets plus Tesla. Bobby's markets are the smaller contracts which are the way you want to trade until you're comfortable with a larger contracts< I didn't state this but if you're inclined to trade more than one contract it may be much more prudent to trade the smaller contracts anyway as long as they have enough volatility. I have a real neat idea and I don't want to talk about it but I'm looking into something that I do not normally do but I'm going to make a decision I'm going to include a strategy for the equity markets..... Tesla would be an example of what I would be looking at and trade if I find certain setups. I haven't traded equity markets for well over 2 decades.... But it is something I might consider and if I do make that decision I will be very clear on the reasons... The tools I use the decisions I make are absolutely representative of what I'm doing. I don't need your money, I don't want your money.... I will show you what I'm doing and what I'm thinking and I will never tell you to take a trade because I don't want your lawsuit. So stay tuned.

NQ UpdateNQ MFI hit oversold on the afternoon drop, chart doesn't show it because it only shows where it closed on the 3 hr.
Wasn't quite sure about gap direction tomorrow, so I didn't enter into a trade on this one yet. Gap direction will depend on inflation numbers, but I expect tech to rally for at least a couple of days just like small caps (RTY) did.

NASDAQ 100 (NQ1!): Bullish! Look For Valid Buys Only!Welcome back to the Weekly Forex Forecast for the week of Dec. 8 - 15th.
In this video, we will analyze the following FX market: NASDAQ (NQ1!) NAS100
The NASDAQ is showing bullish order flow, and it has been strong over the past couple of weeks.
Trading above 25,600 is making looking for shorts a no no.
A weakened US Dollar supports the idea of higher prices.
Wait for valid buy setups.
Enjoy!
May profits be upon you.
Leave any questions or comments in the comment section.
I appreciate any feedback from my viewers!
Like and/or subscribe if you want more accurate analysis.
Thank you so much!
Disclaimer:
I do not provide personal investment advice and I am not a qualified licensed investment advisor.
All information found here, including any ideas, opinions, views, predictions, forecasts, commentaries, suggestions, expressed or implied herein, are for informational, entertainment or educational purposes only and should not be construed as personal investment advice. While the information provided is believed to be accurate, it may include errors or inaccuracies.
I will not and cannot be held liable for any actions you take as a result of anything you read here.
Conduct your own due diligence, or consult a licensed financial advisor or broker before making any and all investment decisions. Any investments, trades, speculations, or decisions made on the basis of any information found on this channel, expressed or implied herein, are committed at your own risk, financial or otherwise.

IS THE NASDAQ 100 ABOUT TO FORM A HEAD AND SHOULDERS TOP?Hey Traders Happy Holidays to all!
So as we enter this volatile time period what better way would it be for stocks to close out the year with a bang and break the all time high when Santa Claus comes to town!
Hmmmm..... acutally I don't mean to be the Grinch that stole Christmas but lets not got too excited just yet the market has rallied strong since the volatile bottom in April and it is looking very heavy right now.
So I always say the charts tell a story and from what I see on the chart is a possible Head & Shoulders formation in the Nasdaq 100.
I think the line in the sand is going to be 24,145 if that breaks we could see it fall hard. The way should trade the Head & Shoulders is wait for market to close below the neckline then go short with a stop above the right shoulder or the head.
I think next week FED meeting Wed Dec 10 will tell us more truth be told alot of traders take the holidays off so expect very thin trading and low volume as we get closer to end of year. Sometimes its a good idea to take time off from trading too clear our heads and minds to prepare for new year.
So therefore here are todays Scenarios...
Bullish- wait for market to break the all time high and close above 26,410 then buy a pullback and be careful because Jan is seasonally bearish time for stocks until March/April. Or wait for market to fall and buy back in March/April when you see signs of bottom formation.
Bearish- For all you bears out there keep sharpening your claws. 😁 Ok seriously being bearish or shorting the stock market is a bad thing to do long term because the odds are always against us due to strong bull market runs. However there are 2 times a year when the odds go in our favor and that is Jan-March and Sep-Oct. So with the charts now showing a possible Head & Shoulders top about to form this could be one of those times to go short on a break below the neckline.
Commitment of Traders- none until end of Jan due to Govt Shutdown but last report showed Nasdaq with extreme long positioning which could be good sign also for over extended longs about to close positions if selloff begins.
Good Luck & Always use Risk Management!
(Just in we are wrong in our analysis most experts recommend never to risk more than 2% of your account equity on any given trade.)
Hope This Helps Your Trading 😃
Clifford
RISK DISCLOSURE
TRADING IN THE FUTURES AND FOREX MARKET INVOLVES SIGNIFICANT RISK. ALWAYS CONSULT A FINANCIAL ADVISOR AS HIGH RISK ASSET CLASSES MAY NOT BE SUITABLE FOR ALL INVESTORS. THIS IS NOT A RECOMMENDATION TO BUY OR SELL ANY ASSETS. ALL IDEAS ARE MADE FOR EDUCATIONAL PURPOSES. PAST PERFORMANCE DOES NOT GUARANTEE FUTURE RESULTS.
CFTC RULE 4.41 – HYPOTHETICAL OR SIMULATED PERFORMANCE RESULTS HAVE CERTAIN LIMITATIONS. UNLIKE AN ACTUAL PERFORMANCE RECORD, SIMULATED RESULTS DO NOT REPRESENT ACTUAL TRADING.

Long NQThis should be a good trade, BUT, BIG BUT in here, iam confused since the chart shows bullish and bearish bias both at the same time.
So dont go big as those mixed siganls are wild.
Good luck everyone.

Algo's Logic: Why price moves ''crazy'' with red folder news?WHY PRICE MOVES LIKE THIS
The market is not a chaotic auction of buyers and sellers seeking fair value; it is a highly engineered delivery system designed to seek and destroy liquidity. The current consolidation you see is not indecision; it is a 'Liquidity Coil'. The algorithm is purposefully compressing price action ahead of the 'Red Folder' events to engineer a 'Straddle Inducement'.
By keeping the range tight, the Interbank Price Delivery Algorithm (IPDA) encourages retail traders to place tight buy-stops above the range and tight sell-stops below it. This creates two massive pools of liquidity—fuel for the machine. The news event is not the cause of the move; it is the 'Key' that unlocks this volatility. The initial move is almost always a 'Judas Swing'—a fraudulent manipulation designed to trigger one side of these stops (usually the sell-stops below) to harvest the necessary liquidity to fuel the *real* move in the opposite direction. We do not trade the news; we trade the algorithmic reaction to the liquidity harvest.
THE THESIS
The algorithm is currently in a 'Suspended State' of pre-event accumulation utilizing the impending volatility of the Macro Data Injection to engineer a classic 'Judas Swing' manipulation. The narrative is strictly governed by the 'Seek and Destroy' protocol: The market will utilize the news release to aggressively harvest the internal Sell-Side Liquidity (SSL) resting below the 25,550.00 shelf to fuel the terminal expansion towards the external Buy-Side Liquidity (BSL) at 25,900.00.
THE EXECUTION VECTOR
Entry: 25,525.00 (Buy Limit / Post-News Reclaim)
Stop loss: 25,380.00 (145.00 points)
Take profit: 25,950.00 (425.00 points)
Risk to reward ratio: 2.93R
THE CAUSAL RATIONALE
The Pre-News Narrative (The Trap)
Current price action (25,650.00) is a 'Volatility Compression' zone. The algorithm is holding price in a narrow range. Do not trade the drift. The drift is the bait. The algorithm is waiting for the 08:30 AM / 10:00 AM timestamp to unlock the high-velocity engine. The 'Red Folders' are simply the authorized time windows for the Market Makers to reprice the asset.
The News Event (The Judas Swing)
Upon the data release, expect an immediate, violent displacement. The highest probability vector is a 'False Bearish Breakout' (The Judas Goat). The algorithm will likely spike price DOWN into the 25,550.00 - 25,500.00 region. This serves two purposes:
1. Trigger the sell-stops of the overnight longs.
2. Induce breakout sellers to provide the necessary Buy-Side liquidity for the Smart Money to fill their long orders at a discount.
The Post-News Expansion (The Real Move)
Once the SSL is harvested and the 25,500.00 region (Bullish Order Block / FVG) is mitigated, look for an impulsive reclaim of the 25,600.00 level. This 'Sponsorship' signal confirms that the low is in, and the algorithm will switch to a 'Low Resistance Liquidity Run' targeting the clean highs at 25,900.00.
THE INVALIDATION (THE OMEGA POINT)
The bullish news model is ontologically corrupted if the news candle displaces below 25,380.00 and *sustains* acceptance there (15-minute close). A simple wick is not invalidation; it is a feature. But a closure below this level implies the macro data has triggered a 'Risk-Off' regime shift, targeting deeper discount arrays at 25,000.00.
KEY TRAJECTORY WAYPOINTS
Target 1: 25,750.00 | Type: Equilibrium / Initial Rebound | Probability: 90%
Target 2: 25,900.00 | Type: External Buy-Side Liquidity | Probability: 75%
Target 3: 26,100.00 | Type: Blue Sky Expansion | Probability: 40%
THE SHADOW REALITY
A 30% probability exists for the 'Bull Trap' scenario. In this reality, the news spikes price UP first into 25,850.00. If the first move is UP, fade it. The algorithm rarely gives the true move first during high-impact news.
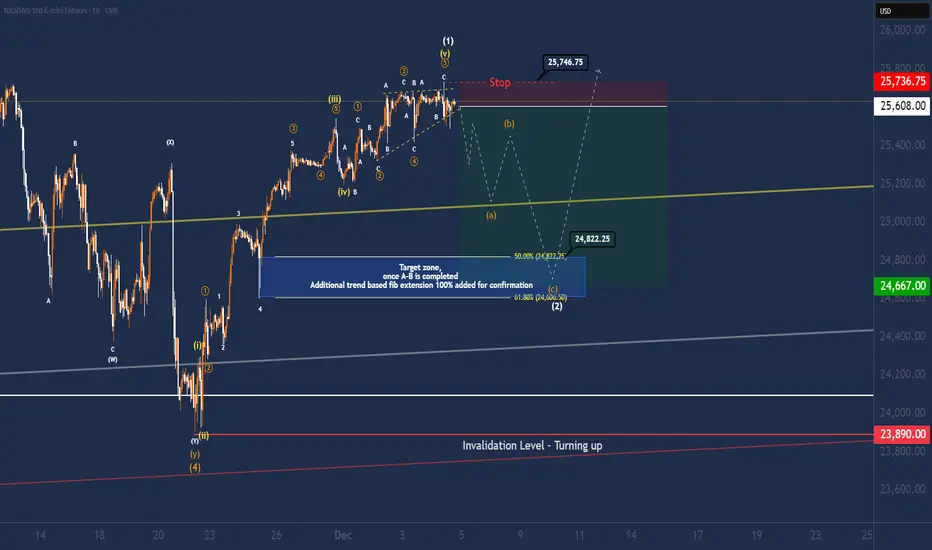
Elliot wave suggests correction on NQ for wave (2) -> [5]Instrument: NASDAQ 100 E-mini Futures (NQ)
Bias : Short-term corrective downside after a completed impulse, then continuation higher.
1. Bigger picture – why I expect a correction
From the low around 23,890 we’ve put in a very clean 5-wave impulsive advance:
* Wave (i)–(ii) starts the move off the low.
* Wave (iii) is clearly the strongest and longest leg – classic extended 3rd wave behaviour.
* Wave (iv) is a shallow sideways consolidation.
* The current high is labelled (1), with the last leg subdividing as an ending diagonal in wave (v): overlapping structure, contracting highs, and loss of momentum.
That wedge-type structure at the top usually signals trend exhaustion , not the start of fresh impulsive upside. So my base case is that the first motive wave up from 23,890 is complete and we’re now looking for a textbook wave (2) pullback. We also can back this data up with volume nodes we can observe during the NY Cash sessions. Who are clearly showing signs of distribution.
Wave (2) corrections most often retrace 50–61.8% of wave (1) in a 3-wave A-B-C structure – exactly what the chart is projecting.
2. Expected path – the A-B-C into the blue box
From the current highs around 25,600–25,700 I’m looking for:
1. Wave (a) down
First impulsive leg lower, ideally breaking out of the wedge and pushing into the rising yellow trendline zone around ±25,200.
2. Wave (b) retrace up
Corrective bounce that stays below the stop zone and forms a lower high.
3. Wave (c) down into the blue box
Final flush into the confluence zone marked in blue, where:
50% retrace of wave (1) sits around 24,800.
61.8% retrace sits around 24,600
There’s also a previous structural support / prior wave-4 area.
Labelled as the end of wave (2) on the chart.
This blue rectangle is my primary target area for the current correction and also my preferred zone to look for fresh longs if the structure behaves as expected.
4. Trade idea #1 – Aggressive short from the wedge
This is the “ catch the correction ” play for traders comfortable trading against the higher-timeframe trend.
Idea: Short against the completed wedge / wave (1) high, targeting the A-B-C correction into the blue zone.
Entry zone:
Around current prices in the 25,580–25,600 area (wedge top / prior minor highs).
Stop-loss (hard invalidation for the short):
Above the red “Stop” band and the labelled high at 25,746.75
If price breaks and holds above this level, the idea of a completed wave (1) and immediate correction is likely wrong – stand aside.
Profit targets:
TP1 – first leg / (A) completion:
Around the rising yellow trendline near 25,150–25,250
Take some off here if you want to pay yourself on the initial impulse.
TP2 – upper edge of blue box (50% fib): 24,822.25
TP3 – lower edge of blue box (61.8% fib & (c) completion): 24,600–24,650 are
For reference, using an approximate entry at 25,600:
Risk: 25,740. – 25,600 ≈ 138.75 pts
Reward to TP2: 25,600 – 24,800 ≈ 780 pts (~5.7R)
Reward to TP3: 25,600 – 24,660 ≈ 940 pts (~6.8R)
So the idea offers an attractive reward:risk , as long as you accept the possibility that the correction may be shallower or more complex than the “ideal” projection.
What I want to see step-by-step if I’m in this short:
1. A convincing break down out of the wedge.
2. Follow-through selling to the yellow trendline (wave (a)).
3. A choppy overlapping bounce that stalls under the stop zone (wave (b)).
4. One more push down with increasing momentum into the blue box (wave (c)) – where I’ll look to exit shorts and flip bias.
5. Trade idea #2 – Conservative swing long from the blue bo x
If you don’t like shorting a strong trend, the more conservative plan is to ignore the short and only look for longs once the correction has played out.
Idea :
Buy the end of wave (2) in the blue box for a continuation higher in wave (3).
So we are trying to buy the dip in a strong trend.
Buy zone (long trigger area ):
Blue box between roughly 24,800–24,600.
Ideally after we’ve seen a full A-B-C structure into this zone and some kind of reaction. (rejection wicks, bullish divergence, lower-timeframe 5-wave impulse off the lows, etc.).It could also be a more complex correction like WXY, However most of the time we expect a wave 2 more str8 forward price action.
Stop-loss for the long:
Conservative, structure-based invalidation remains the red line at 23,890
A break below this low would invalidate the wave (1)–(2) interpretation and suggest something more bearish is underway.
Tactically, some traders may opt for a tighter stop just below the blue box (e.g. under 24,550), but that’s a money-management choice, not a structural one.
Upside objectives:
First objective is a retest and break of the 25,746 high .
From there, if this is indeed the start of wave (3), extensions towards **26,000+** become realistic (1.0–1.618 extensions of wave (1), not drawn in detail here but implied by the dashed grey path).
6. Invalidation and what would change my mind
Short-term bearish idea is invalid :
if price closes decisively above 25,75x without first breaking down. That would suggest that wave (1) is still extending, or that we’re in a different pattern (e.g. a larger ending diagonal or a complex topping structure). In that case I step aside and reassess.
Medium-term bullish roadmap is invalid if price trades below 23,890 . Then the whole impulse from the low is likely mis-labelled and I would expect a deeper bearish structure. However this
7. Final notes
This is an Elliott Wave–driven roadmap, not a guarantee. I’m planning to:
Treat the current region as exhaustion of wave (1).
Use it either for an aggressive short into the A-B-C correction,
Or wait patiently for the blue box to develop for a more conservative long into a potential wave (3).
As always: manage your risk, size appropriately, and don’t trade this blindly. This is a trade idea and educational analysis, not financial advice.
Since lack of time I was not able to post many trade ideas in the past months. However I'm going to try to get back some more ideas in the future! Please leave feedback and comments!