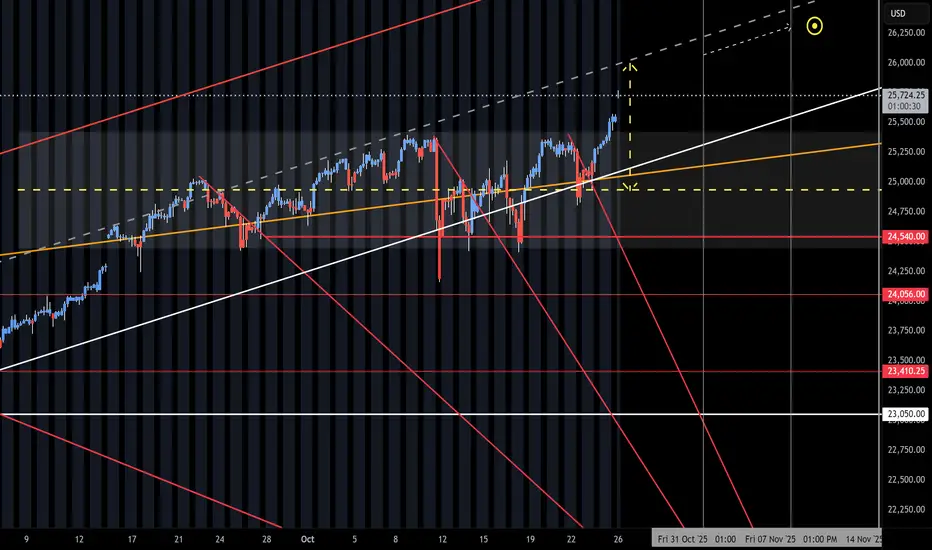
NQ Short (10-27-25, Week 5)NAZ with O/N Gap open to lock in the Long chase and clean out the short stops. Regarding Friday short, I always go flat into the close. The O/N continues be used to lift it with ease. This may be blow off top day into balance of Friday - Monday Long Play. Netflix had the -10% move and has not recovered, NAZ is using the off session to Rig it up. Drop may not be until Tuesday, yellow arrow is range for retest should upper stall out. Current gap fill likely either way. Pump/Dump into Open, Gap up in O/N and expect some Tweets. When this stalls, look short. AP on Friday, voided by Gap.
Trade ideas
NQ UpdateWaaaay overbought and they're still trying to pump NQ. I think Powell tanks the market tomorrow. If not Trump will Friday.
If there was ever a time to try to short QQQ or SPY, this is probably it, but options premiums are high so the return won't be very good. If you get next Friday's puts, you're gonna basically get 100% return if the gap fills.

Bullish Bias on NQ for TodayBias: Bullish
Draw on Liquidity: All-Time High
Until 1H BISI/FVG made on Yesterday is not violated, We are Bullish on NQ.

NQ GOES TECH PARTY LIKE IT'S 1999, AHEAD OF ITS FINAL CRASHI was dreamin' when I wrote this
So sue me if I go too fast
But life is just a party
And parties weren't meant to last
...
I got a lion in my pocket
And, baby, he's ready to roar, yeah, yeah
Everybody's got a bomb
We could all die any day, oh
But before I'll let that happen
I'll dance my life away
Oh
Yeah
--
Best wishes,
@PandorraResearch Team

Is Nasdaq Set for a Pullback? | Fibonacci Resistance Zone ahead!In this video I map out the idea of the Nasdaq being over extended and on route to approaching a key Fibonacci resistance level 27000 ,
This may set up a potential correction in the week ahead."
This is a counter-trend setup within a larger uptrend, so risk management is key. I'm not calling a top to the entire rally, but rather a healthy pullback to bring in new buyers."
I demonstrate how i see the price action moving forward over the course of the month ahead with valuable insights.
Tools used in this video Standard Fib , Fib Expansion, Fib extension + Anchored vwap and Volume profile and TPO chart

Lessons Learned from Past Meltdowns (2008, 2020, etc.)1. The 2008 Financial Crisis: A Wake-Up Call for Systemic Risk
The 2008 Global Financial Crisis (GFC) was triggered by the collapse of the U.S. housing bubble, excessive leverage in financial institutions, and the widespread use of complex derivatives such as mortgage-backed securities (MBS) and collateralized debt obligations (CDOs). When Lehman Brothers filed for bankruptcy in September 2008, panic spread globally. The crisis led to trillions in lost wealth, millions of job losses, and the deepest recession since the Great Depression.
Key Lessons from 2008:
a. Importance of Transparency and Regulation:
The 2008 crisis revealed how opaque financial products and inadequate oversight can destabilize the entire financial ecosystem. Banks took excessive risks without sufficient capital buffers, while rating agencies failed to assess true risk levels. Post-crisis reforms, such as Basel III norms, Dodd-Frank Act, and stress testing frameworks, were introduced to improve capital adequacy, liquidity, and accountability.
b. Systemic Risk Can Spread Rapidly:
The interconnection of global banks turned what began as a housing market issue into a worldwide meltdown. The concept of “too big to fail” became central to financial discourse. The lesson: monitoring systemic risk is as important as regulating individual institutions. Financial contagion can cross borders instantly, necessitating global cooperation among central banks and regulators.
c. Moral Hazard and Bailouts:
Massive government bailouts (e.g., TARP in the U.S.) saved the system but raised questions about moral hazard—whether saving reckless institutions encourages future risk-taking. The lesson was clear: regulation should prevent risk-taking before it requires taxpayer-funded rescues.
d. The Role of Monetary Policy:
Central banks realized their power and limitations. The U.S. Federal Reserve’s near-zero interest rate policy and quantitative easing (QE) became critical tools to stabilize markets. However, these also laid the groundwork for future inflationary pressures and asset bubbles. Lesson: monetary easing is effective but must be balanced with fiscal prudence and structural reforms.
e. Behavioral Economics Matters:
Investor psychology—greed during booms and fear during crashes—played a decisive role. Overconfidence, herd behavior, and the illusion of endless housing price appreciation fueled the bubble. Behavioral finance emerged as a crucial field for understanding and mitigating irrational market behavior.
2. The 2020 Pandemic Crash: A Crisis Like No Other
Unlike 2008, which was a financial crisis rooted in excess and mismanagement, the 2020 crash was a health crisis turned economic catastrophe. When COVID-19 spread globally in early 2020, lockdowns halted production, trade, and travel, triggering a sudden and sharp global recession. Stock markets collapsed, oil prices turned negative, and unemployment soared. Yet, recovery was surprisingly swift—thanks to unprecedented fiscal and monetary interventions.
Key Lessons from 2020:
a. Speed and Scale of Policy Response Matter:
Governments and central banks acted far faster in 2020 than in 2008. The U.S. Federal Reserve slashed rates to zero within weeks and launched unlimited QE, while fiscal packages like the CARES Act pumped trillions into the economy. Similarly, India announced the Atmanirbhar Bharat stimulus. The lesson: speed and magnitude of support can prevent temporary shocks from becoming long-term depressions.
b. Technology as an Economic Lifeline:
The digital economy emerged as a savior. Remote work, e-commerce, fintech, and cloud computing allowed many sectors to survive and even thrive. The pandemic accelerated the digital transformation of business and finance, leading to greater adoption of digital payments, virtual collaboration, and online education. Lesson: digital infrastructure is not optional—it is a core pillar of economic resilience.
c. The Fragility of Global Supply Chains:
The shutdown of manufacturing hubs in China and other countries exposed how deeply global supply chains were interconnected and vulnerable. The shortage of semiconductors, medical supplies, and essential goods highlighted the risk of over-dependence on a few suppliers. Lesson: economies must build supply chain diversification and strategic self-reliance.
d. Inequality and Social Resilience:
The pandemic widened existing inequalities. While asset prices recovered quickly, millions of small businesses and low-income workers faced lasting damage. Lesson: inclusive recovery must be prioritized; safety nets and targeted fiscal support are crucial for societal stability.
e. Investor Behavior and Market Resilience:
The 2020 crash also showcased how investor psychology had evolved. Retail investors, aided by trading apps and social media, became a dominant force. Markets rebounded sharply, partly due to liquidity and optimism about vaccines and technology. Lesson: information flow, sentiment, and social media can now move markets faster than ever.
3. Common Threads Between 2008 and 2020
Though different in origin, both crises shared key characteristics that reveal the vulnerabilities of modern capitalism.
a. Interconnected Global Systems:
Both crises demonstrated how local shocks quickly became global due to financial, trade, and psychological linkages. Whether it was mortgage-backed securities in 2008 or supply chain disruptions in 2020, the globalized economy magnifies contagion. The lesson: resilience depends on diversification—not isolation.
b. Central Bank Dominance:
In both crises, central banks played an unprecedented role. The Federal Reserve, European Central Bank, and others became the “market backstop.” Their actions stabilized confidence but also increased dependence on monetary intervention. This dependence raises long-term concerns about asset bubbles and debt sustainability.
c. The Importance of Communication and Trust:
Both meltdowns showed that trust is the ultimate currency in a crisis. When financial institutions, governments, or investors lose confidence, panic sets in faster than any policy can react. Transparent communication by policymakers can anchor expectations and prevent spirals of fear.
d. Innovation Follows Crisis:
Both periods triggered innovation. After 2008, fintech and blockchain rose from the ashes of mistrust in traditional banks. After 2020, remote work tech, digital health, and AI-driven analytics became mainstream. History proves: crises often accelerate technological and structural evolution.
4. Lessons for Policymakers
a. Build Buffer Capital and Fiscal Space:
Governments and banks must maintain sufficient reserves for emergencies. High fiscal deficits and excessive leverage before a crisis reduce the ability to respond later. Prudent fiscal management and healthy capital ratios are essential for resilience.
b. Develop Counter-Cyclical Tools:
Automatic stabilizers—such as unemployment benefits and targeted stimulus—can cushion economic shocks. Regulators must enforce counter-cyclical lending and investment practices to prevent overheating during booms.
c. Strengthen Global Coordination:
Global problems require global responses. The 2008 and 2020 crises both highlighted how coordination among G20 nations, IMF, and World Bank was vital. Shared frameworks for debt relief, liquidity swaps, and vaccine distribution illustrate the power of cooperation.
d. Invest in Data and Predictive Systems:
Early warning systems using AI and real-time data could help detect vulnerabilities before they escalate. Governments and financial regulators must embrace data-driven policy frameworks for crisis prevention.
5. Lessons for Financial Institutions
a. Risk Management Must Be Dynamic:
Traditional models failed to predict both crises. Stress testing must account for low-probability, high-impact events like pandemics or geopolitical disruptions. Banks must integrate climate risk, cyber risk, and behavioral risk into their frameworks.
b. Liquidity Is King:
Both meltdowns reinforced that liquidity dries up first in a panic. Institutions must maintain adequate short-term funding buffers. Central banks’ liquidity facilities are a lifeline, but dependence should be reduced through prudent planning.
c. ESG and Sustainable Finance:
The 2020 crisis emphasized environmental and social resilience. Firms with strong ESG principles fared better, reflecting investor preference for sustainability. Lesson: ethics and responsibility are now financial imperatives, not optional ideals.
6. Lessons for Investors
a. Stay Rational Amid Panic:
The biggest losses occur when investors react emotionally. Those who stayed invested or bought during the 2020 crash witnessed record recoveries. Lesson: time in the market often beats timing the market.
b. Diversification Works:
Diversified portfolios—across asset classes, sectors, and geographies—performed better in both crises. Lesson: never rely solely on one market or theme.
c. Long-Term Vision Pays Off:
Both crises produced winners—innovative companies that adapted early. Investors who focused on fundamentals and long-term growth stories reaped massive returns. Lesson: focus on quality, adaptability, and innovation.
7. Structural Shifts Triggered by Crises
a. Rise of Alternative Finance:
Post-2008, distrust in banks led to the growth of fintech, crypto assets, and decentralized finance (DeFi). These innovations democratized finance but also created new regulatory challenges.
b. Work and Consumption Redefined:
After 2020, remote work, digital payments, and online services became embedded in everyday life. Businesses now prioritize resilience over efficiency—shifting from “just-in-time” to “just-in-case” models.
c. Inflation and Monetary Reckoning:
Massive stimulus in 2020 eventually fueled inflationary pressures by 2022–23. This underscored that liquidity without productivity creates long-term imbalances. Lesson: monetary expansion must be matched with real economic output.
8. Preparing for the Next Crisis
While we can’t predict the next meltdown, we can prepare for it. Future shocks might stem from climate change, AI-driven job disruptions, or cyber warfare. The lessons from 2008 and 2020 teach us that flexibility, coordination, and foresight are the best defenses.
Anticipate the Unthinkable: Stress testing and scenario modeling must include black swan events.
Prioritize Human Capital: Education, healthcare, and social safety nets ensure societies rebound faster.
Embrace Sustainable Growth: Over-leverage and short-term gains always backfire.
Enhance Financial Literacy: Empowering individuals to understand risk and debt reduces systemic vulnerability.
Conclusion
The crises of 2008 and 2020 were vastly different in origin—one financial, the other biological—but they shared a common truth: economic systems are only as strong as the trust, transparency, and adaptability they embody. The lessons learned from these meltdowns go beyond economics—they speak to governance, ethics, and collective responsibility.
In both cases, the world witnessed immense pain but also extraordinary recovery and innovation. As we move deeper into an era of digital finance, geopolitical shifts, and environmental challenges, these lessons form the blueprint for building a resilient, equitable, and sustainable global economy—one that learns from its scars and grows stronger after every crisis.
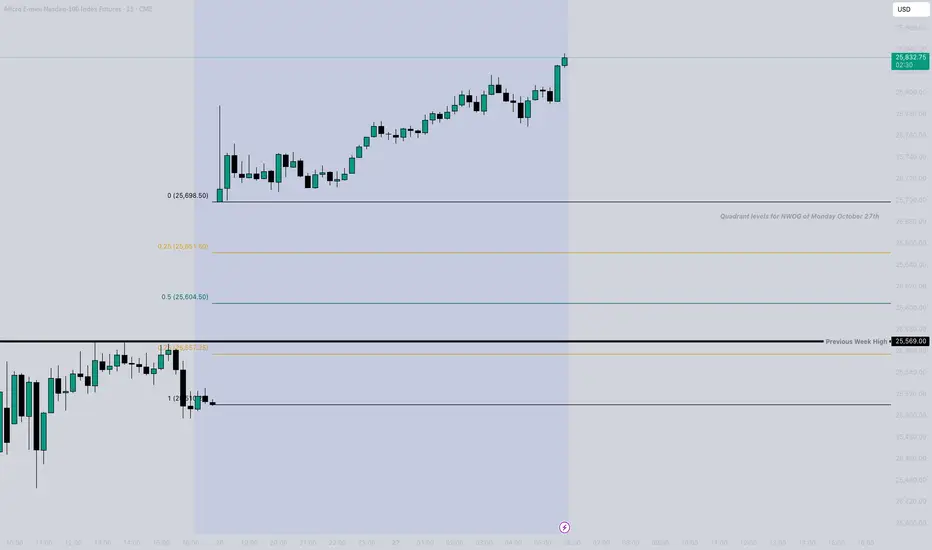
Monday October 27th New Week Opening Gap! Price created a huge gap this week that I will be shifting my attention to going into this weeks trading. I want to keep an eye for how price will likely use this NWOG with lots of medium and high impact news coming into this week as well. No news today so I won't be expecting anything extreme for a casual Monday trade but more focusing on what clues price can leave us that will give us a clear direction for the remainder of the week.

NQ Range (10-20-25, Week 4)NAZ is traveling within the Churn Zone, looking for a Breakout. Favoring a lower move prior to an upside Breakout. Scalping Shorts to KL's until "all hell breaks loose". Lower CZ currently is providing U Turns with the BTD/FOMO's redirecting the NAZ. The O/N, Dead Zone Lifting while the Open Drive continues to sell off. We have seen double Pump/Dumps after any O/N drop or Open Drive sell off. Will update as we go.

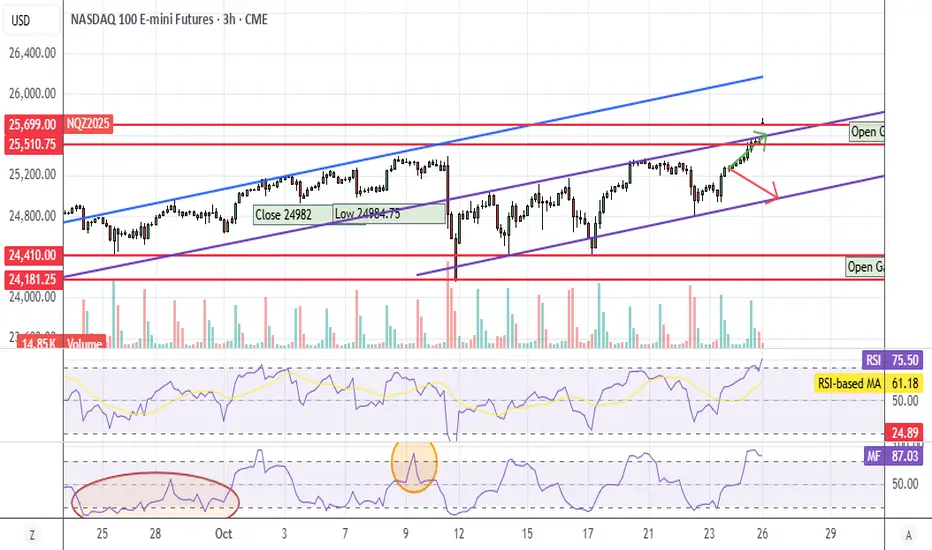
NQ UpdateGap up on trade news, actually regained the previous channel which is why it exceeded my target. I projected a melt up this week, that's all I can say.
MFI and RSI overbought but doesn't matter in a melt up. I think the market will go down and fill the gap but not until next week.
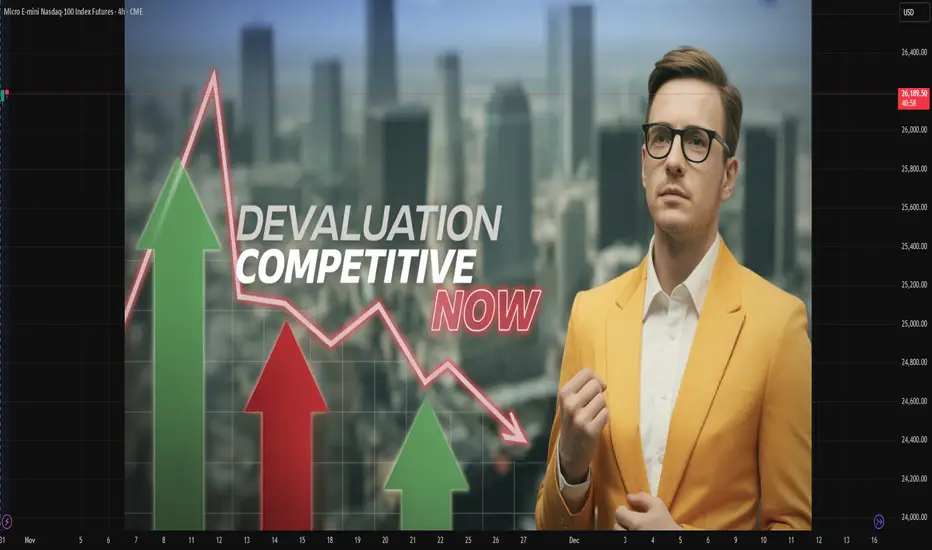
The Concept of Competitive DevaluationIntroduction
In the complex world of international trade and global finance, currency valuation plays a central role in determining the economic health of nations. A country’s currency value not only affects its imports and exports but also influences investment flows, inflation, and overall competitiveness in the global market. Among the many policies that governments use to influence exchange rates, one particularly controversial and strategic move is competitive devaluation—sometimes referred to as a “currency war.”
Competitive devaluation occurs when countries deliberately lower the value of their own currencies in order to gain a trade advantage over others. The main goal is simple: to make exports cheaper and imports more expensive, thereby boosting domestic production and improving the trade balance. While the concept seems straightforward, its implications are far-reaching, affecting everything from global trade relationships to inflation and geopolitical stability.
Understanding Devaluation
Before delving into competitive devaluation, it is crucial to understand what “devaluation” itself means.
Devaluation refers to a deliberate downward adjustment in the value of a country’s currency relative to other currencies. This policy is typically implemented by nations with a fixed or pegged exchange rate system, where the value of the currency is tied to another currency, such as the U.S. dollar or the euro.
For instance, if India were to officially lower the rupee’s exchange rate from ₹80 per U.S. dollar to ₹90 per U.S. dollar, it would mean the rupee has been devalued. This makes Indian exports cheaper for foreign buyers but makes imports costlier for domestic consumers.
Devaluation is generally used to:
Boost exports by making goods cheaper abroad.
Reduce imports by making foreign goods more expensive.
Correct trade imbalances or current account deficits.
Support domestic industries and employment.
However, when multiple countries start engaging in devaluation simultaneously to outcompete one another, the practice turns into competitive devaluation—a self-reinforcing cycle that can destabilize global trade.
Defining Competitive Devaluation
Competitive devaluation is a situation where several countries intentionally devalue their currencies to gain an upper hand in international trade. It’s often described as a “race to the bottom” because every country tries to make its currency weaker to outcompete others.
The basic logic is that if one country devalues its currency, its exports become cheaper on global markets. Other countries, fearing a loss of export competitiveness, may respond by devaluing their own currencies. This leads to a chain reaction of devaluations that can distort trade relationships and create volatility in financial markets.
In essence, competitive devaluation reflects an international tug-of-war where each country attempts to export more and import less by manipulating exchange rates—often at the expense of its trading partners.
Historical Background
The concept of competitive devaluation isn’t new; it has appeared in different forms throughout economic history.
1. The Great Depression (1930s)
During the Great Depression, countries abandoned the gold standard and devalued their currencies to stimulate exports. Britain devalued the pound in 1931, followed by the U.S. in 1933, and many others soon after. This wave of devaluations led to what economists termed “beggar-thy-neighbor” policies—where one nation’s gain in trade came at the expense of others, worsening global economic instability.
2. Post–World War II Period
Under the Bretton Woods System (1944–1971), exchange rates were fixed to the U.S. dollar, and the dollar was pegged to gold. Devaluations were rare but highly significant. For example, Britain devalued the pound by 14% in 1967, and France followed with smaller adjustments. However, competitive devaluation pressures contributed to the eventual collapse of the Bretton Woods system in 1971, when the U.S. dollar was floated.
3. The Modern Era (2008–Present)
The global financial crisis of 2008 revived fears of competitive devaluation. With interest rates at historic lows, countries including the U.S., Japan, and China were accused of manipulating currencies to support exports. This period saw the rise of the term “currency wars,” famously coined by Brazilian Finance Minister Guido Mantega in 2010.
The rise of quantitative easing (QE)—massive money-printing programs by central banks—indirectly weakened currencies, leading to a new form of competitive devaluation, even if not officially declared.
Mechanics of Competitive Devaluation
Competitive devaluation typically occurs through monetary policy tools rather than explicit announcements. The following mechanisms are commonly used:
Interest Rate Cuts:
Lowering interest rates reduces the returns on assets denominated in that currency, making it less attractive to investors. This causes capital outflows and weakens the currency.
Foreign Exchange Intervention:
Central banks may directly buy foreign currencies and sell domestic currency in the forex market to push down its value.
Quantitative Easing (QE):
By injecting liquidity into the economy through large-scale bond purchases, a central bank increases the money supply, which tends to lower the currency’s value.
Capital Controls:
Restricting capital inflows and outflows can manipulate currency movement indirectly.
Official Declarations or Peg Adjustments:
In fixed exchange rate regimes, governments can officially devalue their currency peg to make exports cheaper.
Motives Behind Competitive Devaluation
Countries engage in competitive devaluation primarily to achieve short-term economic goals. Key motives include:
Boosting Exports: A weaker currency makes domestic goods cheaper in global markets, leading to higher export demand.
Reducing Trade Deficits: Costlier imports help reduce trade imbalances.
Stimulating Economic Growth: Export-led growth can boost production and employment.
Combating Deflation: Devaluation can help raise domestic prices by making imports costlier.
Debt Relief: For countries with large foreign debt, devaluation can reduce the real burden when the debt is denominated in local currency.
However, while these benefits may appear attractive, the strategy comes with severe side effects, especially when used by multiple countries simultaneously.
Consequences of Competitive Devaluation
1. Short-Term Gains
In the initial phase, devaluation can indeed stimulate exports and improve a country’s trade balance. Domestic producers gain an advantage, and employment may rise in export-oriented industries. However, these gains are often temporary.
2. Imported Inflation
A weaker currency makes imports more expensive. This leads to higher costs for fuel, machinery, and raw materials—especially in countries dependent on imports—resulting in inflationary pressures.
3. Loss of Purchasing Power
Consumers face higher prices for imported goods, reducing their real income and purchasing power.
4. Retaliation and Trade Wars
When one country devalues, others retaliate to maintain competitiveness. This spiral can trigger global currency instability and even trade wars, where nations impose tariffs or barriers.
5. Financial Market Volatility
Rapid currency movements create uncertainty in capital markets. Investors may pull out funds, leading to exchange rate fluctuations and financial instability.
6. Diminished Global Confidence
Persistent devaluations erode investor confidence in a country’s economic management, leading to capital flight and loss of foreign investment.
7. Long-Term Inefficiency
Instead of improving productivity and innovation, countries may become reliant on devaluation as a shortcut to competitiveness. This undermines long-term structural growth.
Competitive Devaluation vs. Currency Manipulation
Although the two concepts overlap, they differ in intent and execution.
Competitive Devaluation is often part of a broader monetary policy aimed at economic recovery or export promotion.
Currency Manipulation, on the other hand, involves deliberate and sustained actions by a country to artificially maintain an undervalued currency for unfair trade advantage, often drawing international criticism (e.g., the U.S.–China trade tensions).
Real-World Examples
1. China (2000s–2010s)
China was often accused by the U.S. and other nations of keeping the yuan undervalued to boost exports and maintain high trade surpluses. The strategy helped China become a global manufacturing powerhouse, though it also led to significant trade frictions.
2. Japan (Abenomics Era)
Under Prime Minister Shinzo Abe (2012 onward), Japan’s policy of aggressive monetary easing weakened the yen, helping Japanese exporters but drawing criticism from trading partners who saw it as competitive devaluation.
3. Eurozone (Post-2015 QE)
The European Central Bank’s quantitative easing program weakened the euro, benefiting exporters in Germany, France, and Italy, while raising concerns in the U.S. and emerging markets.
4. United States (Post-2008)
Though not a traditional devaluation, the U.S. Federal Reserve’s low-interest-rate and QE policies weakened the dollar, indirectly boosting exports and prompting other countries to follow suit.
Global Implications
The ripple effects of competitive devaluation go far beyond national borders:
Distorted Trade Balances: Export gains in one country often mean export losses in another, leading to global imbalances.
Increased Global Inflation: Weak currencies make global commodities like oil and metals more expensive.
Tensions Among Trading Partners: Countries may accuse one another of unfair practices, straining diplomatic relations.
Unstable Capital Flows: Investors shift funds rapidly in response to currency movements, destabilizing emerging markets.
Reduced Global Growth: If all countries devalue simultaneously, the net benefit vanishes—resulting instead in uncertainty and slower trade growth.
Policy Alternatives to Devaluation
Instead of engaging in competitive devaluation, countries can pursue more sustainable policies such as:
Improving Productivity and Innovation: Enhancing competitiveness through technology and efficiency rather than currency weakness.
Fiscal Reforms: Managing government spending and taxation to stabilize the economy.
Diversifying Exports: Reducing dependence on a few export sectors or trading partners.
Enhancing Domestic Demand: Building a stronger internal market to offset external vulnerabilities.
Coordinated Monetary Policies: Through organizations like the IMF or G20, countries can align exchange rate strategies to avoid destructive currency wars.
Conclusion
Competitive devaluation is a double-edged sword. While it may offer short-term relief to struggling economies by stimulating exports and reducing trade deficits, it ultimately creates more problems than it solves when used excessively or simultaneously by multiple nations.
The strategy can lead to global instability, inflation, and erosion of investor confidence—undermining the very competitiveness it seeks to enhance. The real solution lies not in weakening currencies but in strengthening economic fundamentals: productivity, innovation, diversification, and fair trade practices.
In a world where economies are deeply interconnected, competitive devaluation is less a path to prosperity and more a reminder that sustainable growth depends on cooperation, not competition, in currency markets.
HALLOWEEN THEME: TRICK OR TREAT - RATTLE SKELETON BONES OF 1999Trick or treat
- smell my feet.
Give me something
- good to eat.
If you don't
- I won't be sad.
I'll just make you wish you had!
🎃 Happy Halloween y'all! 🎃
--
Best wishes,
@PandorraResearch Team

NASDAQ (NQ1!) – Bearish Divergence Potential PullbackOn the 1-hour chart, a clear bearish divergence has formed at recent highs, aligning with loss of bullish momentum and price rejection near the upper trend channel. The short-term structure suggests sellers may gain control, with potential retracement zones around the 0.5–0.618 FIB levels and an unfilled GAP below.
If price confirms continuation after a minor relief bounce, we could see a corrective wave unfold before the broader uptrend resumes.
Bias: Short-term Bearish – looking for retracement opportunities toward key support levels before potential trend continuation.

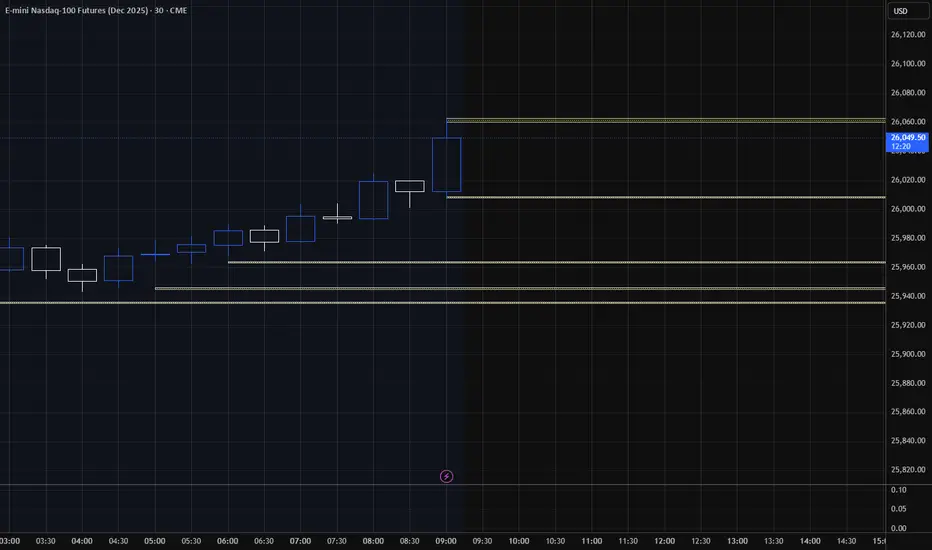
Target areas - NQ price for Market open.10/27/25 - These are the target areas - NQ price for Market open depending if price moves up or down. Will look for trades into these areas.
HOW TO TRADE THE LONG TERM TREND BY DRAWING TRENDLINES!Hey Traders so today wanted to make a quick video that explains how to trade the long term trend early. Also when to move your trendline to stay with the market for as long as possible in long term trends.
Hope This Helps Your Trading 😃
Clifford

NASDAQ 100 (NQ1!): Bullish! Buy The Dips!Welcome back to the Weekly Forex Forecast for the week of Oct. 27 - 31st.
In this video, we will analyze the following FX market: NASDAQ (NQ1!) NAS100
The NASDAQ closed last week at ATHs. I expect more of the same next week.
Look for valid dip buying opportunities, my friends.
If the market disrespects the +OB, then buys become invalidated.
Enjoy!
May profits be upon you.
Leave any questions or comments in the comment section.
I appreciate any feedback from my viewers!
Like and/or subscribe if you want more accurate analysis.
Thank you so much!
Disclaimer:
I do not provide personal investment advice and I am not a qualified licensed investment advisor.
All information found here, including any ideas, opinions, views, predictions, forecasts, commentaries, suggestions, expressed or implied herein, are for informational, entertainment or educational purposes only and should not be construed as personal investment advice. While the information provided is believed to be accurate, it may include errors or inaccuracies.
I will not and cannot be held liable for any actions you take as a result of anything you read here.
Conduct your own due diligence, or consult a licensed financial advisor or broker before making any and all investment decisions. Any investments, trades, speculations, or decisions made on the basis of any information found on this channel, expressed or implied herein, are committed at your own risk, financial or otherwise.

NQ = week 44T.A explained -
BS & FS levels are expected support when dashed lines, tested when dotted and resistance when solid lines.
The inverse is true for the Inv. BS Inv. FS levels, they are resistance as dashed lines, tested as dotted and support as solid lines.
Monthly timeframe is color pink
weekly grey
daily is red
4hr is orange
1hr is yellow
15min is blue
5min is green if they are shown.
strength favors the higher timeframe.
2x dotted levels are origin levels where trends have or will originate. When trends break, price will target the origin of the trend. its math, when the trend breaks, the vertex breaks too so the higher timeframe level/trend that breaks, the more volatility there could be as strength in the orders flow in to fuel the move.

AMP Futures - Introducing Multi-Condition alertsIn this idea we will demonstrate how to create Multi-Condition alerts using Tradingview.

NQ UpdateI totally forgot about the Fed meeting this week.
NQ melting up like I suspected that it would even with two open gaps below. My guess here is that either Powell says something to tank the market or Trump does Friday, lol. Usually what happens when it climbs too high too fast. Or maybe it's buy the rumors, sell the news event.
The market will probably pump right up to the meeting. No point in buying puts until then. I might just stay out of it since the whipsaw is gonna be HUGE. There will be China trade news on Friday too.
RSI and MFI overbought, typical of a melt up, but something always ends a melt up.

AMP Futures - How to create alerts for News Flow filtersIn this idea we will demonstrate how to enable alerts for your News Flow Filters using Tradingview.

HEY NAZ, WHATS NEWS GONNA MAKE YOU DO?! NAZ Bias-Bearish(personally) HOWEVER-----
Let price show us the way. I believe that price will be looking for key levels to bounce around on before making its true climb or decline. The reason I am bearish this week is the belief that negative news is coming and a lack of pullbacks on daily/HTF charts. So sauce.... Im looking for price to come down and hit a fibs retracement at this FVG for a
GOOD BUY bounce! Around 25,428-25,394! First, setup; after that, the IPP (important price point) to look at will be how price interacts with 25,509-25,491. If it doesn't break above on a higher time frame, I believe we push LL to hit BIG FVG 25,214!! which i really want to buy from there but if it breaks above we can see a strong retest of SOB and HH's! Either way, WE GET PAID! Sitting on my hands until the price shows me where we're riding! GDluckThisWeek and happy hunting!

NQ OUTLOOK FOR UP COMINGWe broke an all-time high last week, and we are currently above the 50/200 EMA. A fair value gap is present on the one-hour/4-hour time frame that is close to the previous resistance or break of structure, and TP2 is in play. If it breaks and closes above the last week high, look for the fair value gap to touch for an buy entry. If the market close above the previous 4-hour candle from last week, look for it to take out the current month high, technically it works OK, but if the president says or does something, throw the technicians out the window, stop your loss, and don't be greedy.

