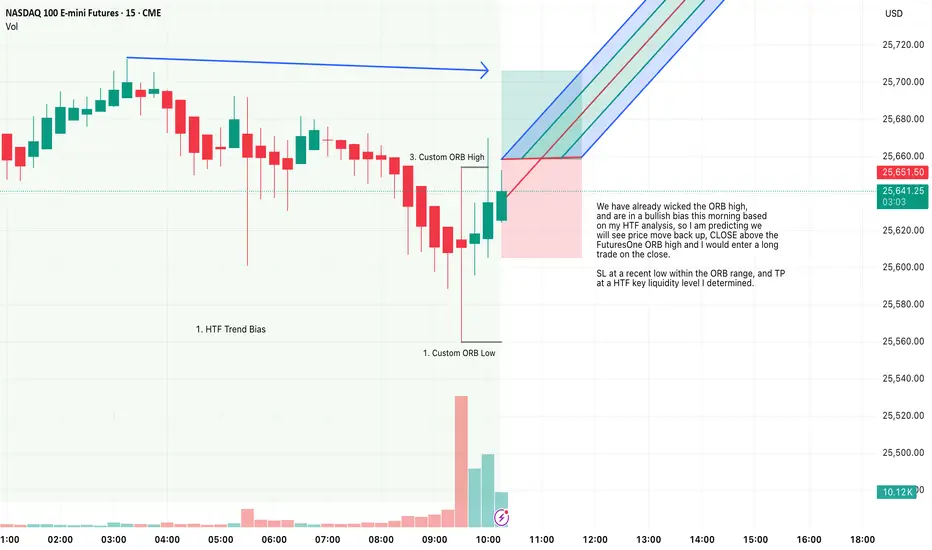
FuturesOne ORB, Long, NQ1, HTF Bias EntryFor this Idea, I am looking at a Long on NQ1.
Price has already wicked the ORB high,
and are in a bullish bias this morning based
on my HTF analysis, so I am predicting we
will see price move back up, CLOSE above the
FuturesOne ORB high and I would enter a long
trade on the close.
SL at a recent low within the ORB range, and TP
at a HTF key liquidity level I determined.
Micro E-mini Nasdaq-100 Index Futures
No trades
Market insights
Nice bounce back at .5% riskNice bounce back at .5% risk following yday loss and a nice way to end the week.

AI PREDICTION BY ODARKAOUIAI PREDICTION BY ODARKAOUI
This a trend prediction using AI and the most secret mathematic Formula.
Enjoy

NQ Trade idea Christmas week (12/22-12/26)Basically using fib .618-.79 level.
1.wait for it to be tapped
2.confirmaton for entry fvg, ifvg, 20 ema crossed
3.stop loss
a). Tight- top of fvg formed
b). Moderate- top of structure
c). Bigger - Top of entry zone

NQ Key zones on this Friday 12/19/25NQ scalp bias: Slight bullish bias as long as price holds above ~25,200—look for quick longs on pullbacks or acceptance above 25,300–25,350 targeting 25,400–25,450, keeping tight stops due to thin liquidity. If 25,200 fails, momentum likely flips short toward ~25,000; prioritize fast entries/exits, trade the levels, and avoid overholding.

NQ/MNQ Daily BiasLooking where price currently sits (8:20am EST), Im anticipating price to take out internal sell side liquidity which sits just above the consequential encroachment of that daily FVG (yellow rectangle). Price will then seek buy side liquidity at yestetday's high, and could possibly take out the day before yesterday's high as well. Overall bullish for the day!

NQ Power Range Report with FIB Ext - 12/19/2025 SessionCME_MINI:NQH2026
- PR High: 25257.50
- PR Low: 25209.75
- NZ Spread: 106.75
Key scheduled economic events:
08:30 | Core PCE Price Index (MoM|YoY)
10:00 | Existing Home Sales
Session Open Stats (As of 12:55 AM)
- Session Open ATR: 430.77
- Volume: 35K
- Open Int: 271K
- Trend Grade: Long
- From BA ATH: -4.1% (Rounded)
Key Levels (Rounded - Think of these as ranges)
- Long: 26521
- Mid: 25264
- Short: 24008
Keep in mind this is not speculation or a prediction. Only a report of the Power Range with Fib extensions for target hunting. Do your DD! You determine your risk tolerance. You are fully capable of making your own decisions.
BA: Back Adjusted
BuZ/BeZ: Bull Zone / Bear Zone
NZ: Neutral Zone

NQ Long Target 26100-26200 by Jan 5thHey everyone! Happy Holidays.
Looking at a move of a couple percent over the holidays to about 26100-26200 with a cold CPI print. The stagflation narrative is going to diminish if we see continued deceleration in inflation it will give the federal reserve more room to breathe on ensuring that the labor market stays supported.
Today's MU earnings gave us a clear picture that the AI demand is real and being built out. Regardless there are still concerns over the funding of data centers for Oracle, and OpenAI's dominance. However, Oracle's CD's have gone to far and are due for some retracement which will cause the stock to prop up, even if it's temporary. However, I believe it's a good long term buy that'll see substantial gains over the next 2-3 years, once the dust settles.
In addition, NVDA, MSFT, AMZN, META, AVGO, ORC have all seen some pretty big downside over the past 6-8 weeks. Given they're generating huge amounts of cash that'll fund 90% of the AI build out. I would extend some retracement back to the upside on these names to help lead the market back up into the end of the year.
Santa Rally's usually bring:
- Lower Liquidity due to HFs taking time off, and retail typically leans more bullish.
- Tax loss selling should be mostly finished
- Many shorts are likely in profit due to the pullback
- Most bad trades should be cut by now.
In thin liquidity there are wider order book gaps.
- Small buy programs can move the price more, as well as any short coverings.
- When it breakouts it can overshoot because there aren't as many shorts there (Aka less resistance)
Into year end risk manager reduce forced selling.
-Short hedges are typically reduced.
-Funds stop EOY rebalancing aggressively.
As long as there is no surprise Fed shocks, or credit events (low likely with fake QE), and no major geopolitical escalation.
Lastly this is NOT guaranteed. We want to see TNX/VIX continue to come down into next year. Otherwise Santa may not be coming to town this year.

NQ 100 E-mini - Technical Update: C-D Leg Evolution & ProjectionAnalysis:
A bullish AB=CD harmonic pattern remains in progress. The C-D leg has exhibited a strong impulsive advance, aligning with expected volume profile. However, price has yet to reach the primary Fibonacci projection cluster that defines the pattern's D-point completion zone.
Recent Price Action & Interpretation:
A pullback occurred following a test of the initial 1.000 Fibonacci projection (25,323). This is interpreted as a routine retracement within the broader C-D leg, not a reversal signal.
Critical Technical Tenet: The pattern is not considered complete until price tests the 1.272-1.414 Fibonacci extension zone, which serves as the primary confluence for the D point.
Forward Outlook & Triggers:
With the pattern still within its normative completion window, the path of least resistance remains upward toward the key projection zone. A sustained move into the 1.272-1.414 area is sought for potential long exit or reversal setups. Any breach below would negate this constructive view.

NQ Pre-date ideaAfter yesterday’s sell-off, I’ve moved away from the idea that this was a daily uptrend experiencing a simple 4-hour retracement. Price action clearly indicated a need for deeper corrective movement.
At this point, I believe there is still downside risk, which forms my bias for the day. On the 15-minute to 1-hour charts, the structure appears to be a 1-hour retracement within a broader 4-hour downtrend—an area that could present a high-quality short opportunity.
Additionally, we have yet to see a sweep of any significant liquidity to the downside that would generate sufficient buying pressure to reclaim higher levels and shift market structure back to the upside.
Today, I’ll be watching for a breakdown and continuation out of the 15-minute to 1-hour retracement, with Wednesday’s low of day as the primary downside target.

NQ Power Range Report with FIB Ext - 12/18/2025 SessionCME_MINI:NQH2026
- PR High: 24999.00
- PR Low: 24925.00
- NZ Spread: 165.5
Key scheduled economic events:
08:30 | Initial Jobless Claims
- CPI (Core|MoM|YoY)
- Philadelphia Fed Manufacturing Index
Session Open Stats (As of 12:55 AM)
- Session Open ATR: 426.70
- Volume: 36K
- Open Int: 266K
- Trend Grade: Long
- From BA ATH: -5.3% (Rounded)
Key Levels (Rounded - Think of these as ranges)
- Long: 26521
- Mid: 25264
- Short: 24008
Keep in mind this is not speculation or a prediction. Only a report of the Power Range with Fib extensions for target hunting. Do your DD! You determine your risk tolerance. You are fully capable of making your own decisions.
BA: Back Adjusted
BuZ/BeZ: Bull Zone / Bear Zone
NZ: Neutral Zone

Theory: 24,200 target in Globex session 12/17/25This is a theory based on speculation. Normally, we don't speculate but this is backed by technicals.
Trump addressing nation at 9 pm today. Keep that in mind.
All day, market's been dumping. We finished around -1.75% in the red. CME_MINI:NQ1!
Now hear me out. At MOC, we dumped 100 points and the low of day was literally the 3:59:59 pm candle. EST of course.
What happened after 4 pm? Pumped 110 points almost instantly:
Why did that happen? To cause a gap after market and then get dumped on during Globex.
Potentially: what caused the dip? Sure sure some news. But what caused EOD dip other than Market On Close Imbalance?
Potentially: someone knows what 9 pm will be about (Venezuela War?), "My fellow Americans, we're going to war". Something like that. Recall: GWB II & Iraq.
But why address the nation at 9 pm in Globex if it's not bearish? To cause as much dip as possible and let it settle overnight where buyers can buy the dip. That means people who dipped at 3:57-3:59 pm get in lower tomorrow at 9:30 AM.
What's my plan? Trade shorts in Globex tonight if I do trade.
So far the theory is theorying and Globex is dumping with tp below NYC close:
Will probably aim to buy dips low low 24ks tomorrow after market open. Remember the people who exited 3:59 will wanna get in lower. Otherwise it's not worth it for em.
Disclaimer: this is all speculation backed with some technicals. I usually don't trade this way. But if we're talking bearish, look at the 4hr inverse cup & handle & 25076 support break & close below the whole day's range.

What to watch for on NAS100?With all of shifts in the climate, market, etc., you never know how the market will respond.
Here are few potential ideas to watch for in the coming weeks.

NQ idea
Seems like NQ is going to want to grab the Liquidity chilling at this 4hr before making any shot at moving higher. If we just smash through it, we are likely trying the fill the volume imbalance on the Daily Time frame (the blue box)
This market is some what of a hard read since we are in a daily up trend, but in a 4 hour downtrend. This 4hr trend could either be a retracement or a complete structure shift. Only the future can confirm

NQ: 291st trading session - recapI'm so mad, last post was called "260th" when it shouldve been "290th", that actually makes me so mad rn...

NQ: 260th trading session - recapIdk whether this is exactly the 260th session. I mean even when I started out I guessed on how many sessions I had, now with not posting but still scalping I just figured this is a good number.
After a month of not really being able to lock in due to personal issues I am finally confident in saying that I am back.
Won't scalp on thursday, but I'll skip school on wednesday so I can scalp then.

QQQ- are we going to make a new high or lower high?This is the set up at the moment what do you think?

NQ Power Range Report with FIB Ext - 12/17/2025 SessionCME_MINI:NQH2026
- PR High: 25363.00
- PR Low: 25294.25
- NZ Spread: 154.0
No key scheduled economic events
Session Open Stats (As of 12:25 AM)
- Session Open ATR: 414.92
- Volume: 32K
- Open Int: 246K
- Trend Grade: Long
- From BA ATH: -4.0% (Rounded)
Key Levels (Rounded - Think of these as ranges)
- Long: 26521
- Mid: 25264
- Short: 24008
Keep in mind this is not speculation or a prediction. Only a report of the Power Range with Fib extensions for target hunting. Do your DD! You determine your risk tolerance. You are fully capable of making your own decisions.
BA: Back Adjusted
BuZ/BeZ: Bull Zone / Bear Zone
NZ: Neutral Zone

NQ_F is at an important spot here. Shorts are valid below 50MA.#NQ_F is really struggling to reclaim the 50MA(25200). In weak markets you should be looking to sell bounces that fail and this market is looking weak. 8MA(25458) is trying to cross below the 21MA(25406) with all 3 MA's curling down. I wouldn't be long here unless price can reclaim 25200 and I would be short on tests of 25120 or 25170 that fail or on a hold below 25940 to target 24820, 24775 and the 100MA(24631). Look out below if the 100MA breaks.


NQ Power Range Report with FIB Ext - 12/16/2025 SessionCME_MINI:NQH2026
- PR High: 25373.25
- PR Low: 25280.25
- NZ Spread: 208.0
Temp 25% AMP margin requirements increase
Key scheduled economic events:
08:30 | Average Hourly Earnings
Retail Sales (Core|MoM)
Nonfarm Payrolls
Unemployment Rate
09:45 | S&P Global Manufacturing PMI
S&P Global Services PMI
Session Open Stats (As of 12:55 AM)
- Session Open ATR: 430.72
- Volume: 41K
- Open Int: 168K
- Trend Grade: Long
- From BA ATH: -4.8% (Rounded)
Key Levels (Rounded - Think of these as ranges)
- Long: 26521
- Mid: 25264
- Short: 24008
Keep in mind this is not speculation or a prediction. Only a report of the Power Range with Fib extensions for target hunting. Do your DD! You determine your risk tolerance. You are fully capable of making your own decisions.
BA: Back Adjusted
BuZ/BeZ: Bull Zone / Bear Zone
NZ: Neutral Zone

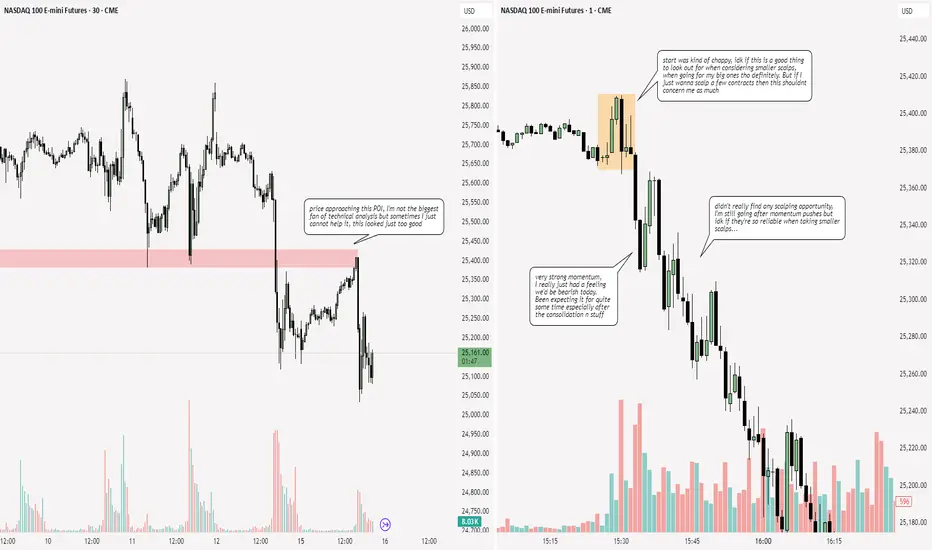
How to trade every smart money concept: HTF tutorialI talk about trading HTF concepts inside of the smart money world not chasing minutia but paying attention to the larger levels
