NQ Range (12-18-25)The O/N has retraced 200 of the 400 points needed to get the NDX out of the Danger Zone range. NQ is at KL 25,103 & Diablo. U Turn attempt in the Overnight is underway. After the Washington Street & Meme Coin public address, they may need to try all Long side tricks to stabilize these markets. My 12
Micro E-mini Nasdaq-100 Index Futures
No trades
Related futures

NQ Range (12-19-25)NAZ Overnight X Games may just pull it off. We are going into probably the final Friday-Monday Long Play of the year. This with the added volatility of contract changes and expirations. The current and previous Overnight session have been keeping the NAZ above the Danger Zone. Looking for the F-M pl

NQ Range (12-17-25)Not what it seems, have to follow the crumbs of Tricks. On 12/26 NQZ hit KL 24,910 and is now at 25,245 (White Arrow). This is the actual PRICE of NQ, which is under Channel and 200 plus points lower. NDX will gap open higher (and above danger zone), that was the goal today. Knowing the Tricks may h

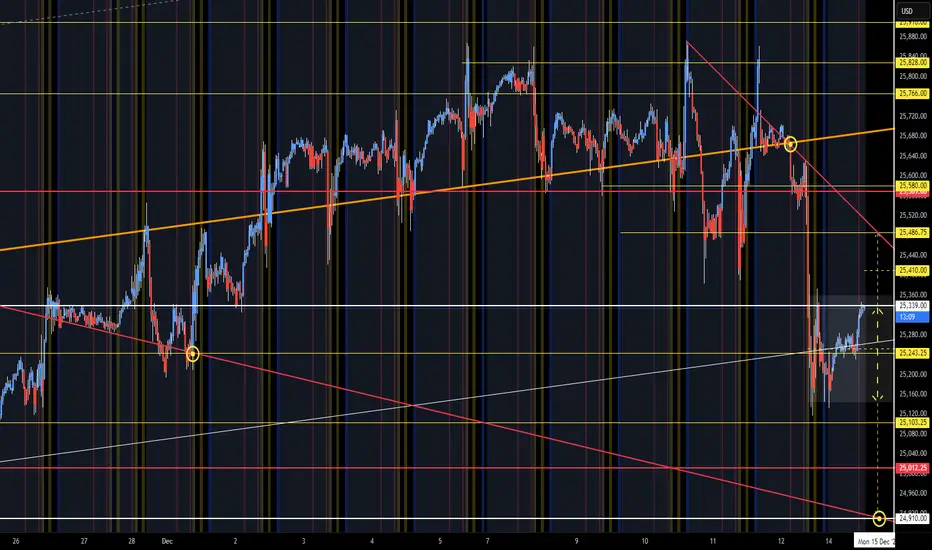
NQ Range (12-15-25)After the drop back into the Churn Zone, we have a NAZ Triangle of Range. Upper circle is the break under 10/22 TL, Mid circle is near mid CZ and Diablo pop on 12/1 and lower circle is CZ bottom and U Turn Target. Open Range (Reg Session) is shaded zone (yellow arrow), white arrow is break out to re
NASDAQ: Dip Buy Time! Wait For Valid Buy Setups!Welcome back to the Weekly Forex Forecast for the week of Dec. 15 - 19th.
In this video, we will analyze the following FX market: NASDAQ (NQ1!) NAS100
The NASDAQ is is still bullish, despite the leeriness toward AI and tech stocks. Profits were taken Friday, causing a bearish close on the day.

25076 is a super level. Watch for further drops if it breaksSee all the arrows where this level got respected. Some sessions it was the perfect bounce on CME_MINI:NQ1! CME_MINI:MNQ1! and other sessions, it was the level that caused an instant flush down or rocket up. I suspect price to hover around this level and either accumulate before a complete rever

NQ Possible Longs IncomingUsing Volume Profile from intraday volume for 12/16/2025. Price keeps reacting to the area in rectangle for some time. It tried breaking below and pushed back up into the resistance area. Looking for price to break through the resistance and turn support out of the POC.

Market today: 12/21/2025New year new opportunities, let us take a look at what is happening before it happens...

NASDAQ Trade Journaling . 16 DECEMBER - TUESDAYNASDAQ Trade Journaling
16 DECEMBER - TUESDAY
HTF: BULLISH
Price takes Support from 4H-BISI
Once Support taken, it creates a Bullish Break of Structure and creates a Bullish Fair Value Gap
1:1.8 R/R Bullish Trade Entry

NQ Resistance at 25,800: Volume Cluster from Friday’s Sell-OffFriday’s strong sell-off on NQ created a high-volume cluster near 25,800.
This shows sellers built short positions in that area before pushing price lower.
If price pulls back to 25,800, sellers are likely to defend it again.

See all ideas
Summarizing what the indicators are suggesting.
Neutral
SellBuy
Strong sellStrong buy
Strong sellSellNeutralBuyStrong buy
Neutral
SellBuy
Strong sellStrong buy
Strong sellSellNeutralBuyStrong buy
Neutral
SellBuy
Strong sellStrong buy
Strong sellSellNeutralBuyStrong buy
A representation of what an asset is worth today and what the market thinks it will be worth in the future.
Displays a symbol's price movements over previous years to identify recurring trends.
Frequently Asked Questions
The current price of Micro E-mini Nasdaq-100 Index Futures is 25,770.50 USD — it has risen 0.46% in the past 24 hours. Watch Micro E-mini Nasdaq-100 Index Futures price in more detail on the chart.
The volume of Micro E-mini Nasdaq-100 Index Futures is 762.45 K. Track more important stats on the Micro E-mini Nasdaq-100 Index Futures chart.
Open interest is the number of contracts held by traders in active positions — they're not closed or expired. For Micro E-mini Nasdaq-100 Index Futures this number is 82.46 K. You can use it to track a prevailing market trend and adjust your own strategy: declining open interest for Micro E-mini Nasdaq-100 Index Futures shows that traders are closing their positions, which means a weakening trend.
Buying or selling futures contracts depends on many factors: season, underlying commodity, your own trading strategy. So mostly it's up to you, but if you look for some certain calculations to take into account, you can study technical analysis for Micro E-mini Nasdaq-100 Index Futures. Today its technical rating is strong buy, but remember that market conditions change all the time, so it's always crucial to do your own research. See more of Micro E-mini Nasdaq-100 Index Futures technicals for a more comprehensive analysis.