NQ Year End Range (11-17-25)Recent price action is looking like what we saw late 2024 into 2025, prior to 26% drop (Feb,25). You can view the Post here:
The lift back up from the 26% drop has been a 60% run up on low volume, including the 10 minute 12% pop from Wash ST. "time to buy" Tweet. NAZ under long term TL (Orange tren
Related futures

BTD ChallengeThree Step Challenge.
Day Trading Nasdaq-100 Futures.
I "Bachelor's"
II "Master's"
III "Phd"
I "Bachelor's"
A. Workshop: five tabs plus a reliable business news service
*1. www.marketwatch.com
*2. 4 Hour chart
***a. Session Volume Profile
***b. volume bars
*3. Daily chart
***a. volume bars
***b. 50
NQ Range (11-10-25, Week 7)The 7 week Forecast is in the final week and we are up about 300 points after getting rejected at upper Target. NAZ back in the Churn Zone and did U Turn off Friday lows just under the Mid Level CZ. KL 483 is TZ to 25,333. Key fact is the NAZ and NDX are at long tern TL. Under the TL is Danger Zone

NASDAQ 100 (NQ1!): Time To Buy This Dip? Oh Yeah!Welcome back to the Weekly Forex Forecast for the week of Nov. 10-14th.
In this video, we will analyze the following FX market: NASDAQ (NQ1!) NAS100
The NASDAQ pulled back after rallying for weeks! We patiently waited for a dip buying opportunity to form. Well, Friday might have given us the in

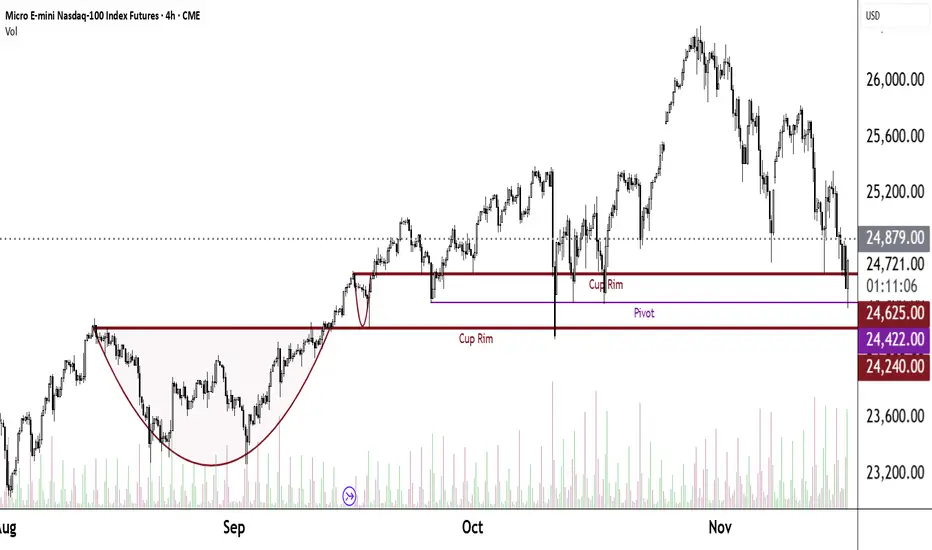
1:11 Trade idea;Nasdaq
A good zone for big trades
Its an instituional level, a lot of agressive buyers

4HR NQ – Attempting a New Direction4HR NQ – Attempting a New Direction (For Educational Purposes Only)
This analysis is shared strictly for educational purposes and is not financial advice. It is intended to illustrate chart-reading techniques, structure mapping, and scenario planning.
Bullish Scenario – Potential Uptrend Zone
Th

Nasdaq Big crash is started from november 2025 month. Good luck.Technically on charts, Nasdaq has completed its viscous fed liquidity supported; all 5 elliot waves starting from 2001 dot com low 797 to present year high 26399. Today is 20.11.2025. Pic is attached for your reference. Will see this chart again after a year or may become obsolelte if nasdaq again c

NQ1! 4HR Setup – EMA 100 + Divergence Structure📊 NASDAQ 100 Futures (NQ1!) – 4HR Chart
- Entry: 24,893
- Stop: 25,398
- Target: 24,403
🧩 Structure:
- Descending channel breakout potential
- EMA 20 touch + divergence structure
- Hidden divergence confirmation on stochastic

NQ Daily Outlook | November 19, 20251H timeframe — using the 50 EMA (black) for trend + 5/10 EMAs (white) for momentum/BOS.
Quick read: We’re still under the 50 EMA, and the whites are curled down. Structure is still making lower-highs and lower-lows, so momentum stays bearish for now.
Bearish idea (favored)
If we stay under the 5/

TREND LINE 5M30 SECOND MODELPrice swept the prior session’s Asia low, tapping into a 4H demand zone aligned with a 1H bullish order block. On the 1-minute chart, liquidity was taken and a clean BISI formed. Entered long on the first retracement into the FVG with stops below the swing low. Targeted the opposing 15M liquidity po

See all ideas
A representation of what an asset is worth today and what the market thinks it will be worth in the future.
Displays a symbol's price movements over previous years to identify recurring trends.
Frequently Asked Questions
The nearest expiration date for Micro E-mini Nasdaq-100 Index Futures (Dec 2021) is Dec 17, 2021.
Traders prefer to sell futures contracts when they've already made money on the investment, but still have plenty of time left before the expiration date. Thus, many consider it a good option to sell Micro E-mini Nasdaq-100 Index Futures (Dec 2021) before Dec 17, 2021.