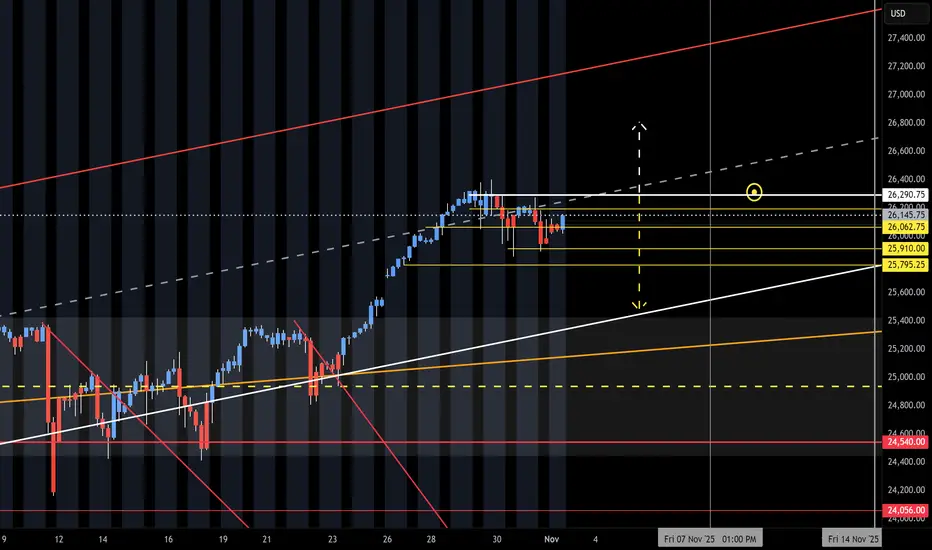
NQ Range (11-03-25, Week 6)The F-M Long move is on with new month and O/N Gap Open UP. Curveball form Friday Close and late head fake. Again, the NAZ will have to use the O/N to lift it back up. Need to see how the Open Drive and Reg Session reacts to the low volume O/N lift. Run up to upper target above KL 26,290 and Short on reject of. Under 290 is a potential drop to 25k or 25,550.
Trade ideas
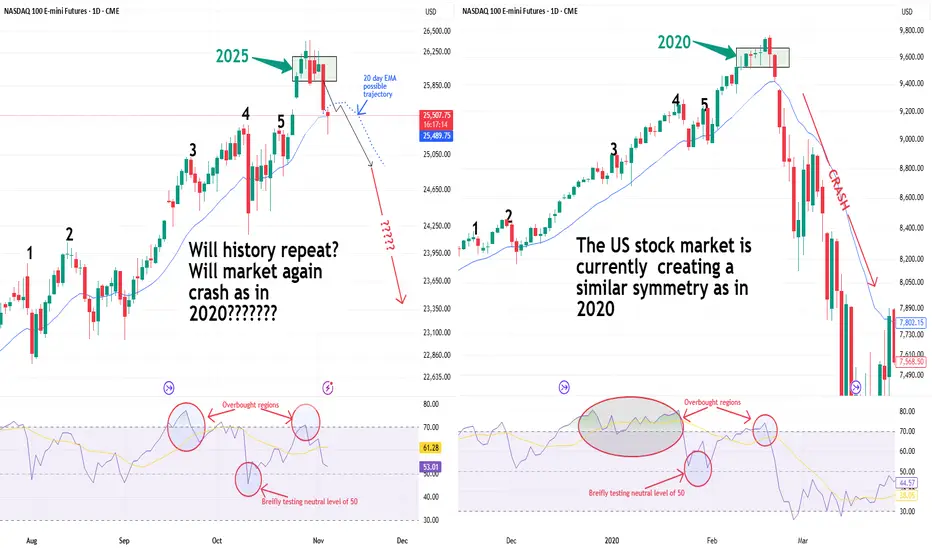
Will History Repeat Itself? NASDAQ 2025 vs 2020The NASDAQ 100 is currently showing a striking structural symmetry to the 2020 pre-crash formation.
Both phases formed a 5-wave impulsive rally, followed by tight consolidation near highs — a typical distribution top pattern.
The 20-day EMA is starting to flatten, signaling a possible loss of momentum.
If symmetry continues, the index could mirror a short- to mid-term correction, similar to early 2020’s breakdown.
While macro conditions differ today, market behavior often repeats in fractal patterns — a reminder that price structure often precedes headlines.
📊 Keep watch for a confirmed EMA rollover and breakdown below support near 25,500 — that could validate the bearish symmetry.

The Empty Feeling After A WinA trader messaged me recently after closing a big win.
He said, “I should’ve felt great but I just felt… flat.”
That sudden emptiness after the high it’s more common than you think.
Follow along. I hope this helps.
BUT FIRST
NOTE – This is a post on mindset and emotion. It’s not a trade idea or system designed to make you money.
My intention is to help you preserve your capital, focus, and composure — so you can trade your own system with calm and confidence.
HERE’S WHAT HAPPENS
You execute beautifully.
Plan followed. Risk managed.
Trade hits target. Account up.
You should feel satisfied.
But instead… there’s a drop.
The charts look dull.
The mind goes searching.
“Maybe one more setup.”
“Just check the next pair.”
That’s not greed.
That’s chemistry.
When you’re in a trade, your brain is flooded with dopamine the chemical of pursuit, anticipation and drive.
When you exit, that hit disappears almost instantly.
To the nervous system, that chemical drop feels like loss .
And loss, even after a win, triggers the instinct to get it back.
WHAT’S REALLY GOING ON UNDERNEATH
You’re not chasing profit.
You’re chasing stimulation, the feeling of being alive in the action.
The mind interprets that feeling as boredom or missed opportunity.
But really, it’s your biology craving more.
The subconscious has learned to equate stillness with emptiness.
So it pushes for movement to escape the come-down.
That’s why so many traders give back profits after doing everything right.
They’re not making bad decisions.
They’re trying to fix a feeling.
HOW TO CATCH IT BEFORE IT CATCHES YOU
1️⃣ Notice your come-down cue.
After closing a trade, does your body feel restless?
Do you scroll, check charts, or reopen the platform out of habit?
That’s the withdrawal in motion.
2️⃣ Name it, don’t fight it.
Say it internally: “This is dopamine dropping.”
It takes the mystery out of the urge.
3️⃣ Breathe through the drop.
A long exhale through the mouth… six seconds out tells the body it’s safe.
Let your eyes rest on something still.
4️⃣ Reframe the pause.
That quiet space after a win isn’t emptiness.
It’s integration.
It’s the moment your nervous system resets for the next run.
Trading mastery isn’t just execution.
It’s emotional regulation before, during and after execution.
I put a lot of time and thought into every post that goes out here so I appreciate your support.
Thank you

HOW TO TRADE THE LONG TERM TREND BY DRAWING TRENDLINES!Hey Traders so today wanted to make a quick video that explains how to trade the long term trend early. Also when to move your trendline to stay with the market for as long as possible in long term trends.
Hope This Helps Your Trading 😃
Clifford

NQ Weekly Recap | November 2–7, 2025Hey everyone, this is the 1-hour chart. It shows the big picture of where price is going. We also use the 5-minute and 1-minute charts to find the exact spot to get in and put our stop loss nice and tight.This week NQ started around 26,400 and just kept falling, falling, falling… all the way down to 25,226. That’s over 1,100 points straight down! Price made a big rounded top (like a hill), then broke lower and never looked back. Every time it tried to bounce a little, the bounce was weak and got sold right away. Bears were in full control. Why was this so easy to trade? Because we only traded WITH the trend. Rule #1 for beginners: the trend is your friend. Going against it is hard. Going with it is like floating downstream instead of swimming upstream. Here’s exactly what we did every day in the New York session: Tuesday: price broke the last low (break of structure), we shorted the small bounce back.
Wednesday: another break lower, shorted the bounce again.
Thursday: opened with a gap down, jumped in on the 5-minute chart and rode it.
Friday: price sped up into the close, took the last piece on the 1-minute chart.
We never guessed. We waited for a clear break, shorted the weak bounce, put stop above the old low, and let the move run. Simple. If you’re new: stick to the 1-hour for direction, drop to 5-minute or 1-minute to pull the trigger. Trade with the trend. That’s it. Still no sign of bulls taking over. Trend is down until price proves otherwise.

Nasdaq reversa 6-11-25Sellers were absorbed in that area, and the Nasdaq will likely reverse from this point in the coming days.
If it breaks through the supply zone, the trend could turn bullish in the next few days.

IYMP Market Pulse Monday Nov 3rd - NQ TGIF bias stays active till Tuesday morning, so expect some sharp moves! 🔥
Scanners are lighting up — 195-minute intervals on NQ and ES showing solid momentum buildup.
Upside focus — 26,283, last Friday’s high, and 26,580 if momentum keeps pushing.
If we pull back — 25,770 is your first key support, 25,520 for that possible gap-fill zone, lastly third leveled at 25,353 where ET completes to the downside
Stay patient, stay structured —
trade the setup, not the noise. 🌱”

NQ UpdateI told everyone to stay bearish until the NQ gap fills. We're almost there, just a small gap left.
The big question is, does the TACO gap need to fill? 2 previous TACO gaps were left unfilled in the spring so I'm not sure. There is also a small gap above from yesterday afternoon.
If NQ breaks below the lower channel line then we know it's headed for TACO. (Today is Taco Tuesday at my local bar as well, lol)

NASDAQ LongsLook for longs in Nasdaq once price either takes Sell side marked during 9:30 open and target Midnight open.
Price can also leave to the upside directly from here.

NASDAQ 100 (NQ1!): Bullish! Buy This Dip!Welcome back to the Weekly Forex Forecast for the week of Nov. 3 - 7th.
In this video, we will analyze the following FX market: NASDAQ (NQ1!) NAS100
The NASDAQ reached all time highs last week, then started a pullback, landing in a +FVG.
As the +FVG continues to hold, look for valid buy setups to form.
Sells are not valid, my friends. Go with the trend!
Enjoy!
May profits be upon you.
Leave any questions or comments in the comment section.
I appreciate any feedback from my viewers!
Like and/or subscribe if you want more accurate analysis.
Thank you so much!
Disclaimer:
I do not provide personal investment advice and I am not a qualified licensed investment advisor.
All information found here, including any ideas, opinions, views, predictions, forecasts, commentaries, suggestions, expressed or implied herein, are for informational, entertainment or educational purposes only and should not be construed as personal investment advice. While the information provided is believed to be accurate, it may include errors or inaccuracies.
I will not and cannot be held liable for any actions you take as a result of anything you read here.
Conduct your own due diligence, or consult a licensed financial advisor or broker before making any and all investment decisions. Any investments, trades, speculations, or decisions made on the basis of any information found on this channel, expressed or implied herein, are committed at your own risk, financial or otherwise.

Will US Stock Market Crash Repeating 2020's TrajectoryThe NASDAQ 100 is creating a similar price action symmetry and RSI behavior to the pattern seen just before the 2020 crash.
* In 2020, this setup led to a sharp correction.
* In 2025, the symmetry looks almost identical.
Is it déjà vu — or just another pause before the next leg up?
NASDAQ 100 (NQ1!): Time To Buy This Dip? Oh Yeah!Welcome back to the Weekly Forex Forecast for the week of Nov. 10-14th.
In this video, we will analyze the following FX market: NASDAQ (NQ1!) NAS100
The NASDAQ pulled back after rallying for weeks! We patiently waited for a dip buying opportunity to form. Well, Friday might have given us the indication of an end to the pullback... and the opportunity to buy the dip may be upon us!
Wait for the shift in the market structure from bearish to bullish to form... then look for your
valid long setups.
Enjoy!
May profits be upon you.
Leave any questions or comments in the comment section.
I appreciate any feedback from my viewers!
Like and/or subscribe if you want more accurate analysis.
Thank you so much!
Disclaimer:
I do not provide personal investment advice and I am not a qualified licensed investment advisor.
All information found here, including any ideas, opinions, views, predictions, forecasts, commentaries, suggestions, expressed or implied herein, are for informational, entertainment or educational purposes only and should not be construed as personal investment advice. While the information provided is believed to be accurate, it may include errors or inaccuracies.
I will not and cannot be held liable for any actions you take as a result of anything you read here.
Conduct your own due diligence, or consult a licensed financial advisor or broker before making any and all investment decisions. Any investments, trades, speculations, or decisions made on the basis of any information found on this channel, expressed or implied herein, are committed at your own risk, financial or otherwise.

NQ1 - Bullish OpenIndexes looking fine to start the week.
Nasdaq has had plenty of chop post interest rate cut, but its been quite tame to print a descending expanding pattern - likely to be bullish but perhaps with some more chop in the pipeline.
Let's see how regular trading hour indexes open 🧐.
This analysis is shared for educational purposes only and does not constitute financial advice. Please conduct your own research before making any trading decisions.

NQ Range (11-10-25, Week 7)The 7 week Forecast is in the final week and we are up about 300 points after getting rejected at upper Target. NAZ back in the Churn Zone and did U Turn off Friday lows just under the Mid Level CZ. KL 483 is TZ to 25,333. Key fact is the NAZ and NDX are at long tern TL. Under the TL is Danger Zone to lower CZ and then TLX 24,056. Current range to watch is 25,333 and 24,817. Friday lift was Failed Auction up and these usually will get retested. Could be a start of a U Turn (that will drop and retest). Or, just another Friday pump drop offset that will trap the BTD/FOMO's.

Updated charts for the week! PLEASE follow me and support!remember eat between the lines!!! Also follow me if you want more chart updates... I will only start posting if you guys show me the love and follow up. I help you see the market and you follow up!
NQ QuantSignals V3 Futures 2025-11-09NQ QuantSignals V3 Futures 2025-11-09
NQ Futures Signal | 2025-11-09
• Direction: SELL | Confidence: 70%
• Type: Index Futures | Timeframe: 1H
• Entry Range: $25175.00
• Target 1: $24800.00
• Stop Loss: $25450.00
• Volume vs Avg: 1.0×
• Recent Move: -2.11%
• ⚠️ MODERATE RISK WARNING: Consider reducing position size due to moderate confidence level.
⚖️ Compliance: Educational futures commentary for QS Premium. Not financial advice.
🚀 QS V3 ELITE FUTURES ANALYSIS
Generated: 2025-11-09 08:04:55 ET
Instrument: NQ ($25166.25)
Type: Index Futures
Trend: BEARISH
Confidence: 79.2%
Timeframe: 1H
Model: QS + Katy AI
Strictness: MEDIUM
🎯 TRADE RECOMMENDATION
Direction: SELL
Confidence: 70%
Conviction Level: MEDIUM
🧠 ANALYSIS SUMMARY
Katy AI Signal: Bearish with 69.2% confidence, predicting -2.11% decline to $24,635.68
Technical Analysis: Current price at $25,166.25 showing -2.11% decline, trading near session lows. Price action indicates sustained selling pressure with no gap to fill. The VWAP alignment suggests consistent selling throughout the session.
Macro & News: No major catalysts recently, allowing technical factors to dominate. Normal VIX at 19.08 indicates stable volatility environment favoring trend continuation.
Flow & Positioning: Options flow shows unusual activity at $20,000 strike with max volume calls, suggesting potential institutional hedging. Volume at 1.0x average indicates normal participation without panic selling.
Risk Level: MEDIUM - No economic catalysts creates cleaner technical play but requires monitoring for unexpected news flow.
💰 TRADE SETUP
Contract: NQ
Entry Price: $25,150 - $25,200
Take Profit 1: $24,800
Take Profit 2: $24,635
Stop Loss: $25,450
Position Size: 2 contracts (moderate conviction with tight risk parameters)
⚡ COMPETITIVE EDGE
Why This Trade: Strong alignment between Katy AI's high-confidence bearish predictio
Image
QS Analyst
APP
— 8:04 AM
n and recent price action decline creates a cohesive short bias opportunity.
Timing Advantage: Entry during Globex session allows positioning before potential institutional flow during regular hours. Katy's prediction shows consistent downward pressure over next 120 periods.
Risk Mitigation: Tight stop loss at $25,450 provides 1:2.5 risk/reward ratio. Staggered take profits lock in gains while allowing for extended move.
🚨 IMPORTANT NOTES
Monitor for any unexpected news catalysts that could reverse technical bias
Katy prediction shows some volatility between Nov 11-12 with temporary rebounds before resuming decline
Options flow at extreme strikes ($20,000) suggests hedging activity that may indicate institutional caution
Normal VIX levels support trend continuation but watch for volatility spikes above 22
⚠️ KATY CONFLICT EXPLANATION
No Conflict Detected: My analysis fully aligns with Katy AI's bearish prediction. The technical decline of -2.11%, normal volatility environment, and lack of bullish catalysts all support the short bias. Katy's 69.2% confidence rating and consistent downward trajectory throughout the prediction horizon provide strong directional conviction.
📊 TRADE DETAILS 📊
🎯 Instrument: NQ
🔀 Direction:
💵 Entry Price: 25175.00
🎯 Profit Target: 24800.00
🛑 Stop Loss: 25450.00
📏 Size: N/A
📈 Confidence: 70%
⏰ Entry Timing: N/A
🕒 Signal Time: 2025-11-09 11:04:51 EST
⚠️ MODERATE RISK WARNING: Consider reducing position size due to moderate confidence level.
---
QS V3 Futures Strategy System - Professional futures trading with Katy AI intelligence.

Nasdaq Selloff Extends in Asia — But How Bad Is It, Really?Asian markets saw a second wave of selling today, with Nasdaq futures falling around 1% during Asian trade. After fielding several emails from journalists asking “why,” I can’t help but think this move may be more about technical repositioning after an extended run higher.
In this video, I walk through the monthly, weekly, and daily Nasdaq charts to share where I think we could go from here.
Matt Simpson, Market Analyst at City Index.

NQ UpdateNQ left an open gap after the break, so now we have one above and two below. Quite frankly, there's too much whipsaw to be trading options so I'm taking a break.
I may or may not be posting updates.
Analysis of the NQ for the week of November 10 to 14, 2025Analysis based on a deep mathematical and scientific understanding of price action, particularly for my two markets NQ & ES. Looking forward to reading your comments.
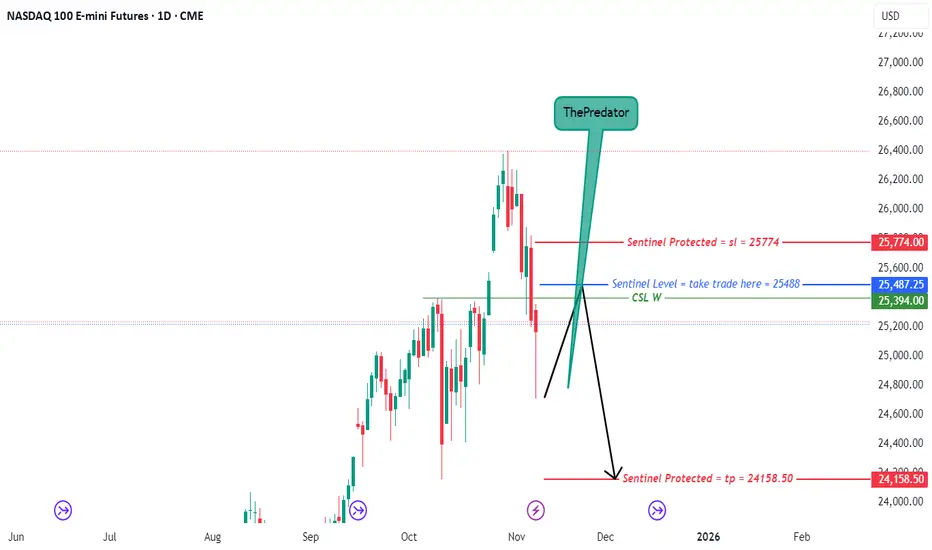
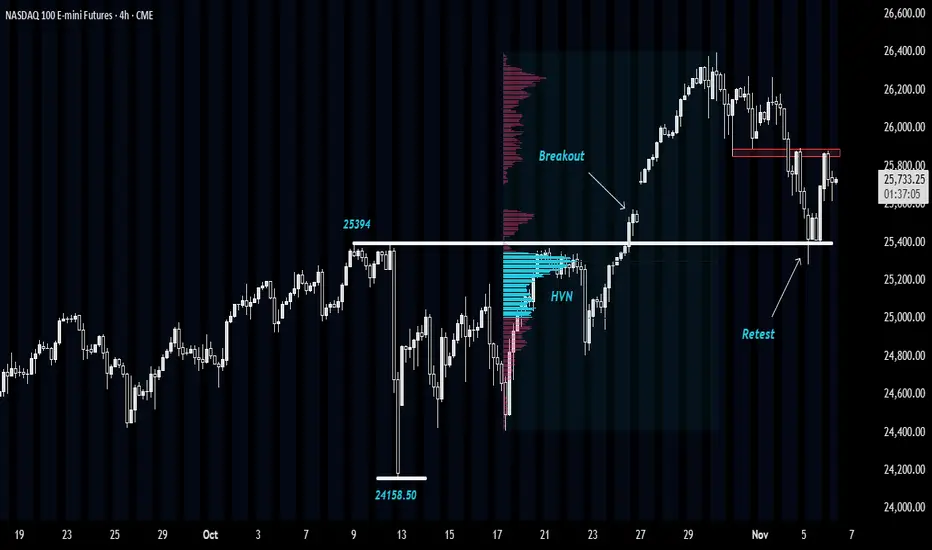
NASDAQ: Retesting Breakout ZoneThis idea is based upon successful Breakout Retest scenario near a High-Volume Node (HVN).
Let's first get to the basics:
A successful Breakout Retest -
A breakout retest scenario occurs when the price breaks through a key level of support or resistance and then returns to test that same level before continuing in the breakout direction.
For example, if the price breaks above a resistance zone, traders wait to see if the price comes back down to that zone. If it holds as new support and shows rejection candles or strong buying, that’s called a successful retest.
At a successful retest, several things typically happen:
➡The old resistance acts as new support (or vice versa in case of breakdown).
➡Traders who missed the initial breakout enter the trade, adding momentum.
➡Weak hands or short-term traders exit, cleaning up the order flow.
➡The price often accelerates in the direction of the breakout with stronger conviction and volume.
In simple terms, a successful retest confirms that the breakout was genuine and not a false move.
High Volume Node -
HVN is a price level or zone on a volume profile where a large amount of trading activity has occurred. It represents an area where buyers and sellers actively agreed on price, leading to high transaction volume.
These zones usually act as balance areas- price tends to pause, consolidate, or even reverse near them because many traders have open positions there. When price revisits an HVN, it often encounters strong support or resistance, as market participants react to protect or exit their earlier trades.
In short, an HVN marks a fair value area on the chart where market consensus was strongest.
NASDAQ Analysis -
In the Nasdaq E-mini chart, we can observe a sharp decline from 25,394 to 24,158, but without any meaningful follow-through on the downside.
Subsequently, the price reacted once again from this same zone on 21st and 22nd October, before eventually breaking above 25,394 with strong momentum to form new highs.
At present, the market has pulled back to the 25,394 level, which previously acted as resistance. This area is now holding as support, suggesting a successful retest and presenting a potential buying opportunity.
Moreover, this retest is aligning with a HVN around 25,300, further reinforcing the support zone.
In the short term, the price is facing resistance near 25,900. A conservative long entry could be considered after a sustained move above 25,900, while an aggressive low-risk entry could be initiated around 25,500, closer to support.
📣Disclaimer:
Everything shared here is meant for education and general awareness only. It’s not financial advice, nor a recommendation to buy, sell, or hold any asset. Do your own research, manage your risk, and make sure you understand what you’re getting into.
NASDAQ (NQ1!) – Bearish Divergence Potential PullbackOn the 1-hour chart, a clear bearish divergence has formed at recent highs, aligning with loss of bullish momentum and price rejection near the upper trend channel. The short-term structure suggests sellers may gain control, with potential retracement zones around the 0.5–0.618 FIB levels and an unfilled GAP below.
If price confirms continuation after a minor relief bounce, we could see a corrective wave unfold before the broader uptrend resumes.
Bias: Short-term Bearish – looking for retracement opportunities toward key support levels before potential trend continuation.

NQ Power Range Report with FIB Ext - 11/4/2025 SessionCME_MINI:NQZ2025
- PR High: 25574.25
- PR Low: 25501.75
- NZ Spread: 161.75
Key scheduled economic events:
09:15 | ADP Nonfarm Employment Change
10:00 | ISM Non-Manufacturing PMI
- ISM Non-Manufacturing Prices
10:45 | S&P Global Services PMI
Session Open Stats (As of 12:45 AM)
- Session Open ATR: 401.88
- Volume: 92K
- Open Int: 290K
- Trend Grade: Long
- From BA ATH: -3.5% (Rounded)
Key Levels (Rounded - Think of these as ranges)
- Long: 26636
- Mid: 25410
- Short: 24039
Keep in mind this is not speculation or a prediction. Only a report of the Power Range with Fib extensions for target hunting. Do your DD! You determine your risk tolerance. You are fully capable of making your own decisions.
BA: Back Adjusted
BuZ/BeZ: Bull Zone / Bear Zone
NZ: Neutral Zone
NQI love the way this monthly chart for NQ is respecting the upward channel. If it fell to the middle line of the channel it is still overall bullish....
Note: check back in a few months
