Confluence of Tradingview's reversal indicator and S/R on NQ Today’s NQ session highlighted how powerful confluence can be. By combining TradingView’s Reversal Indicator with well-defined Support & Resistance levels, multiple signals aligned to show potential turning points in the market. This approach demonstrates how blending indicators with price structure can improve clarity and confidence in trade decisions.
MNQH2025 trade ideas

NQ! WEEK 2 LEVELSFor the 2nd week of September, I’ve structured my Nasdaq futures charting setup around key pivot levels (weekly and daily). My focus is on identifying price reactions at the central pivot, with clear support (S1, S2, S3) and resistance (R1, R2, R3) zones. These levels serve as my primary reference for intraday bias, potential reversals, and breakout continuations. I’ll be monitoring how price behaves around these pivots to align short-term entries with the broader weekly context.

NASDAQ Caution + ConfirmationCME_MINI:NQU2025
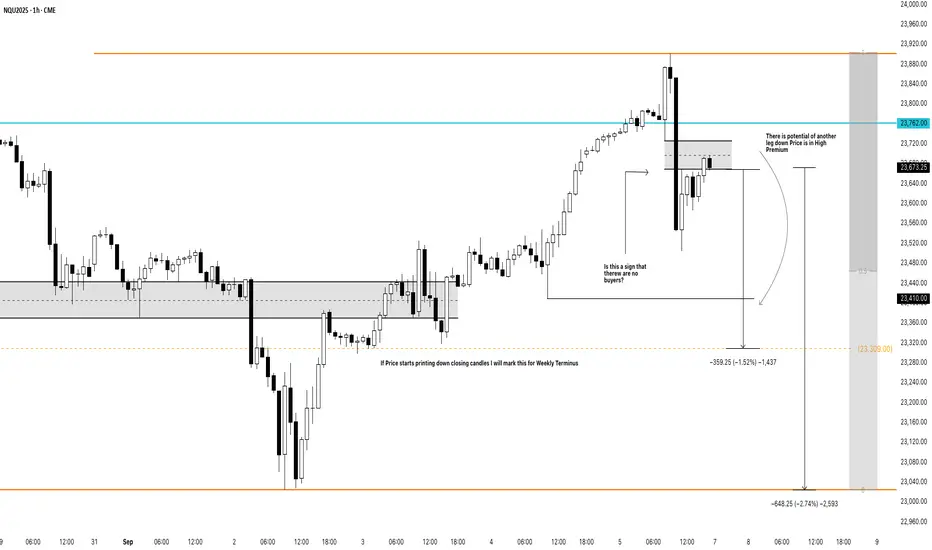
Strong Rejection at Premium Pricing
Price rallied into a high-premium area above 23,800 and sharply rejected, leaving a large bearish displacement candle.
This suggests aggressive selling pressure and potentially an exhaustion of buyers at higher levels.
High Premium Context
Price is consolidating in a “high premium” zone (above equilibrium of the most recent swing).
The gray box marks the imbalance, which is currently acting as resistance where sellers may re-enter.
Liquidity & Posible Weekly Terminus
watching for confirmation of sustained bearish order flow.
Key Support Zones
23,410 → First downside target, aligning with partial fill of prior inefficiency and structural support.
23,309 → Major liquidity pool and marked as a potential weekly terminus if price breaks lower.
23,040 → Extended downside projection, aligning with prior weekly low sweep.
Market Sentiment
buyers failed to sustain price above 23,762.
If true, this supports a bearish continuation narrative into next week.
Bias & Trade Scenarios
Bearish Bias (Primary)
Trigger: Failure to reclaim 23,762 or rejection inside the gray FVG zone.
Entry: Look for bearish price action confirmation in the 23,700–23,750 zone.
Targets:
TP1 → 23,410
TP2 → 23,309
TP3 (extended) → 23,040
Stop: Above 23,880 (previous high / invalidation).
Bullish Counter Scenario (Secondary)
Trigger: A clean break and close above 23,762 followed by acceptance above 23,800.
Target: Re-test of 23,900 highs with potential continuation toward 24,000 round number.
Stop: Below 23,600.
Summary
Nasdaq futures rejecting a high-premium zone near 23,900, with price now consolidating inside a bearish FVG. Unless buyers reclaim 23,762 decisively, the path of least resistance favors another leg lower toward 23,410 → 23,309 → 23,040.
This setup highlights a bearish displacement with downside liquidity objectives, but traders should monitor reactions at 23,410 and 23,309 as potential bounce zones.
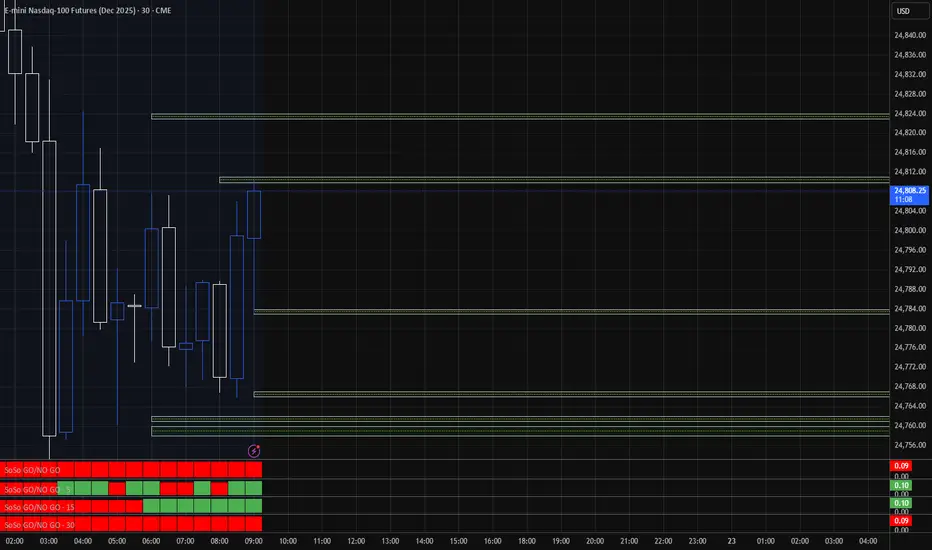
NQ100 Intraday Outlook – Sept 8, 2025🧠 NQ100 Intraday Outlook – Sept 8, 2025
Bias: Intraday Bearish after NY Open
Price is currently trading within a well-defined premium zone, between the Sunday-Monday Order Block and the BPR M30 area.
🧩 Key Observations:
Price tapped into a minor M5 Order Block (OB) right after the 8:30 NY macro event.
We're seeing a reaction to a short-term OB, with a small push up likely to grab liquidity above the London session high.
Expecting liquidity run + rejection from the upper OB zone (23,810–23,830).
🔽 Bearish Scenario:
After the sweep of local highs, I anticipate a sell-off toward the Imbalance zone below (23,710 area).
Main targets are:
Imbalance fill
Possibly further down toward Weekly Open near 23,680
🔧 Confluence:
Midnight Open has already been reclaimed.
NY AM session is about to open – expecting expansion to provide confirmation.
Potential divergence between NQ (stronger) and ES (weaker) gives context for relative weakness later in the session.
📌 Idea Summary:
I expect one final push into the premium zone to grab liquidity before reversing down toward the Imbalance and possibly into the Weekly Open.

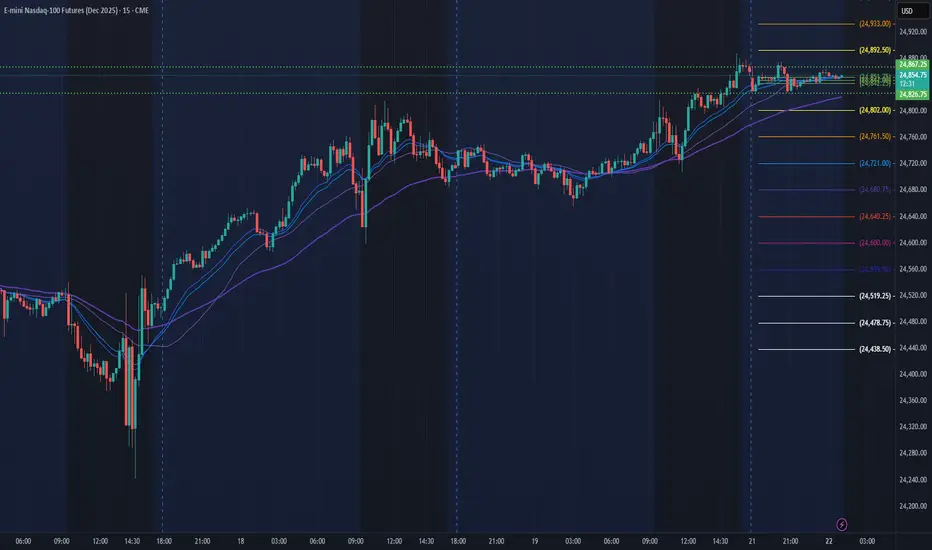
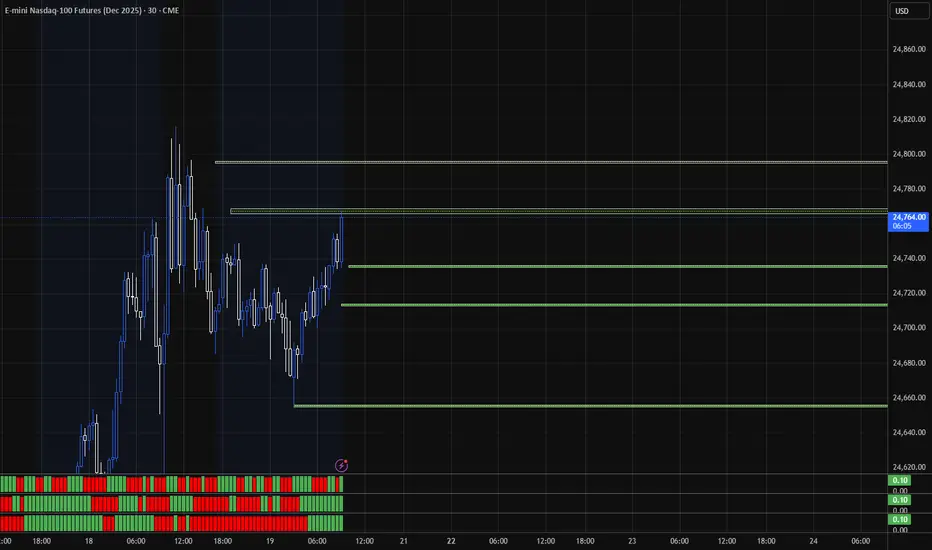
Target areas above and below current NQ price for Market open.9/22/25 - Target areas above and below current NQ price for Market open.
MNQ: Monday, 9/22/25 Day Trades8:16:00 CONTEXT
Px is coiling. I will be ready for a breakout. Very possible it will go down to the green shaded Buy the Dip area.

long NQYep, i hope i didnt miss that trade at the first touch of the black box.
Anyways, dont chase that long, it does looks very solid setup, just wait for the price to touch this black box again (only if it happened), check the RSI if its oversold on 5 min tf, if so enter and stick to the SL regardless of the outcome.
Just hopefully the announced news by trump would not affect this setup.

NQ Targets (09-22-25)NAZ with Friday-Monday O/N breakdown into Monday Open Drive (looking for Open Dive today). 24,900 is KL, Long above Short Scalp below to drop target test below.
4HR below with Blue YTD open level.
NQ Power Range Report with FIB Ext - 9/22/2025 SessionCME_MINI:NQZ2025
- PR High: 24867.00
- PR Low: 24826.75
- NZ Spread: 90.0
No key scheduled economic events
Session Open Stats (As of 12:45 AM 9/22)
- Session Open ATR: 270.71
- Volume: 24K
- Open Int: 277K
- Trend Grade: Long
- From BA ATH: -0.1% (Rounded)
Key Levels (Rounded - Think of these as ranges)
- Long: 25204
- Mid: 23571
- Short: 21939
Keep in mind this is not speculation or a prediction. Only a report of the Power Range with Fib extensions for target hunting. Do your DD! You determine your risk tolerance. You are fully capable of making your own decisions.
BA: Back Adjusted
BuZ/BeZ: Bull Zone / Bear Zone
NZ: Neutral Zone
NQ: 256th trading session - recapTbh I'm pretty scared. Again my strategy is so perfect - exept for the part that scares me: HYPERSPECIFIC PRICE ACTION NEEDED TO TRADE. I hate this so much since trades I love don't happen often. I can be grateful if I get an opportunity once per month tbh

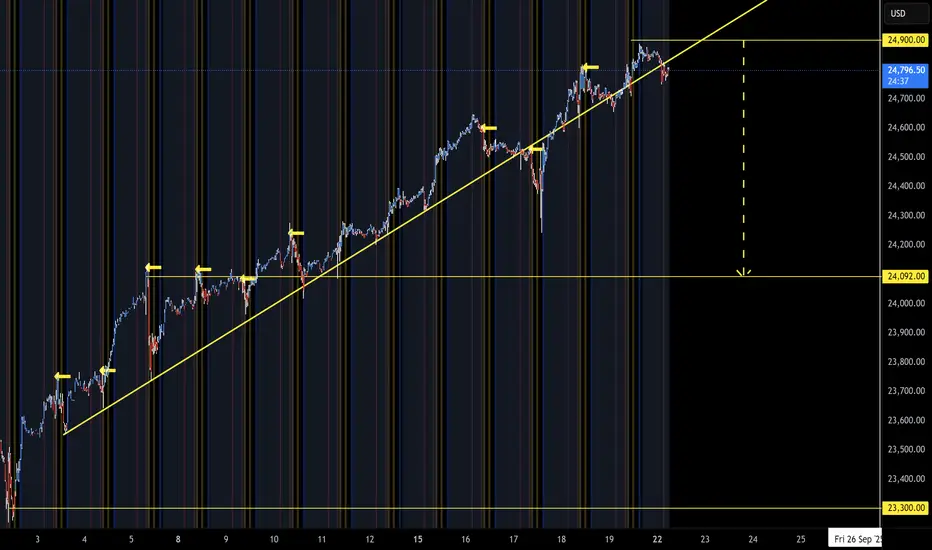
MNQ ATH overall bullish Overall I am bullish while at ATH but we did take ATH n friday which would indicate a retrace is inevitable before another leg up. Where that retrace comes back to is the big question.
We have a 1H FVG at EQ of the Fridays leg up which could be a decent rejection point, if we wanted to retrace deeper we could be looking at a retrace to the 4H EQ as marked by the red line and lower large FVG.
Either way I am expecting price to go higher but will be watching both these points this week to see the PA reaction.
Potential TP's for the long based on Fib extensions.

MNQ: Sunday, 9/21 Day TradesThree Trade Plans
1. Breakouts
2. Dips
3. Pivots
Each plan has a Very Aggressive, Moderately Aggressive and Least Aggressive version. For purpose of illustration, I will trade this hypothetical 50k account Very Aggressively. I will call out those entries.
Please note, these are all aggressive trades, even the Least Aggressive version.
Please note, while I call this an hypothetical 50k account, these are real trades done with real money in real time with real results. The only thing different is the quantity of shares that I actually trade. I extrapolate the results to reflect the results of a 50k account. Every entry I call out on this Very Aggressive version is +1 contract MNQ.
I chose 50k hoping to make this amount as accessible to as many as possible and at the same time big enough to trade without quickly blowing it up and big enough to earn a return worthy of the time and money put into it.
The first trade I called out fxed 9/12/25 @ 09:09:00 NY time. From then to Friday, 9/19, 17:00:00 NY time, market close, the above defined trading plan placed 209 entries with 205 exits. AROI: $7,379.40 Take/50k x 100 x 365/8 calendar days = 673.37025%. Take = profit from the 205 entries that hit their targets.
I hope you will find this helpful and that you will place these same trades on your demo account. I have no idea if this account will continue to grow or if it will blow up.
In order for this to be a meaningful trading plan I shall set forth some Foundational Principles and I shall flesh out details as they arise.
Foundational Principles
1. Protect King Account
2. Margin is key to protecting the King
3. Context is key to interpreting charts
4. AROI is the gold standard for measuring results
Breakouts
1. The very first Breakout order is placed above where you expect a bounce. For this illustration I started at 24050, just above a Pennant pattern.
2. Use a stop market order +1 MNQ for every entry.
3. Target for each and every order is 19 points.
4. Every 5 points place another order.
Picture this as a ladder. After you reach the fourth rung, you will take some profit every 5 points.
This is what I call the Very Aggressive version.
The Moderately Aggressive version places an entry every 10 points.
The Least Aggressive version places an entry every 20 points. There is no overlap. You will exit at your 19-point target before you place another entry.
I always have Breakout orders stacked up. If the Px moves overnight I catch the action as I sleep.
When the Px pulls back I wait for a new bounce and start the process again.
Of course, when it does pull back, I will have some open trades. I leave them alone. In this historical bull market that we are in, in all likelihood they will hit their targets in due time. If Initial Margin is a problem, I will sell them before 16:45:00 NY time and buy them back @ 18:00:00 at a lower Px if possible. The only time I run into a problem with this is at rollover time. Sometimes I have a loss at rollover time. But careful management minimizes any loss. So far, the advantages of this plan have far outweighed that one disadvantage.
One very important aspect of this plan is that I do not use a stop loss. As alluded above, I very carefully watch margin requirements, and I zealously protect the King - King Account. In this hypothetical 50k account, 50k is King Account. At some time in the future, I shall raise that amount. For example, let's say the account grows to 60k. I will divide the increase by two and add that to the initial amount. 55k will be my new King.
This is a lot of detail to take in. I will leave off here and flesh out the Dips and Pivots later. You will notice I often post AROI UPDATES throughout the day. By nature, I am not a risk taker. I need constant encouragement to keep going. You will also notice I often post CONTEXT UPDATES throughout the day. I try to stay on top of news events that affect the markets. I also carefully watch the price action, support and resistance, individual candles and candlestick formations.
You may occasionally catch me with a math error. I am not a clerk. My syntax is not always correct. I am not an English teacher nor a typist. But I will do my best.

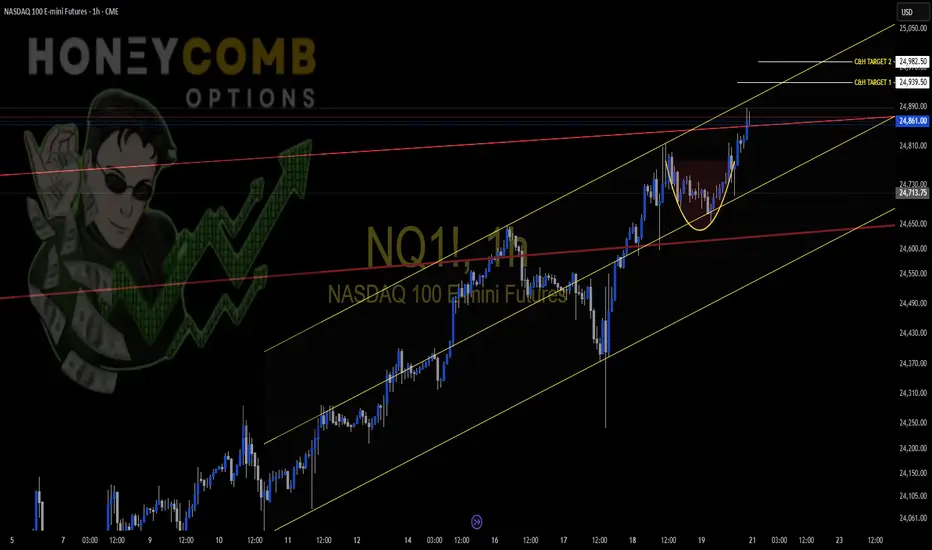
Target areas above and below current NQ price for Market open.9/19/25 - Target areas above and below current NQ price for Market open.
Today's PossibilitiesFOUNDATIONAL PRINCIPLE
protect King Account
CONTEXT
1.no economic announcements scheduled on MarketWatch
2.MNQ sideways i.e. it is looking for direction
3.We have had stellar results so far
4. we are 4L @ 24,807.50 (avg. px)
ACTIONS
1.caution is the word
2.waiting for a bounce
3.24590 - 25550 is our nearest Buy the Dip area. It is a strong support (Ref.9/18 post).

NQ Power Range Report with FIB Ext - 9/19/2025 SessionCME_MINI:NQZ2025
- PR High: 24743.00
- PR Low: 24711.50
- NZ Spread: 70.5
No key scheduled economic events
Session Open Stats (As of 12:45 AM 9/19)
- Session Open ATR: 275.89
- Volume: 27K
- Open Int: 268K
- Trend Grade: Long
- From BA ATH: -0.4% (Rounded)
Key Levels (Rounded - Think of these as ranges)
- Long: 25217
- Mid: 22503
- Short: 21790
Keep in mind this is not speculation or a prediction. Only a report of the Power Range with Fib extensions for target hunting. Do your DD! You determine your risk tolerance. You are fully capable of making your own decisions.
BA: Back Adjusted
BuZ/BeZ: Bull Zone / Bear Zone
NZ: Neutral Zone
NQ: 255th trading session - recapTHE PULLBACK WILL COME, I JUST KNOW IT. But tbh, when it comes I'll know, it'll probably consist of complete bearish force already in the opening, no greend candles the first 3-5 candles. With price pushing so higher the downfall will be insane. I don't even know whether I'll get an entry - not kidding. Price pushing too fast and too low
--> no entry, too late, no momentum available anymore

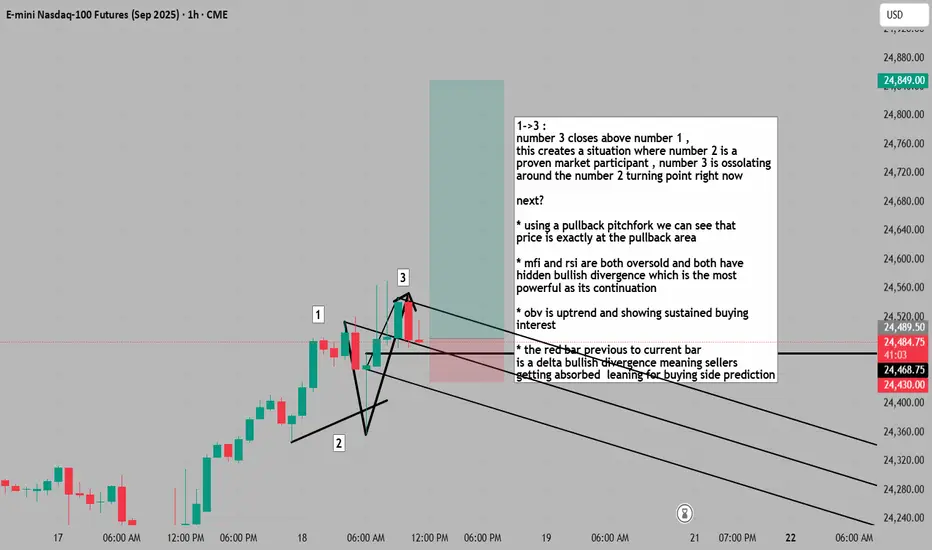
I guessed all the confluences, every single one, and I was rightHAAHHAHAH , cant make this up, I guessed every single confluence I listed, hidden bullish, delta divergence, reverse pitchfork, and everything when I actually checked it, was there, luck?
( use footprint chart to check delta divergences / imbalances )
1->3 :
number 3 closes above number 1 ,
this creates a situation where number 2 is a
proven market participant , number 3 is ossolating
around the number 2 turning point right now
next?
* using a pullback pitchfork we can see that
price is exactly at the pullback area
* mfi and rsi are both oversold and both have
hidden bullish divergence which is the most
powerful as its continuation
* obv is uptrend and showing sustained buying
interest
* the red bar previous to current bar
is a delta bullish divergence meaning sellers
getting absorbed leaning for buying side prediction

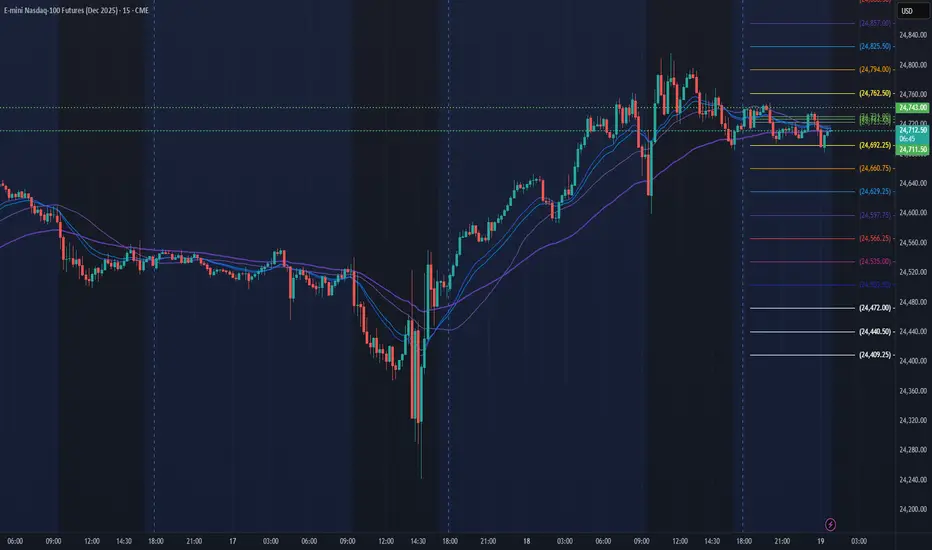
Today's Trade PossibilitiesBuy the Dip
Green-shaded areas are accumulation/distribution areas.
Nearest Buy the Dip: 24550 - 24490
Pros:
1.prior vpoc @ 24503 (from 9/12)
2.vpoc @ 24412.75
3.pdc 24465.25
4.support @ 24490 (Head and Shoulders Neckline from 9/16)
AGGRESSIVE TRADES
put in orders now 1 MNQ @ 24550. Buy 1 MNQ at 5-point intervals from here to 24490. 19-point target for each trade.
MODERATE TRADES
wait for a good bounce, then place your trades in 5-point intervals, 19-point targets
CONSERVATIVE TRADES
wait for a bounce at or about 24490, then place your trades
Climb the Ladder Breakout Trades
use the above same logic to choose aggressive, moderate or conservative
also affecting these three categories - will you place them in 5-point or 10-point increments? will you overlap them or not? Overlapping is more aggressive. If you don't overlap them, you will wait until the lower entry hits its target before you enter the next trade. A much more conservative (safe) approach.
Pivot Trades
I err on the side of caution
my Pivots: 24247, 24097, 24977
these are subject to change
feel free to pick your own pivots

NQ Power Range Report with FIB Ext - 9/18/2025 SessionCME_MINI:NQZ2025
- PR High: 24574.25
- PR Low: 24495.25
- NZ Spread: 176.5
Key scheduled economic events:
08:30 | Initial Jobless Claims
- Philadelphia Fed Manufacturing Index
Session Open Stats (As of 12:15 AM 9/18)
- Session Open ATR: 279.81
- Volume: 29K
- Open Int: 249K
- Trend Grade: Long
- From BA ATH: -0.0% (Rounded)
Key Levels (Rounded - Think of these as ranges)
- Long: 25217
- Mid: 22503
- Short: 21790
Keep in mind this is not speculation or a prediction. Only a report of the Power Range with Fib extensions for target hunting. Do your DD! You determine your risk tolerance. You are fully capable of making your own decisions.
BA: Back Adjusted
BuZ/BeZ: Bull Zone / Bear Zone
NZ: Neutral Zone

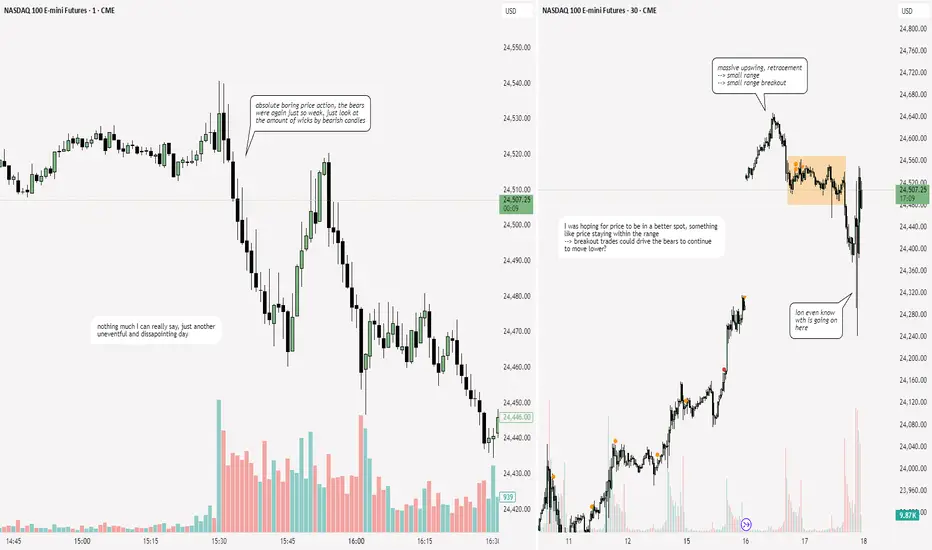
NQ: 254th trading session - recapp.e was canceled today so I was able to scalp, didn't really matter that much tho.
I might think about cutting these boring sessions out of my recaps, it is just not worth it to have
tradeless and boring sessions uploaded here...
Trading FOMC DayMost say do NOT trade FOMC day.
I trade it.
5m chart
Buy the Breakout
1.Above 13:50 high I buy 1 contract at each 10-point interval
2.29-point target for each and every entry
Buy the Dip
1.I buy the green shaded areas 31-point target
2.If a certain area bounces well, I keep trading it until it no longer works
Pivots
1.My pivots:24,307, 24,207, 24,147, 24,087, 24,027
2.101-point target for each entry
