Loss on modelSelling below the low was probably a mistake, once those REL's had been taken I should've been patient, lesson learnt.
Micro E-mini Nasdaq-100 Index Futures
No trades
Market insights

Monastic System live // LONG NQEntry: 25,215 → TP : 24,560 (+700 pts)
→ +74R to be filled
One setup. One plan. Zero noise.

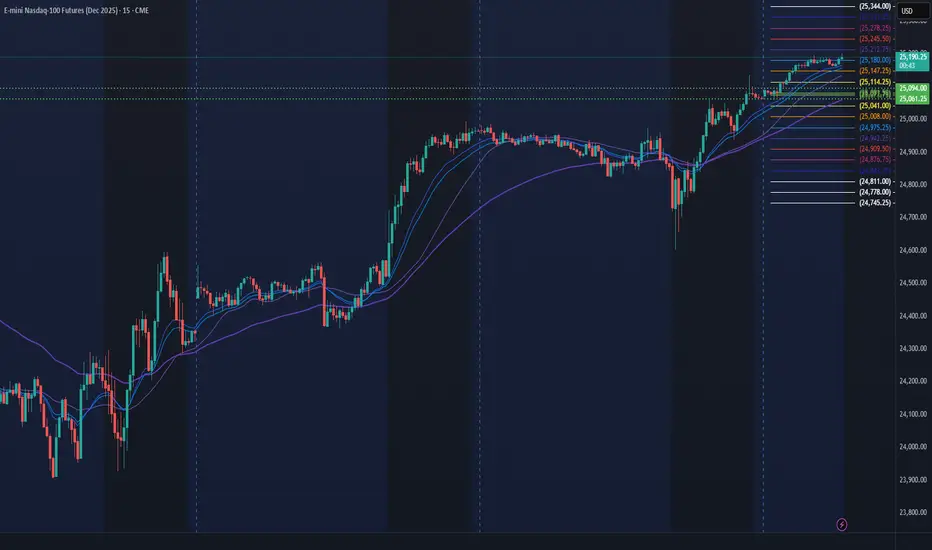
NQ Power Range Report with FIB Ext - 11/26/2025 SessionCME_MINI:NQZ2025
- PR High: 25094.00
- PR Low: 25061.25
- NZ Spread: 73.25
Key scheduled economic events:
08:30 | Durable Goods Orders
- GDP
- Initial Jobless Claims
10:00 | Core PCE Price Index (MoM|YoY)
- New Home Sales
Session Open Stats (As of 12:15 AM)
- Session Open ATR: 532.12
- Volume: 27K
- Open Int: 291K
- Trend Grade: Long
- From BA ATH: -4.6% (Rounded)
Key Levels (Rounded - Think of these as ranges)
- Long: 26636
- Mid: 25410
- Short: 23426
Keep in mind this is not speculation or a prediction. Only a report of the Power Range with Fib extensions for target hunting. Do your DD! You determine your risk tolerance. You are fully capable of making your own decisions.
BA: Back Adjusted
BuZ/BeZ: Bull Zone / Bear Zone
NZ: Neutral Zone
NQ - Week 48 updatedI added some levels that were not on the last chart.
T.A. is explained on the other chart.

NQ on Major Support Target 36,490Nasdaq 100 index is on major support since September. This is the area you want to buy and as it goes up take some profits if you want for a potential check back into support around early 2027 (green path).
There's the alternative scenario (orange path) that we just trend right up to 36,490 resistance and then have a major pullback to the long term trend. This one is less likely, but possible.
Either way if you sell some of your position (like shorter term options) in the middle of the range you're likely to be in a better position than holding the entire time as eventually that lower trend should get hit and that's a lot of time decay to ruin your positions.
Good luck!

NQ1 Sell ideaNasdaq has just entered a zone of interest, Point of Control in a heavy sell volume area. Going to wait for a bearish reversal confirmation candle, then enter targeting previous lows.

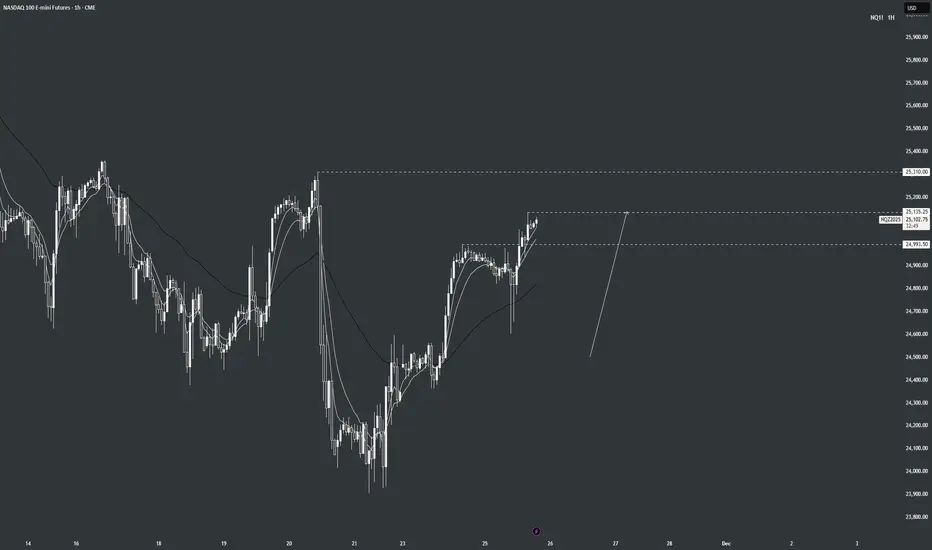
NQ Daily Outlook | November 25, 2025NQ had a very nice push higher NY session. Buyers in control early this week as the 1hr timeframe is pushing higher towards 25310.00!
Bias: Continue to push higher BULLISH
10K Account2000+% AROI.
1.Bedrock Support: 24625.
2.08:30 AM report: Core inflation cooled. This increases the chance of an interest rate cut at the Fed's next meeting, 12/10.
3.Historic Bull Market, pull back and bounce.
4.Prior day close: 24948.25
5.Strong Resistance: 25000
At 09:00 AM when you looked at the chart this is what you saw. The price was just below the prior day's close. You have a 10K account. What would you do? How would you trade this?
You need to play it safe. You want a very high probability win rate.
You have many options. The most obvious is to buy the bedrock support, 24625. Let's make this as easy as possible and say you bot 1MNQ @ 24625. Now what? You have the above 5 reasons in favor of this trade. The prior day's close will act as a price magnet therefore you should aim for that as your target.
It's not good to leave $ on the table, therefore you will trade a Ladder. Every 20 points or so you will sell that contract and immediately buy another.
With a bigger account you would buy 2 or more contracts @ 24625 and ladder those up decreasing the quantity as you get closer to your target.
Your author regrets he could not publish this before 09:00 AM for your benefit. He traded this as described above. Had you traded this with 1MNQ contract you would have made 2000 - 3000+% AROI.
This is part of our series on becoming one of the best Nasdaq-100 futures day traders on the planet.

5 trades 5 winsUsing my model again, a daily repeatable model with time and price confluences. I mixed up bullish and bearish a few times listening back ha.

MNQ SHORT TERM BUYS INTO SELLSI see MNQ opening with sells then buying up to the 88.6 zone and rejecting to continue downward

Pre open Heads Up. Index NSYECME_MINI:NQ1!
Looking for bearish prices on the Index triads for this NYO while the overall thought process is bullish on the HTF

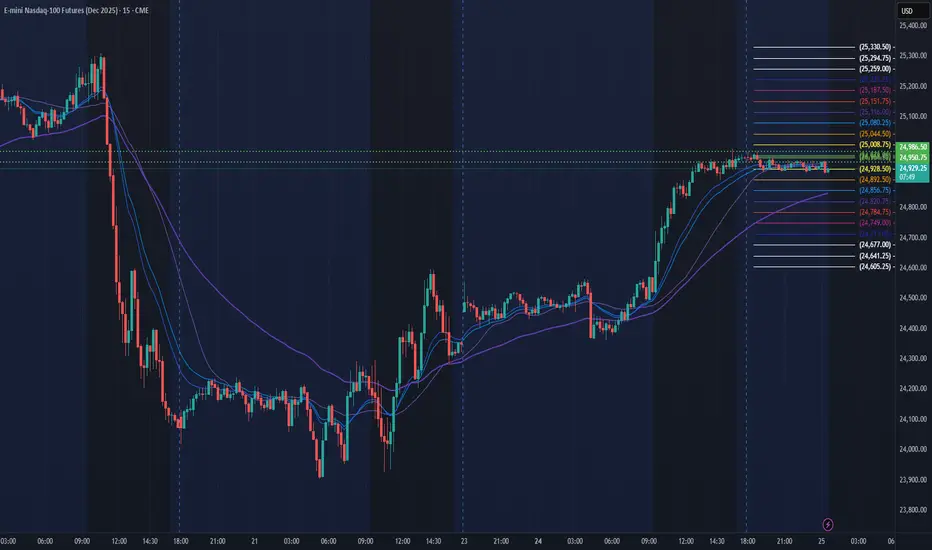
NQ Power Range Report with FIB Ext - 11/25/2025 SessionCME_MINI:NQZ2025
- PR High: 24986.50
- PR Low: 24950.75
- NZ Spread: 79.75
Key scheduled economic events:
08:30 | Retail Sales (Core|MoM)
- PPI
10:00 | CB Consumer Confidence
Session Open Stats (As of 12:25 AM)
- Session Open ATR: 529.65
- Volume: 28K
- Open Int: 296K
- Trend Grade: Long
- From BA ATH: -7.4% (Rounded)
Key Levels (Rounded - Think of these as ranges)
- Long: 26636
- Mid: 25410
- Short: 24039
Keep in mind this is not speculation or a prediction. Only a report of the Power Range with Fib extensions for target hunting. Do your DD! You determine your risk tolerance. You are fully capable of making your own decisions.
BA: Back Adjusted
BuZ/BeZ: Bull Zone / Bear Zone
NZ: Neutral Zone

Nasdaq 100, USD Index: Thanksgiving PerformanceToday I’m digging into my Excel data to see how the Nasdaq and the US Dollar Index performed across the three trading days either side of Thanksgiving.
Matt Simpson, Market Analyst at City Index.

Will December Rate Cut Save the Market?Is Rate Cut Probability up a Short-Term Bounce or continuation of the downtrends?

nq 15 min update Overall Idea
(Not financial advice)
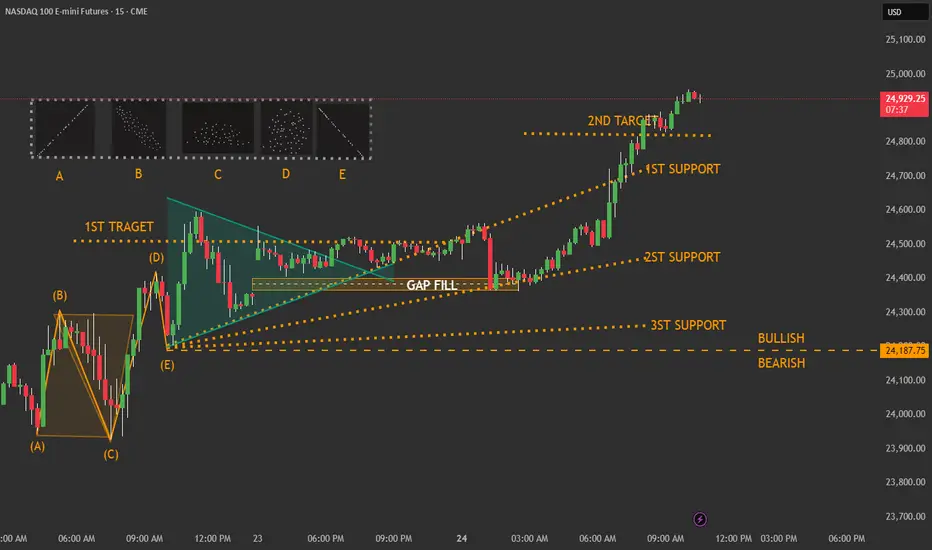
The chart shows a price pattern forming after a strong move upward and downward, followed by a consolidation phase. The diagram highlights targets, supports, and a gap fill area, helping determine bullish vs. bearish scenarios.
Wave Structure (A → E)
(Not financial advice)
On the left side, there's a labeled price swing (A–B–C–D–E).
This represents a sequence of higher-lows and lower-highs, ending at point (E).
Point (E) acts as the base from which the next structure begins.
Triangle Wedge Pattern
(Not financial advice)
Right after point (E), the market forms a tightening triangular structure
Upper descending line seller pressure
Lower ascending line buyer pressure
This pattern shows compression before a larger movement.
Gap Fill Area
(Not financial advice)
The GAP FILL zone inside the triangle marks an area where price previously skipped quickly.
Price often returns to such zones, creating
temporary support
or a magnet before continuation
Price Targets
(Not financial advice)
1ST TARGET
Primary upside objective if price breaks above the triangle.
2ND TARGET
A farther target indicating strong bullish expansion.
Support Levels
(Not financial advice)
1ST SUPPORT
Closest support maintains bullish structure.
2ND SUPPORT
A deeper structural support.
3ST SUPPORT
Strongest support and major turning point.
Bullish vs. Bearish Line
(Not financial advice)
The dashed horizontal line at the bottom marks the key boundary
Above → bullish
Below → bearish
NQ, Will History Really Repeat, or Is This a Trap?The chart lays out a familiar rhythm: expansion, consolidation, distribution, and the pullback into heavy demand. We’ve seen this movie before — literally. Prior cycles followed almost the same path, pausing at the same magnet zones and washing into the same liquidity pockets before the next leg.
But here’s the real question:
Is the market lining up for another classic reset, or is this where the fractal breaks?
We’re already seeing early echoes of previous cycles — the topping structure at 25,000, buyers getting tired at the highs, and price starting to drift into the same zones that produced powerful reversals in the past. Two 3-month FVGs sit directly underneath price, and historically, markets don’t just ignore imbalances this size. They come back to clean them up.
But the bigger picture isn’t identical. Index composition is heavier, liquidity conditions are different, and macro flows aren’t the same as 2020–2021. So while the structure rhymes, the environment doesn’t fully match.
Which forces the real tension here:
Does NQ repeat its old playbook and drift toward the 0.5 or even the 0.618…
or does the weight of new-cycle dynamics break the fractal entirely and push us somewhere new?
The market is sitting right at that inflection point.
Hold above the 0.382 → cycle repeat stays alive.
Lose 24,500 → market likely revisits the first FVG.
Reject 25,000 again → deeper rotation becomes the higher-probability path.
This week is where the fractal either confirms… or gets thrown out.


NQ Monday PlayToday the market presents a lot of stacked frameworks.
I'm working with Friday's range and want to see a Turtle Soup above it to get back into the range.
Invalidation point marked on the chart.

NQ Premarket UpdateES and RTY filled the Sunday gap, NQ didn't quite fill, left a 3.5 pt gap. So small, I'm not sure if it matters.
In any case though, MFI is quickly approaching overbought, so it'll probably go down Tues or Wed anyways.

NQ 25,155: Heavy-Volume Resistance + FVG Short SetupNQ is forming a strong resistance at 25,155, sitting at the start of a heavy-volume zone created during a sharp selloff. This is where sellers previously built short positions and are likely to defend again. A bearish Fair Value Gap aligns perfectly with the same level, strengthening the zone. A pullback into 25,155 offers a clean short opportunity.

Factors That Can Affect the Global Market1. Economic Indicators and Growth Rates
Economic performance is one of the biggest factors influencing the global market. Key indicators such as GDP growth, inflation, employment rates, and industrial output shape expectations about a country’s economic stability.
Strong economic growth increases foreign investment, boosts trade volumes, and encourages risk-taking in global markets.
Weak or negative growth leads to reduced consumer spending, falling demand for imports, and declining stock markets.
Inflation also plays a crucial role. High inflation reduces purchasing power and forces central banks to raise interest rates, slowing down economic activity. Conversely, low and stable inflation creates a favorable business environment.
2. Monetary Policy and Interest Rates
Central banks—such as the US Federal Reserve, European Central Bank, Reserve Bank of India, and Bank of Japan—heavily impact the global market through monetary policy decisions.
Interest rate hikes make borrowing expensive and strengthen the country’s currency. This can reduce stock prices, lower commodity demand, and slow global economic activity.
Interest rate cuts stimulate spending and investment, often pushing global markets upward.
When the US Federal Reserve changes interest rates, the effects ripple across the entire world because the US dollar is the dominant currency in global trade and investment.
3. Geopolitical Tensions and International Conflicts
Geopolitics is a major source of uncertainty in global markets. Conflicts such as US-China tensions, Middle East instability, or Russia-Ukraine conflict affect oil prices, supply chains, trade agreements, and investor confidence.
Wars and conflicts disrupt production and trade routes.
Sanctions limit access to markets and resources.
Political instability causes capital flight and currency devaluation.
Geopolitical risk is especially influential in the energy market, since oil and gas supplies are concentrated in politically sensitive regions.
4. Global Trade Policies and Agreements
Changes in trade relationships between nations strongly affect the global market. Trade agreements promote economic cooperation, while trade wars disrupt supply chains and increase costs.
Tariffs raise the price of goods, reducing demand and affecting corporate profits.
Free trade agreements (FTAs) encourage cross-border business and lead to market expansion.
Import/export restrictions can disrupt sectors that rely on global sourcing.
For example, restrictions in semiconductor exports can impact global electronics, automotive, and technology markets.
5. Technological Advancements and Innovation
Technology drives global market growth by improving efficiency, reducing production costs, and creating new industries. Major technological breakthroughs—such as AI, automation, blockchain, electric vehicles, and biotechnology—reshape sector dynamics worldwide.
Companies adopting new technologies gain competitive advantages.
Older industries may decline due to technological disruption.
Tech-heavy stock markets, like NASDAQ, influence global investor sentiment.
Digitalization has also globalized financial markets through faster trading platforms, online banking, and the growth of cryptocurrencies.
6. Currency Fluctuations and Exchange Rates
Foreign exchange (forex) markets play a pivotal role in global trade. Currency appreciation or depreciation affects international competitiveness.
A strong currency makes exports expensive and imports cheaper.
A weak currency boosts exports but increases the cost of imported goods.
For multinational companies, exchange rate volatility can significantly impact revenue and profitability. Investors also shift capital towards countries with stable or strengthening currencies.
7. Commodity Prices (Oil, Gold, Metals, Agriculture)
Commodity markets deeply influence global economic conditions. Key commodities include crude oil, natural gas, gold, silver, iron ore, wheat, and soybeans.
Oil prices affect transportation, manufacturing, and energy sectors worldwide. Rising oil prices increase inflation and production costs.
Gold prices act as a safe-haven indicator; during global uncertainty, investors buy gold, raising its price.
Agricultural commodities influence food prices and inflation.
Commodity exporters benefit from high prices, while import-dependent nations face economic pressure.
8. Supply Chain Disruptions
Global supply chains are highly interconnected. Events like pandemics, natural disasters, port congestion, and logistical shortages disrupt the flow of goods.
Disruptions lead to:
Higher transportation costs
Delays in production
Shortages of essential components
Increased inflation globally
The COVID-19 pandemic was a major example of how supply chain disruption can destabilize markets for years.
9. Corporate Performance and Market Sentiment
Global markets are influenced by the performance of major corporations. Earnings reports, product launches, mergers, and acquisitions impact investor sentiment and stock indices.
Positive earnings push markets upward.
Weak performance causes sell-offs.
Large multinational companies—like Apple, Amazon, Google, and Tesla—have global customer bases, so their performance influences markets worldwide.
10. Environmental Changes and Climate Risks
Climate change is increasingly shaping global markets. Extreme weather events—such as floods, droughts, and hurricanes—affect agriculture, energy supply, insurance costs, and infrastructure.
Renewable energy investments are rising.
High carbon-emission sectors face regulatory pressure.
Climate events disrupt commodity supply and productivity.
Global markets now price in climate risks as part of long-term investment decisions.
11. Global Health Crises and Pandemics
Health emergencies like pandemics create widespread market disruptions:
Industries like travel, tourism, aviation, and hospitality decline sharply.
Healthcare, pharmaceuticals, e-commerce, and technology see rapid growth.
Consumer behavior shifts dramatically.
The global impact of COVID-19 highlighted how health crises can slow economic growth and trigger global recessions.
12. Investor Psychology and Market Trends
Human behavior and sentiment also affect the global market. Fear, greed, and expectations drive short-term price movements.
Key psychological phenomena include:
Panic selling during crises
Speculative bubbles
Trends created by social media or news
Market sentiment often amplifies economic or geopolitical events.
Conclusion
The global market is influenced by a complex network of factors—economic performance, political stability, technological innovation, currency movements, natural disasters, and investor sentiment. Each factor interacts with others, creating a constantly shifting environment. Understanding these drivers helps traders, businesses, and policymakers anticipate global trends, manage risks, and make informed decisions. Whether it is a change in interest rates, a geopolitical conflict, or a supply chain disruption, every event sends waves across the global economy, shaping the future of world markets.

NQ 15 MIN Overall Idea
(Not financial advice)
The chart shows a price pattern forming after a strong move upward and downward, followed by a consolidation phase. The diagram highlights targets, supports, and a gap fill area, helping determine bullish vs. bearish scenarios.
Wave Structure (A → E)
(Not financial advice)
On the left side, there's a labeled price swing (A–B–C–D–E).
This represents a sequence of higher-lows and lower-highs, ending at point (E).
Point (E) acts as the base from which the next structure begins.
Triangle Wedge Pattern
(Not financial advice)
Right after point (E), the market forms a tightening triangular structure
Upper descending line seller pressure
Lower ascending line buyer pressure
This pattern shows compression before a larger movement.
Gap Fill Area
(Not financial advice)
The GAP FILL zone inside the triangle marks an area where price previously skipped quickly.
Price often returns to such zones, creating
temporary support
or a magnet before continuation
Price Targets
(Not financial advice)
1ST TARGET
Primary upside objective if price breaks above the triangle.
2ND TARGET
A farther target indicating strong bullish expansion.
Support Levels
(Not financial advice)
1ST SUPPORT
Closest support maintains bullish structure.
2ND SUPPORT
A deeper structural support.
3ST SUPPORT
Strongest support and major turning point.
Bullish vs. Bearish Line
(Not financial advice)
The dashed horizontal line at the bottom marks the key boundary
Above → bullish
Below → bearish
