NQ Range (10-20-25, Week 4)NAZ is traveling within the Churn Zone, looking for a Breakout. Favoring a lower move prior to an upside Breakout. Scalping Shorts to KL's until "all hell breaks loose". Lower CZ currently is providing U Turns with the BTD/FOMO's redirecting the NAZ. The O/N, Dead Zone Lifting while the Open Drive continues to sell off. We have seen double Pump/Dumps after any O/N drop or Open Drive sell off. Will update as we go.
Trade ideas

NQZ2025 Return to Wick 50% then liquidity purgeOn the 4h chart, I see price close above the 50% of a 4h Order Block and above a 1h gap. I think the market has a high probability of treating the gap as an inversion, that, with the confluence of DXY purging shorts and the weekly wick 50%.
Therefore, the next likely target is the liquidity resting above.

"Second verse, same as the first!"A throwback to 1965's Herman's Hermits "I'm Henery the Eighth, I am".
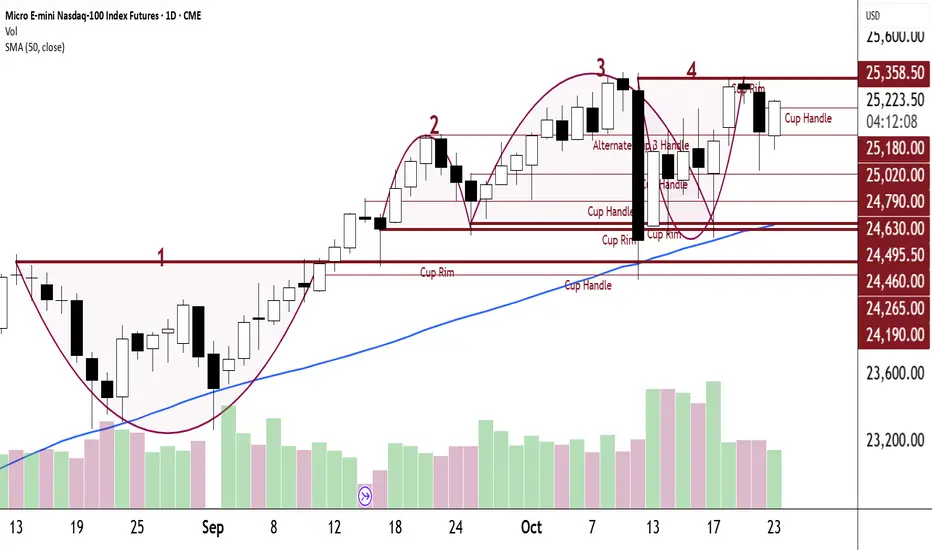
This is the same chart as yesterday's only using a Daily Chart. I want to emphasize the power of the market forces at work right now. I want you to see and feel the history being made. It is unfolding day upon day, week upon week and month upon month before our eyes and upon our charts.
Cup 1 is also a Daily double bottom, bouncing on the 50-day sma shortly after the 50 has crossed the 200-day sma. Not only that but it has two hammers bouncing on the 50 and a Bull Engulfing Candle and decent volume.
Cup 2, aka Monster Head & Shoulders, aka Ajax, which has been dominating our charts for some time, has two hammers on strong Support (aka "glorious" Hector's footing for defeating Ajax in a splendid battle). Don't miss the volume that came in on Friday, 9/26.
China's Temper Tantrum, Friday, 10/10, while big in size, cannot withstand The Fourth Industrial Revolution Bulls. Isn't it interesting that it is part of two cups - the bottom of Cup 3 and the top of Cup 4? Communist China cannot stop the forward march of Free Market Capitalism. Truth defeats Falsehood!
Indeed, we traders shall have a new dance floor, and our capital will have a new ballroom.
''...a barrow by the wide Hellespont.''"And some one shall one day say even of men that are yet to be,
as he saileth in his many-benched ship over the wine-dark sea:
'This is a barrow of a man that died in olden days, whom on a time
in the midst of his prowess the glorious Hector slew.' So shall some man say, and my glory shall never die."
As we knew from a prior post, Hector would win this rematch of an ancient duel on the Trojan plains. Hector, Prince of Troy, with his feet firmly set, appears to have slain Ajax - the human fortress, Ajax - the Monster Head & Shoulders.
Translation of Homer's Iliad attributed to T. Murray
Are we out of this Bloody Battlefield once and for all? I don't know. Many who know far more than I predict the markets will continue to chop and at some point, toward year's end and throughout 2026 will continue higher. There are others that see a looming recession.
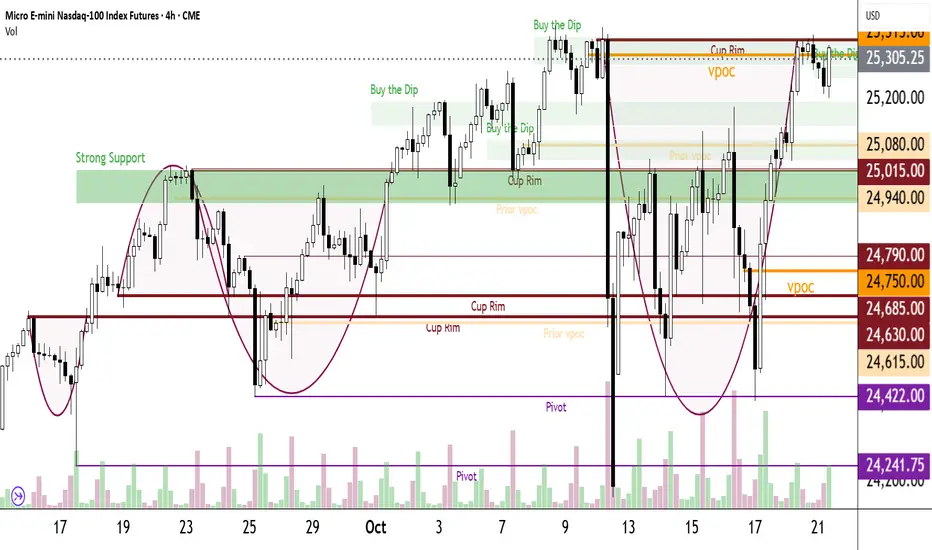
One thing we do know for sure - we can clearly see Support and Resistance, VPOCs and Prior VPOCs, Cups and their Handles and Buy the Dip areas.
And we have several trade plans that work in a bull market.
Our Strong Support for the time being has moved higher.
"...the glorious Hector" has a new plain upon which to firmly set his feet and do battle.
NQ 4HR POSSIBLE MOVE AND TARGETSUsing the last swing up and pull back the market is already inside the 50/60.2/70.5 area to push higher pass the BOS

Impulse Channelbrief Impulse Channel visual. showcased on the 15 minute timeframe via SEED_ALEXDRAYM_SHORTINTEREST2:NQ
NQ Short (10-27-25, Week 5)NAZ with O/N Gap open to lock in the Long chase and clean out the short stops. Regarding Friday short, I always go flat into the close. The O/N continues be used to lift it with ease. This may be blow off top day into balance of Friday - Monday Long Play. Netflix had the -10% move and has not recovered, NAZ is using the off session to Rig it up. Drop may not be until Tuesday, yellow arrow is range for retest should upper stall out. Current gap fill likely either way. Pump/Dump into Open, Gap up in O/N and expect some Tweets. When this stalls, look short. AP on Friday, voided by Gap.
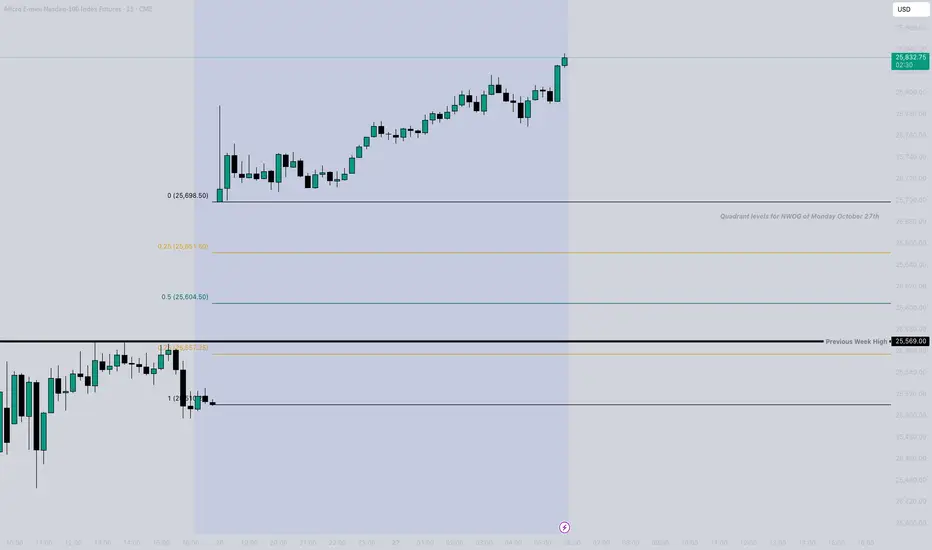
Monday October 27th New Week Opening Gap! Price created a huge gap this week that I will be shifting my attention to going into this weeks trading. I want to keep an eye for how price will likely use this NWOG with lots of medium and high impact news coming into this week as well. No news today so I won't be expecting anything extreme for a casual Monday trade but more focusing on what clues price can leave us that will give us a clear direction for the remainder of the week.
NASDAQ 100 (NQ1!): Wait For Valid Buys! #nasdaq Welcome back to the Weekly Forex Forecast for the week of Oct. 20-24th.
In this video, we will analyze the following FX market: NASDAQ (NQ1!) NAS100
The NASDAQ had ranged last week, but had a bullish end on Friday. I suspect we may see some continuation to the upside this week.
Wait for confirmation before taking valid buys setups.
I don't see a reason to look for sells. A bearish break of market structure would be a good reason.
Enjoy!
May profits be upon you.
Leave any questions or comments in the comment section.
I appreciate any feedback from my viewers!
Like and/or subscribe if you want more accurate analysis.
Thank you so much!
Disclaimer:
I do not provide personal investment advice and I am not a qualified licensed investment advisor.
All information found here, including any ideas, opinions, views, predictions, forecasts, commentaries, suggestions, expressed or implied herein, are for informational, entertainment or educational purposes only and should not be construed as personal investment advice. While the information provided is believed to be accurate, it may include errors or inaccuracies.
I will not and cannot be held liable for any actions you take as a result of anything you read here.
Conduct your own due diligence, or consult a licensed financial advisor or broker before making any and all investment decisions. Any investments, trades, speculations, or decisions made on the basis of any information found on this channel, expressed or implied herein, are committed at your own risk, financial or otherwise.

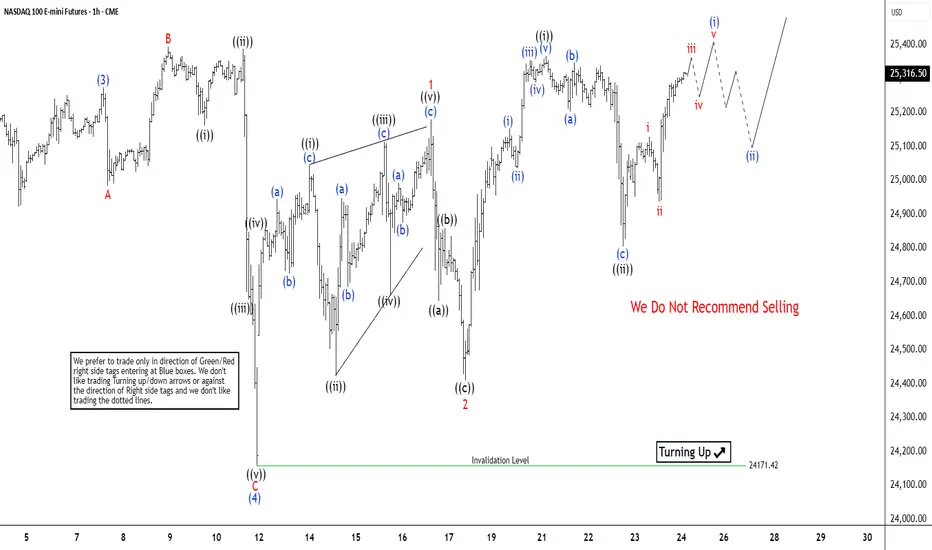
Nasdaq Futures (NQ) Targeting Wave (5) Upside Nasdaq Futures (NQ) advances steadily toward completing the cycle that originated at the April 7, 2025 low. The index targets a fresh all-time high. This rally develops as a textbook impulsive structure. Wave (3) culminated at 25,275. Wave (4) then corrected lower and finished at 24,166.26. The 1-hour chart captures this progression clearly.
The internal structure of wave (4) took the form of an expanded flat. Wave A ended at 24,984.75. The Index then rallied in Wave B to 25,394. Wave C completed the pattern with a decline to 24,166.26. Wave (5) now drives the index higher. From the wave (4) low, wave 1 rose to 25,179.5 and formed a leading diagonal. Wave 2 pulled back to 24,410. The advance then nested with wave ((i)) peaking at 25,368 and wave ((ii)) finding support at 24,804.75. This nesting confirms the underlying bullish trend.
Provided prices hold above 24,166.26, any near-term dip should attract buyers at the 3, 7, or 11 swing levels, aligning with structural support zones. Upside momentum remains intact. The minimum target extends from the October 21, 2025 high. An inverse Fibonacci retracement of 123.6% to 161.8% yields a range of 25,490 to 25,701, consistent with classic wave extensions.
AMP Futures - Volume Footprint charts table summary upgradeIn this idea we will demonstrate how to enable the new table summary feature for Volume footprint charts using Tradingview.

NC SellBased on volume analysis. Price extended to the high quickly and has created some buy imbalances near the high. Does not need room above because if it breaks the high, its invalidated based on the imbalance

NQ Week 43Updated levels for week 43
BS & FS levels are expected support when dashed lines, tested when dotted and resistance when solid lines.
The inverse is true for the Inv. BS Inv. FS levels, they are resistance as dashed lines, tested as dotted and support as solid lines.
Monthly timeframe is color pink
weekly grey
daily is red
4hr is orange
1hr is yellow
15min is blue
5min is green if they are shown.
strength favors the higher timeframe.
2x dotted levels are origin levels where trends have or will originate. When trends break, price will target the origin of the trend. its math, when the trend breaks, the vertex breaks too so the higher timeframe level/trend that breaks, the more volatility there could be as strength in the orders flow in to fuel the move.

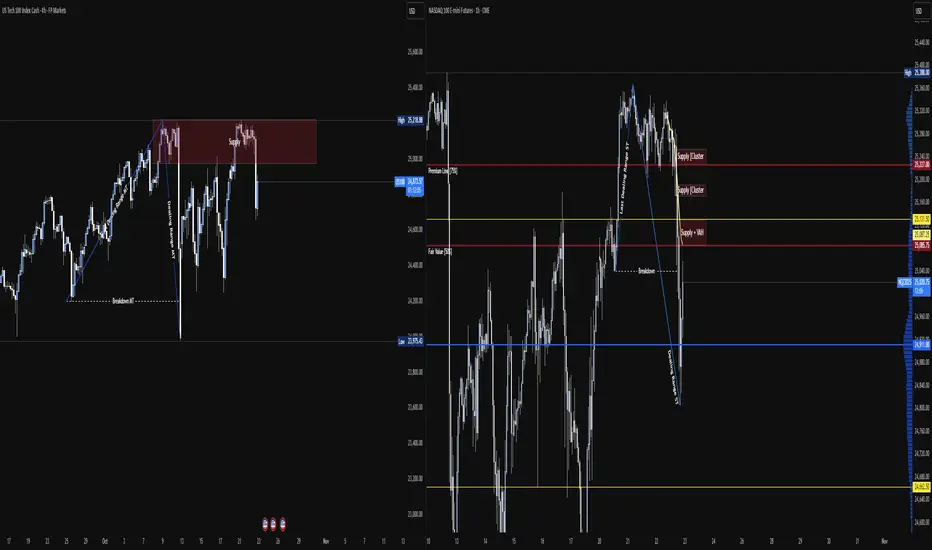
Bullish continuation for NASDAQ?
📊 CME_MINI:NQZ2025 Analysis – Oct 18, 2025
🧠 Market Context:
Price recovered back into Premium of range (the upper part of the current weekly range) after the drop to 24,158. Creating an inside week that managed to provide a Bullish close.
Inside Week consolidated in an 1H frame.
Price currently upper band (Premium) of 1H consolidation.
Trapped Sellers at discount of 1H range which happens to be previous week Opening
Gap High area.
Lack of US scheduled Red Folder news until Friday morning.
8:30am
📕 Core CPI m/m
📕 Weekly wick 50% at 25196
📕 CPI y/y
9:45am
📕 Flash Manufacturing PMI
📕 Flash Services PMI
Price referencing areas between 25,050–25,210. Premium of a weekly range.
🔼 There are several thing to note here:
🎯 Daily wick 50% at 25121.75
🎯 Weekly wick 50% at 25196
🎯 A Daily REQ Close and Open ( Origin of Weekly Short) at 25354.00
🎯 And REQ (Relative Equal) Highs and ATHs (All Time Highs) at 25394.00
Price can continue to explore Premium of weekly range using these as targets but keep in mind the potential for weakness and reversal formations along these levels.
High timeframe bias as well as structure still Bullish, keeping in mind that Price is currently within a Bearish Range (Friday October 10, 2025) Mondays PA and range might clarify wether Bias will remain Bullish, or if there will be any more signs of weakness and reversal formations.
🔻 There are several thing to note on the short side here:
🙁 Trapped Sellers ( Passive Liquidity) at discount of 1H Range and accumulation or Lower Band.
📉 Week Opening Gap (Reference partially) at discount of bigger range
📉 Weekly Low at 24410.00
📉 Previous Weekly Low at 24158.50
🧩 Context: Still questioning whether Fridays drop could be labeled as Price displacement and considered signal, or Rebalance. The difference will be noticed Mon-Tues.
Still uncertain on 💲 Dollar TVC:DXY Pending Bullish continuation confirmation or reversal back into chop.

Possible Idea If we see a retrace into tht breaker tonight to tmr and get a confirmation for shorts i'd aim for those EQL from last week

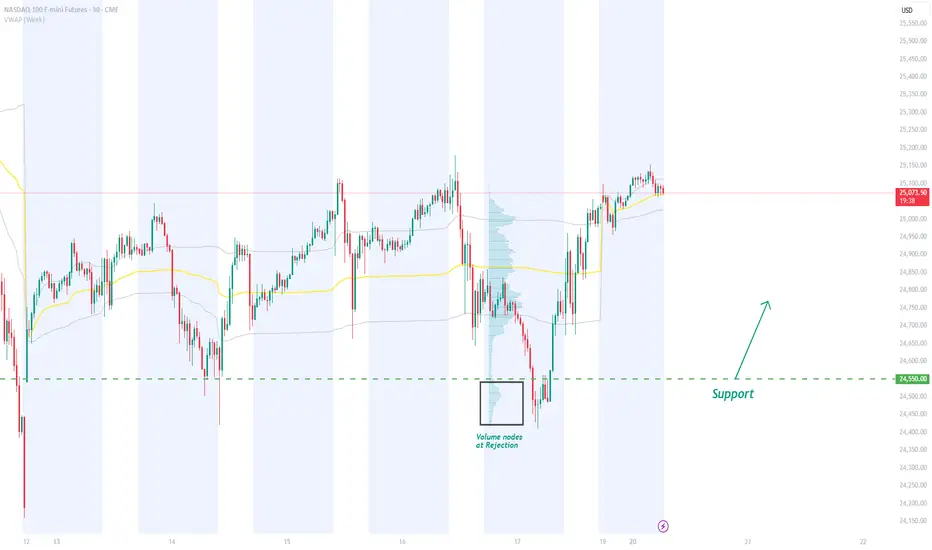
NQ Rejection Setup @ 24,550 | Strong Support Formed on D-ProfileThe NQ formed a D-shaped Volume Profile on Friday, signaling temporary balance between buyers and sellers. A strong rejection of lower prices created a significant volume cluster and a Fair Value Gap at 24,550. I’m watching for a pullback to this level for a potential long entry.
Bond Market Overview in Global TradingIntroduction
The global bond market is one of the largest and most influential components of the financial system, often considered the backbone of global capital markets. Bonds—also known as fixed-income securities—represent loans made by investors to borrowers, typically governments, municipalities, or corporations. In return, the borrower agrees to make periodic interest payments (coupons) and repay the principal at maturity.
With a total value exceeding $130 trillion globally, the bond market surpasses the global equity market in size. It serves as a vital mechanism for governments to finance deficits, corporations to raise capital, and investors to achieve stable income streams. In global trading, bonds play a key role in portfolio diversification, interest rate management, and economic stability.
1. The Structure of the Global Bond Market
The bond market can be broadly divided into sovereign bonds, corporate bonds, and municipal or supranational bonds. These segments cater to different types of issuers and investors:
1.1 Sovereign Bonds
Sovereign bonds are issued by national governments to fund public spending, infrastructure projects, and fiscal deficits. Examples include U.S. Treasuries, UK Gilts, German Bunds, and Japanese Government Bonds (JGBs).
They are considered the safest instruments in their respective countries, especially when denominated in a nation’s own currency. The U.S. Treasury market is the largest and most liquid, serving as a global benchmark for interest rates and risk-free returns.
1.2 Corporate Bonds
Corporations issue bonds to finance operations, mergers, or expansion without diluting ownership through equity issuance. Corporate bonds typically carry higher yields than government bonds due to increased credit risk. They are classified as:
Investment Grade Bonds: Issued by companies with strong credit ratings (e.g., Apple, Microsoft, Nestlé).
High-Yield or Junk Bonds: Issued by companies with lower credit ratings, offering higher returns to compensate for default risk.
1.3 Municipal and Supranational Bonds
Municipal bonds (or “munis”) are issued by states or local governments, primarily in the U.S., to finance public infrastructure like schools, hospitals, or transportation systems.
Supranational organizations—such as the World Bank, IMF, or Asian Development Bank—also issue bonds to support global development initiatives. These bonds are typically low-risk due to strong institutional backing.
2. How the Bond Market Works
2.1 Primary Market
The primary market involves the initial issuance of bonds. Governments issue bonds via auctions, while corporations issue through underwriters in public or private placements. The primary market provides direct funding to issuers.
2.2 Secondary Market
Once issued, bonds trade in the secondary market, where investors buy and sell existing bonds. Prices fluctuate due to changes in interest rates, inflation, credit ratings, and market sentiment.
Major secondary markets include the U.S. Treasury market, the London bond market, and electronic platforms like Tradeweb and MarketAxess. Liquidity in these markets ensures that investors can easily adjust portfolios and manage risks.
3. Key Features and Metrics
Understanding the global bond market requires familiarity with core concepts:
3.1 Coupon Rate
The coupon rate is the fixed or floating interest rate paid by the bond issuer to the bondholder. For instance, a 5% coupon bond with a $1,000 face value pays $50 annually.
3.2 Yield
Bond yield reflects the effective return an investor earns. It varies inversely with bond prices—when interest rates rise, bond prices fall, and yields increase. Common types include:
Current Yield
Yield to Maturity (YTM)
Yield Spread (difference between yields of two bonds)
3.3 Duration and Convexity
Duration measures a bond’s sensitivity to interest rate changes. Longer-duration bonds experience greater price volatility. Convexity refines this measure, accounting for nonlinear changes in prices relative to yields.
3.4 Credit Rating
Credit rating agencies—such as Moody’s, S&P Global, and Fitch—assess the creditworthiness of issuers. Ratings range from AAA (highest quality) to D (default), guiding investors on risk levels.
4. Participants in the Global Bond Market
The bond market brings together a diverse set of participants:
Governments: Issuing debt to fund national spending or manage monetary policy.
Corporations: Raising long-term capital for expansion.
Institutional Investors: Pension funds, insurance companies, and sovereign wealth funds seeking stable returns.
Central Banks: Managing monetary policy by buying or selling bonds (quantitative easing or tightening).
Retail Investors: Accessing bonds through ETFs or mutual funds.
In global trading, institutional investors dominate due to the market’s scale and complexity, though retail participation has grown with digital bond platforms.
5. Global Bond Market Instruments
The diversity of instruments reflects varying risk appetites and investment horizons:
5.1 Fixed-Rate Bonds
These bonds pay a constant coupon over their lifetime. They offer predictability, making them popular among conservative investors.
5.2 Floating-Rate Notes (FRNs)
Coupon payments adjust based on a benchmark rate (e.g., LIBOR, SOFR). FRNs protect investors from rising interest rates.
5.3 Zero-Coupon Bonds
Issued at a discount, these bonds pay no periodic interest but return the face value at maturity. They appeal to long-term investors seeking capital appreciation.
5.4 Inflation-Linked Bonds
Examples include U.S. TIPS and UK Index-Linked Gilts, which adjust coupon and principal payments for inflation, preserving real returns.
5.5 Convertible Bonds
Hybrid securities allowing investors to convert bonds into equity under certain conditions. These offer growth potential alongside fixed-income stability.
5.6 Green and Sustainable Bonds
These fund environmentally friendly or socially responsible projects. The green bond market has surged past $2 trillion, reflecting global ESG investment trends.
6. Importance of Bonds in Global Trading
Bonds serve several crucial functions in international finance:
6.1 Capital Formation
They enable governments and corporations to raise large amounts of capital efficiently.
6.2 Benchmark for Interest Rates
Sovereign bonds—especially U.S. Treasuries—serve as global benchmarks for interest rates, influencing mortgage rates, corporate debt costs, and derivatives pricing.
6.3 Portfolio Diversification
Bonds typically have low correlation with equities, reducing overall portfolio volatility.
6.4 Safe Haven Investment
During economic uncertainty, investors flock to high-grade government bonds, particularly U.S. Treasuries, as a refuge from market turbulence.
6.5 Monetary Policy Tool
Central banks use bond markets to influence liquidity and interest rates. For example, through open market operations or quantitative easing (QE).
7. Factors Influencing Bond Prices and Yields
Bond performance depends on macroeconomic and market dynamics:
7.1 Interest Rates
The most critical factor—bond prices move inversely to interest rates. When central banks raise rates to combat inflation, existing bond prices fall.
7.2 Inflation
Higher inflation erodes the purchasing power of fixed returns, reducing bond attractiveness unless yields rise accordingly.
7.3 Credit Risk
Downgrades in an issuer’s credit rating or default concerns can cause sharp price declines, especially in corporate or emerging market bonds.
7.4 Currency Movements
Global investors face exchange rate risk when investing in foreign bonds. A weaker local currency can erode returns.
7.5 Economic and Political Stability
Geopolitical tensions, wars, or policy uncertainty often drive investors toward stable, developed-market bonds.
8. Major Global Bond Markets
8.1 United States
The U.S. bond market, led by Treasury securities, is the most liquid and widely traded globally. Corporate bond trading is also highly active, supported by transparent regulations and deep investor demand.
8.2 Europe
The Eurozone bond market includes government bonds from Germany, France, and Italy, as well as Eurobonds—international bonds denominated in euros but issued outside the Eurozone.
8.3 Asia-Pacific
Japan, China, and India have growing bond markets. Japan’s low-yield JGBs influence global interest rate dynamics, while China’s bond market—now the world’s second largest—has opened to foreign investors via programs like Bond Connect.
8.4 Emerging Markets
Countries like Brazil, Mexico, Indonesia, and South Africa issue sovereign and corporate bonds that offer higher yields but carry elevated currency and credit risks.
9. Technological and Regulatory Developments
9.1 Digital Bond Trading
Technological platforms have transformed bond trading from traditional over-the-counter (OTC) methods to electronic trading networks. Platforms such as Bloomberg, MarketAxess, and Tradeweb enhance transparency, liquidity, and efficiency.
9.2 Blockchain and Tokenization
Blockchain technology allows tokenized bonds—digital representations of bond ownership on secure ledgers. These innovations promise faster settlement, lower costs, and greater accessibility.
9.3 ESG and Sustainable Finance Regulations
Regulatory bodies in the EU and other regions are promoting green disclosure frameworks, ensuring transparency in ESG-linked bonds.
9.4 Monetary and Fiscal Coordination
Global bond markets increasingly reflect coordinated central bank actions, as seen during COVID-19 stimulus efforts and post-pandemic tightening cycles.
10. Challenges and Risks
Despite its stability, the bond market faces key challenges:
Rising Interest Rates: As central banks tighten monetary policy, bond prices decline, causing capital losses.
Sovereign Debt Crises: Excessive government borrowing (e.g., Greece 2010, Argentina 2018) can trigger market shocks.
Liquidity Risk: In less developed or high-yield markets, bonds may be hard to sell quickly.
Currency Volatility: Cross-border investors face exchange rate fluctuations that impact returns.
Climate Risk: Environmental disasters and transition risks can affect bond valuations, especially for sectors with high carbon exposure.
11. The Future of the Global Bond Market
The future trajectory of the global bond market will be shaped by technological innovation, sustainable finance, and monetary policy evolution.
Digital Bonds and tokenized securities are expected to revolutionize issuance and settlement.
Green and social bonds will continue expanding, aligning finance with climate goals.
Artificial intelligence and data analytics will enhance credit risk assessment and trading strategies.
Interest rate cycles post-2025 will redefine global yield curves as inflation stabilizes.
Furthermore, greater participation from retail investors and emerging economies will democratize bond investing, creating a more balanced and inclusive market.
Conclusion
The global bond market is an intricate, dynamic, and essential part of the international financial system. It serves as a source of funding for governments and corporations, a tool for investors to earn stable income, and a mechanism for central banks to execute monetary policy.
In an era of technological transformation and shifting geopolitical landscapes, the bond market’s role remains indispensable in balancing risk, facilitating investment, and promoting economic growth worldwide. As sustainability, innovation, and global integration advance, bonds will continue to anchor financial stability and serve as a foundation for responsible global trading.
NASDAQ 100 - US100 // Short Setup Macro Overview
After the daily structure break, the market retraced into the origin supply zone, confirming the redistribution phase.
Today, price re-entered the macro Value Area and is now approaching the VAH, where institutional activity may lead to a new redistribution cycle toward the lower value edge (VAL).
The medium-term bias remains bearish — the short-term structure has realigned with it.
Context Summary
– Daily: confirmed bearish structure after origin breakdown.
– Re-entry into macro VA after short-term extension.
– VAH at 25,130–25,227 aligns with supply + negative delta clusters.
– Fibonacci 0.75 level (25,228.50) marks the center of premium liquidity.
– Bias remains short below VAH.
Execution Plan
Bias: Short
Entry Zone: 25,087.50 → 25,228.50 (Supply + VAH + 0.75 Fib)
Stop Loss: 25,370
TP1: 24,800.00
TP2: 24,650.50 (VAL)
Trigger: Redistribution on negative delta cluster near VAH.
SELL ON NQJust happened to find this setup and wanted to share. Really small SL for reward potential. SL does not need any room. If it goes above the high, the short idea is gone

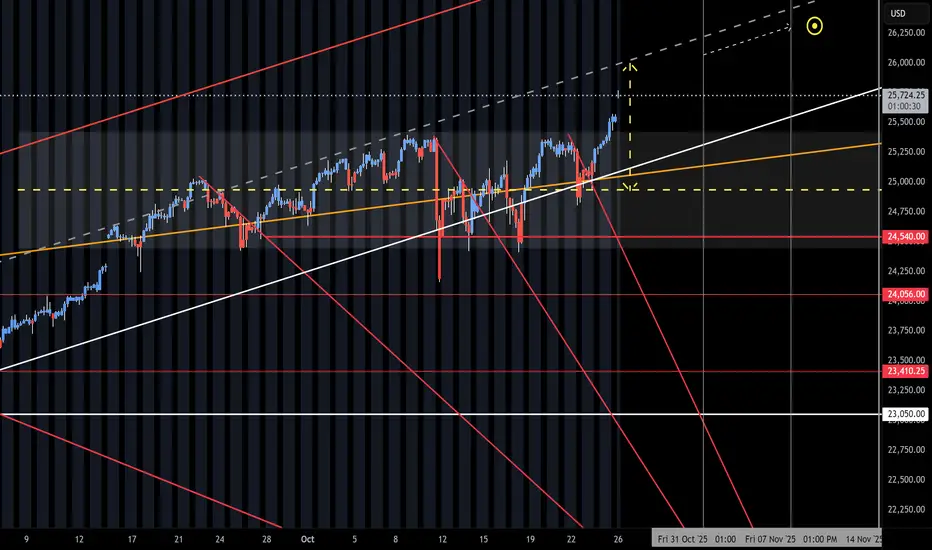
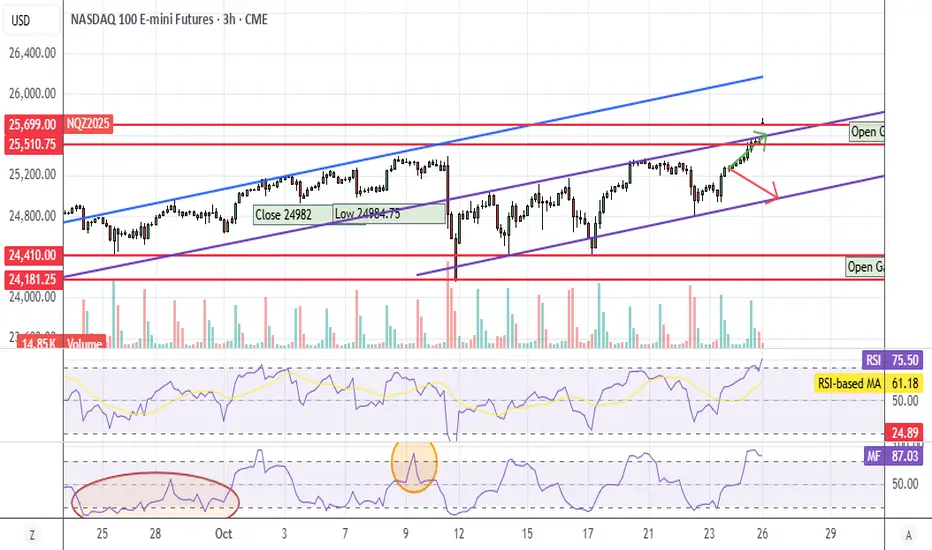
NQ UpdateGap up on trade news, actually regained the previous channel which is why it exceeded my target. I projected a melt up this week, that's all I can say.
MFI and RSI overbought but doesn't matter in a melt up. I think the market will go down and fill the gap but not until next week.
HEY NAZ, WHATS NEWS GONNA MAKE YOU DO?! NAZ Bias-Bearish(personally) HOWEVER-----
Let price show us the way. I believe that price will be looking for key levels to bounce around on before making its true climb or decline. The reason I am bearish this week is the belief that negative news is coming and a lack of pullbacks on daily/HTF charts. So sauce.... Im looking for price to come down and hit a fibs retracement at this FVG for a
GOOD BUY bounce! Around 25,428-25,394! First, setup; after that, the IPP (important price point) to look at will be how price interacts with 25,509-25,491. If it doesn't break above on a higher time frame, I believe we push LL to hit BIG FVG 25,214!! which i really want to buy from there but if it breaks above we can see a strong retest of SOB and HH's! Either way, WE GET PAID! Sitting on my hands until the price shows me where we're riding! GDluckThisWeek and happy hunting!

NQ Shorts IncomingYM approaching 4H imbalance, ES could sweep asian session high and play into previous OB while NQ sweeps london session liq and mitigates asian session OB

AMP Futures - Continue your last replay seamlessly.In this idea we will demonstrate how to use the new saved bar replay feature using TradingView.
