NQ 01.09.25Looking for a bullish day today, targeting previous weekly opening price. I'm currently looking at Previous H6 Open (00:00) to look for longs to Asia Highs
NQ2! trade ideas

E mini Nasdaq 100. Weekly Outlook. September 01, 2025CME_MINI:NQ1!
Expecting all out meltdown on Nasdaq. And the other two indexes. August was insane. But September will be extremely volatile

IVFG NQ LONGbullish bias here going into Asia / Tokyo session, Looking At the 15m and 5m FVG to get into a long position, slight EMA Bias NQ & ES keep ranging above the 15m 200ema, Predicting it respects the $23,843.00 price range and uses that as the draw to buy side liquidity (BSL)

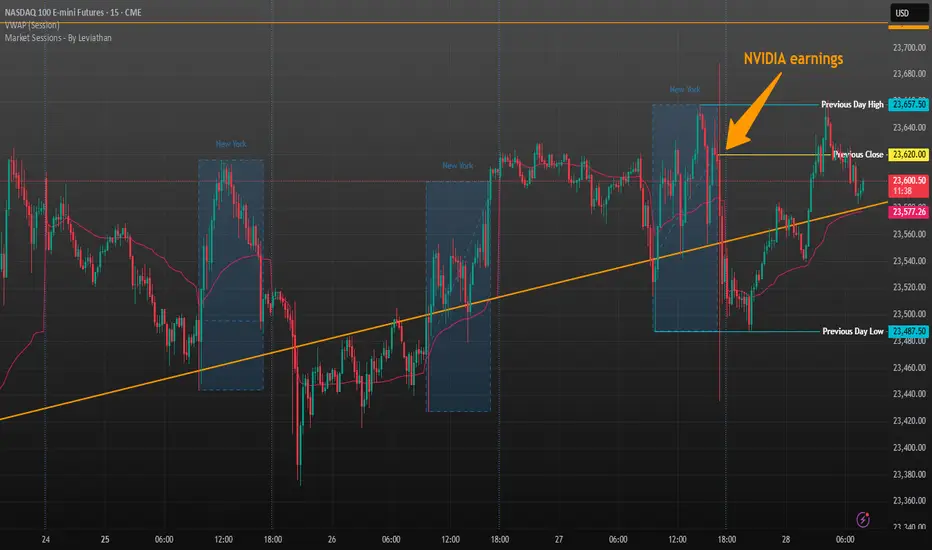
NQ - August 29, 2025 - Before the openYesterday after the close was NVIDIA earnings. Overall they were decent but the market didn't seem impressed. NVIDIA dipped a bit after the report.
Nasdaq still battling the long-term trend line as seen in the chart above.
Overnight it seems the dip was bought back. So far the theme seems to remain to buy the dip on Nasdaq and I believe it will remain this way until we get some inflation (PCE this Friday) & employment (NFP next Friday) numbers.
Good trading!
28 August 2025There were few very clean setups. However, 9:30 open was very volatile.
Setup: Inversions FVG
New: unemployment

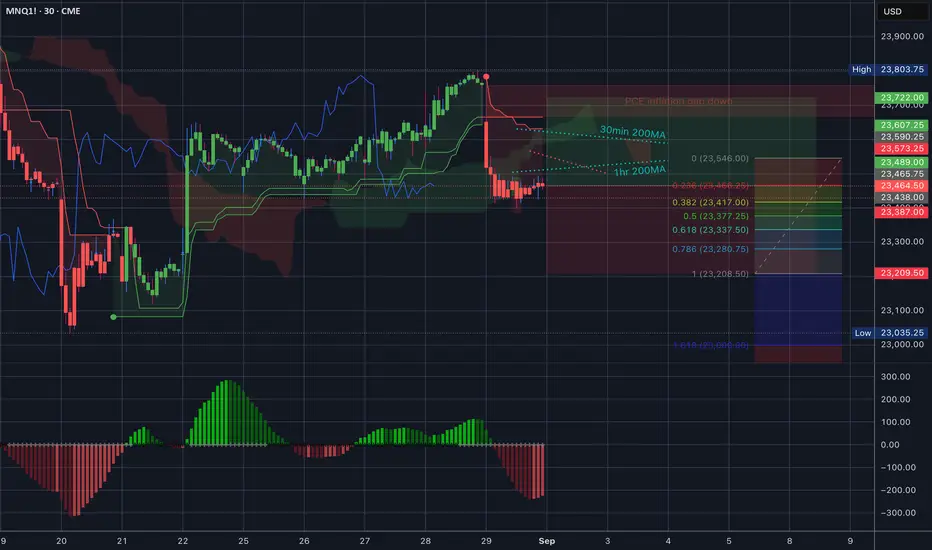
$NQ_F $MNQ_F Trading Range for 9.2.25
Ok, so we are heading into tomorrow after the three day weekend a little bearish. Friday every candle printed red and the 35EMA is above us facing down so definitely look to that as resistance.
Nasdaq is more bearish than S&P, that 30min 200MA has already turned down so DEFINITELY note that level.
Volatility map on the right for tomorrow’s range. Let’s go, y’all. I have officially been converted into a futures trader so new regular ticker right here.
NQ structure break down / bullish structure 4h time frame break down on NQ, respecting higher lows on the 4h signaling potential move towards all time high.
on the opposite bearish scenario, a 4h full body candle closing bellow 23,400 can signal a new lower low signaling a downtrend .
thank you for watching , let me know your thoughts

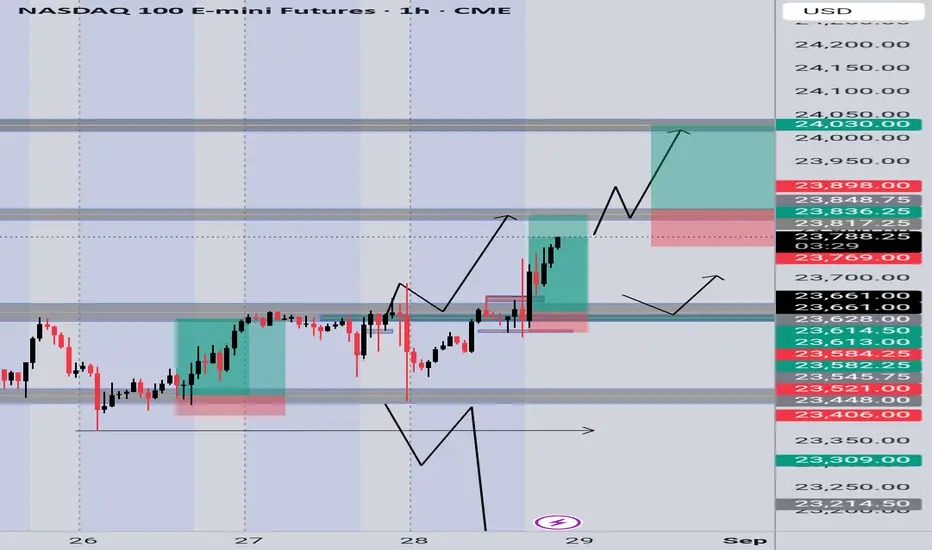
NASDAQ100 Update✅ Congratulations to everyone who caught the resistance breakout 🎉 – that level has now flipped into support 🔄.
📌 My plan:
Looking to buy more on continuation if we break higher 🔼
Or wait for a retest back to support to load more longs 💹
Bias remains bullish as long as support holds
NQ: 241st trading session - recapShould've definitely waited for the better setup. I ended up with +$0 because I scaled down after my inital loss.
Overall the trade was in the A tier, nothing perfect but it was alright

Nq & Es After hours comment 27-08-2028 Good evening everyone,
As you can clearly see, the target has been achieved exactly as anticipated. Price dipped slightly, then provided solid long opportunities, and afterward rallied strongly to the upside.
See you all tomorrow here, shortly before the market open, for the daily outlook.
Wishing you a good evening.
⚠️ Disclaimer: This analysis reflects personal market observations and is for educational purposes only. It does not constitute financial advice.

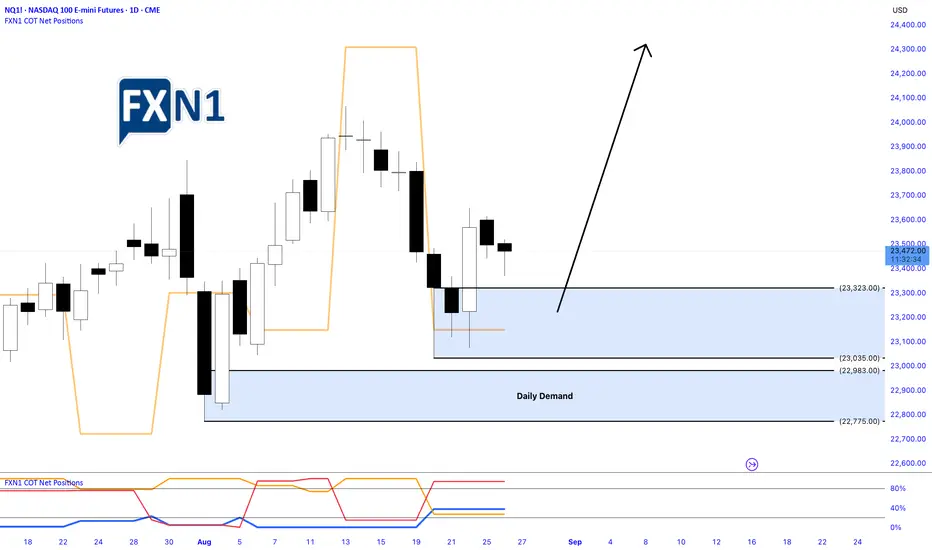
Nasdaq Pulls Back After Friday’s Rally: Identifying Demand ZoneYesterday, the Nasdaq underwent a pullback following a robust bullish surge on Friday. During this correction, a fresh Daily Demand Zone emerged on the chart, signaling potential support levels. Traders are now eyeing this area as an opportunity to position for a possible new high, should the market retrace further today. The current outlook favors a long setup, with anticipation of a continued upward move contingent on the price respecting the identified demand zone.
✅ Please share your thoughts about NQ1! in the comments section below and HIT LIKE if you appreciate my analysis. Don't forget to FOLLOW ME; you will help us a lot with this small contribution.

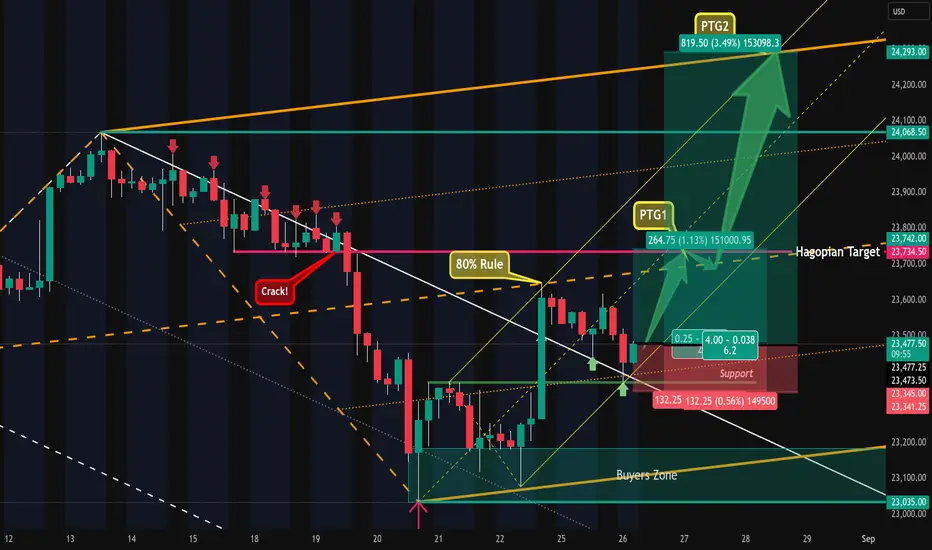
Nasdaq - Intraday Setup & Potential TradePrice was not abel to trade out of the white forks U-MLH and got constantly rejected.
It cracked the little support and fell down, but missed the white Centerline, creating a HAGOPIAN.
Then price traded outside of the white fork, following a textbook test/retest at the white U-MLH and found support.
The yellow fork points upwards, showing us the most probable path of price.
Going long near the white U-MLH gives us several potential targets:
1. the orange Centerline
2 the yellow Centerline
3. the HAGOPIAN target line.
4. the orange U-MLH
Stops would be below the last red bars low, because this, as of the time of writing, is the best structural level to hide behind.
I'm off to the mountains, have a happy trading day!
NASDAQ 100: Bullish, But There Is a Headwind.....Welcome back to the Weekly Forex Forecast for the week of Aug 25 - 29th.
In this video, we will analyze the following FX market: NASDAQ (NQ1!) NAS100
The NASDAQ has a bearish FVG on the Daily TF. Should it fail, buy the pullback to it, as it will invert to a iFVG and support higher prices.
Should it fail, and we will know Monday/Tuesday, sells become valid, down to the Weekly bullish FVG.
Let the market unfold Monday, then look for valid entries.
Enjoy!
May profits be upon you.
Leave any questions or comments in the comment section.
I appreciate any feedback from my viewers!
Like and/or subscribe if you want more accurate analysis.
Thank you so much!
Disclaimer:
I do not provide personal investment advice and I am not a qualified licensed investment advisor.
All information found here, including any ideas, opinions, views, predictions, forecasts, commentaries, suggestions, expressed or implied herein, are for informational, entertainment or educational purposes only and should not be construed as personal investment advice. While the information provided is believed to be accurate, it may include errors or inaccuracies.
I will not and cannot be held liable for any actions you take as a result of anything you read here.
Conduct your own due diligence, or consult a licensed financial advisor or broker before making any and all investment decisions. Any investments, trades, speculations, or decisions made on the basis of any information found on this channel, expressed or implied herein, are committed at your own risk, financial or otherwise.

NQ Short (08-18-25)Friday did not lift and the O/N is at low, look for anu reg session selling to gain some strength under the DZ. Looking for 400 point range this week and break lower can move 1,000 points under the DZ. Expect Tricks/Tweets (damage spin) and more Tweets early this week. Low volume buying should turn into high volume selling. Washington Street Asset Management will have its work cut out over the next month or so and may be why we got propped up.

Nq & Es After hours comment 25-08-2025Good evening everyone,
As you noticed, price did not reach the lower levels we were anticipating, and therefore no valid long opportunities were triggered. This was always a possible outcome, and it simply means that we missed a trade — something that is part of everyday trading.
I had mentioned that I was expecting a temporary move down, but at no point did I suggest looking for short opportunities. The reason is exactly what we saw today: price did not need to drop significantly before moving higher.
For tomorrow, there is still a chance of a temporary decline before the market continues to push upward.
See you here again tomorrow, before the market open.
⚠️ Disclaimer: This analysis reflects personal market observations and is for educational purposes only. It does not constitute financial advice.

#202534 - priceactiontds - weekly update - nasdaq futures Good Day and I hope you are well.
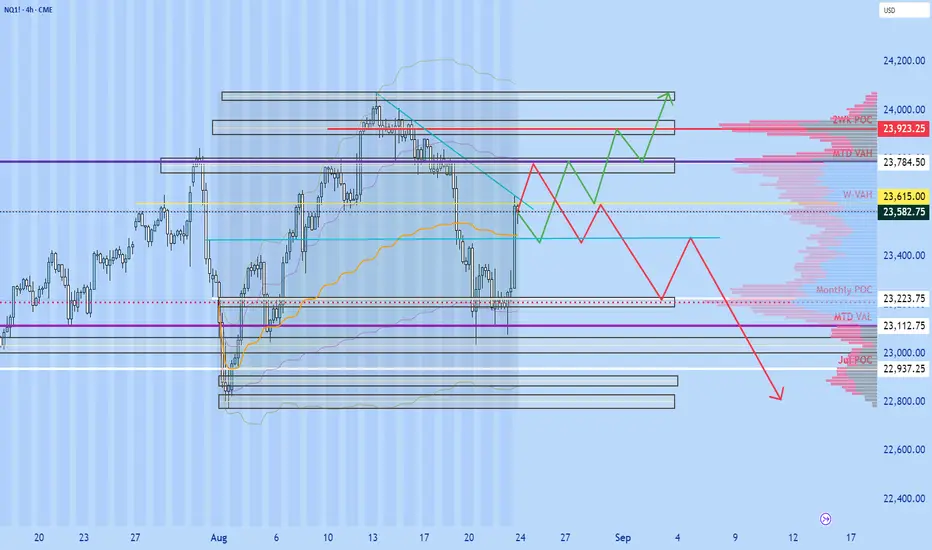
comment: Market stayed around the 50% retracement from the prior 2 weeks selling. Bears need to miracle to keep it below 23600 and go down again. Bulls want the measured move up which could lead to 24200 or more. We are in the middle of the range and I need strong momentum on Monday to join either side.
current market cycle: bull trend - peak bubble
key levels for next week: 22800 - 24100
bull case: Bulls want a new ath but I doubt they will get it without a better pullback. The move on Friday was strong enough to expect at least a second leg. Otherwise I am having a hard time finding arguments for the bulls. They printed a higher low, which still confirms the bull trend and bulls can argue it’s a two-legged pullback on the daily chart. Confirmation is only above 23600 and if so, I’d expect a quick move to 23800.
Invalidation is below 23400ish
bear case: Bears can argue the red bear trend line is still valid (see chart) and that we retraced about 50% of the two-week selling. If they can stay below 23600, small chance that we reverse and continue down to 23000 and make lower lows again. For now bears are not favored and around 23500 it’s best to do nothing.
Invalidation is above 23600
short term: Neutral around 23500. Can’t get much more out of the chart right now.
medium-long term - Update from 2024-08-10: 22000 likely to get hit this year gain. 20000 seems a bit much for 3 months left.
NASDAQ BULLISH4hr bull flag/golden pocket let’s see when it breaks out but def lookin for upside only

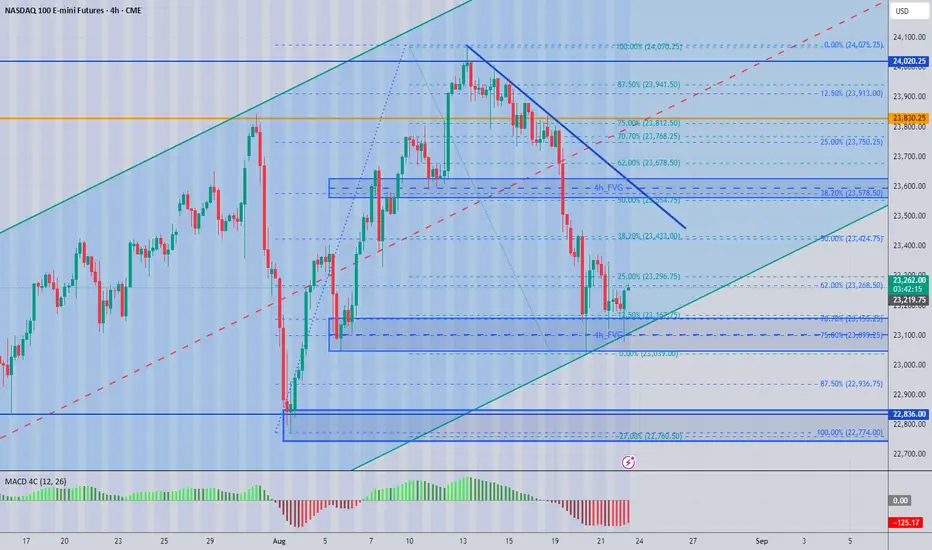
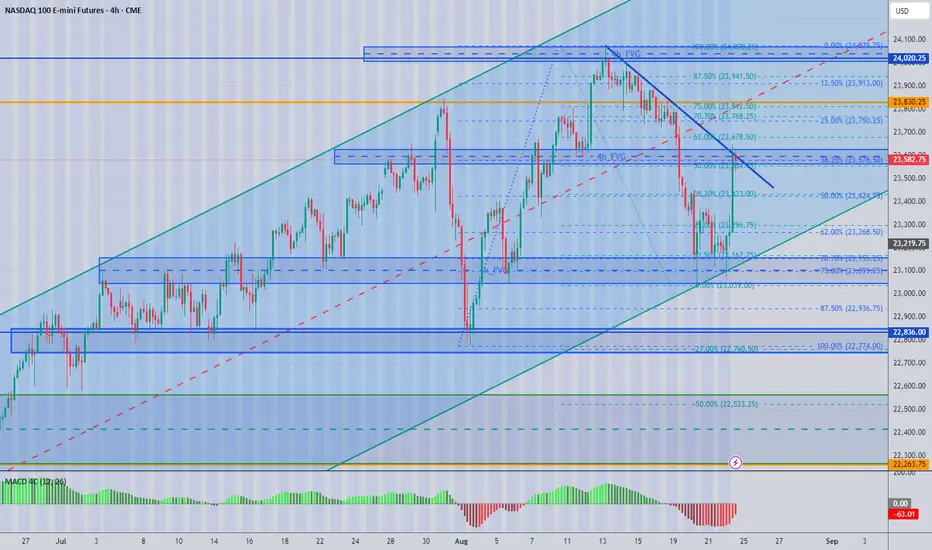
Re publishing the chart i published Friday - What do you noticeWhat is the standout feature of this chart I have extended the boxes to show you how areas of support and resistance interact in the market place.
The 4 hour chart is a great chart for evaluating positions.
1. Use this at setting bias and levels for breaks.
2. Then you can drill down into lower timeframe charts to identify potential position entries.
3. I would repeat the process of mapping out these lower time frame charts to identify entry levels
4. When you in your trading time frame, i use 1, 2, and 5 minute time frames, others use range bars or renko etc , these are allow personal preferences but the mapping process will remain the same.
5. I always use MACD to analyse strength of move and look for divergence.
6.I always measure an impulse higher or lower with the Fibonacci retracement tool. This will show you retracement values and set target levels.
7. I love the two moving averages 144 and 169 period.
8. Candle patterns help in determining market structure and order flow if you know what to look for.
I hope this all helps you any questions i am happy to answer them
good luck
Mark
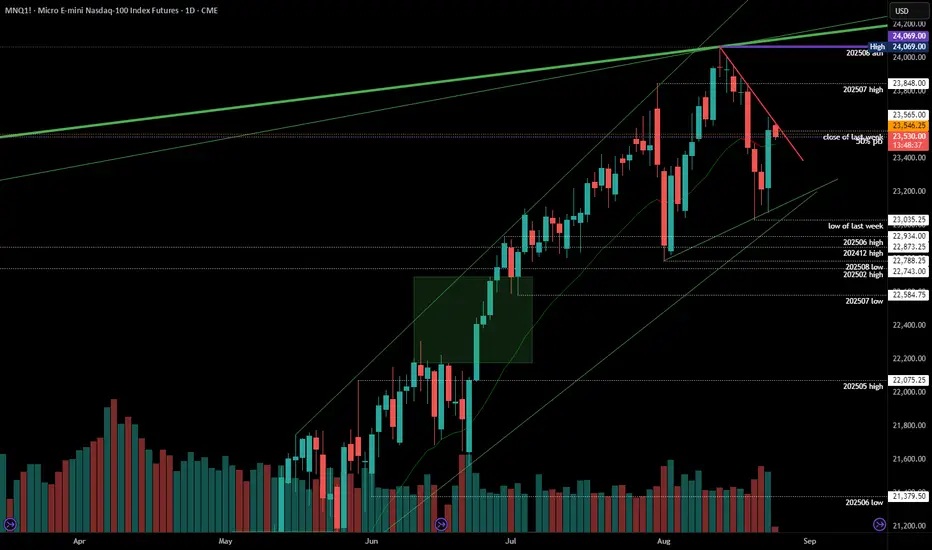
NQ may pullback before creating new highsThe bulls want to push the market higher while the bear wants a 2nd leg down on the daily. PA loses 20EMA then reverses up and we are approaching September where catalyst will help push the market to create new highs. We may retrace from here then move up. My bias is super bullish however not eliminating the potential of a small retracement. i.e. 50% retracement then pushes up. Just my thought process. Cheers
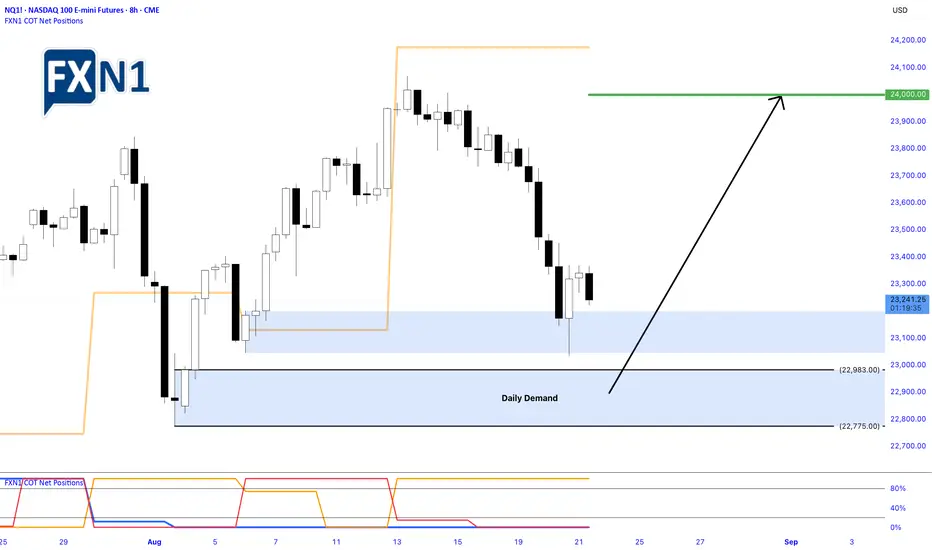
Nasdaq Bounces Off Demand Zone: Opportunities for a Bullish Rev.Yesterday, the Nasdaq experienced a notable rebound from the daily demand zone around 23,201, signaling buying interest at that level. However, as the EU trading session commenced, the index quickly shifted to a bearish impulse, reflecting ongoing market uncertainties and cautious sentiment among traders.
Key Levels and Opportunities
Despite the short-term pullback, the chart presents a compelling opportunity for traders to consider a "buy low" approach near the next demand zone at approximately 22,983. If the market finds support there, it could set the stage for a recovery, with the potential for the Nasdaq to rally back toward the 24,000 mark or even higher.
Market Outlook and Analyst Projections
Analysts remain optimistic about the index’s prospects, with many projecting a strong finish to the year. The Nasdaq, known for its volatility and lucrative trading opportunities, continues to attract traders seeking to capitalize on its upward momentum. As always, projections are optimistic, but the current technical setup suggests that there could be a favorable risk/reward ratio for those willing to position for a rally.
Final Thoughts
In a market characterized by rapid shifts and unpredictable moves, identifying key demand zones and monitoring reaction levels is crucial. The upcoming sessions could provide a prime entry point for those looking to buy dips, with the potential for the Nasdaq to forge ahead into the year’s final stretch with gains.
✅ Please share your thoughts about NQ1! in the comments section below and HIT LIKE if you appreciate my analysis. Don't forget to FOLLOW ME; you will help us a lot with this small contribution.
NQ - August 22 2025 - Before the open
So yesterday was an inside day, which means we traded inside the previous days range (failed to break previous days high or low).
23,000 is a very strong support. If it breaks with conviction there is no real support until about 22,500.
FUNDAMENTALS : I think we will need a strong fundamental reason for 23,000 to break down. Something such as Powell saying they wont cut rates in September. The market is keeping an eye on inflation data and employment because these will determine if they cut or not.
Rate cut scenarios:
1. If inflation spikes due to tariffs as we saw in most recent PPI report, I think they may hold rates.
2. If employment drops a lot (bad NFP report, most importantly unemployment rate goes up) that may force them to cut in September.
3. If inflation drops near 2%, they will likely cut in September regardless of if employment data is good or bad.
***Keep in mind the market is sort of expecting inflation due to tariffs, so if inflation holds steady or is slightly better than expected that maybe enough for them to cut in September.
TECHNICALS : So far we have strong buying near 23,000 level but for the last 3 days buyers are lacking conviction at lower and lower prices. (Selling near 23,300).
Good trading :)

NQ Levels and set up for today With Jackson Hole upon us, we're going to get some explosive moves. I have mapped out my thoughts on the 4H chart. Good luck, be careful out there