NASDAQ 100 E-mini Futures
No trades
Trade ideas

NQ1! | Choppy Price Action Ahead of FOMCThe Nasdaq has been chopping around inside a tight rising structure, and with the Fed meeting tomorrow, this feels like one of those moments where the market is waiting for a catalyst. I’m leaning toward a short-term correction scenario if the macro tone shifts even slightly.
Technical Lens:
Price has been moving inside a smaller rising channel, but momentum is fading and candles are getting increasingly indecisive. As long as price holds above 24,000, the broader structure remains intact, but the current chop does hint at a market losing steam ahead of an event risk.
Scenarios:
If 24,000 holds: the market may simply be digesting recent gains before another attempt higher into the upper bound of the wider channel.
If momentum rolls over: a corrective move becomes more likely, especially if a macro catalyst gives the market a reason to rebalance expectations.
Potential Triggers for a Correction:
The Fed pushes back against overly dovish market expectations, even slightly.
The dot plot signals fewer or later cuts, prompting a repricing in yields.
Powell comments on financial conditions being “too loose,” which has historically caused tech to react quickly.
Catalysts:
FOMC statement, updated SEP (dot plot), Powell’s press conference.
Takeaway:
Price is still respecting support for now, but the combination of choppy price action and a sensitive macro backdrop makes a corrective move a realistic scenario if the Fed leans less dovish than markets expect.

Bullish Look On Higher timeframeMonday opened slightly above the New Week Opening Gap. Which kind of signals a bullish week once we have price trading above the New Week Opening Gap. The daily Sibi would be the first Premium Array price will gravitate to. until then my bias remains bullish. As long as the NDOGPs are inside the range of the previous day price will remain in an accumulation state.
NQ Levels 12/92/2025 PT 25,963Pretty simple setup here. Look for your structure to combat the noise intraday and overnight. I'm long here.

8 DEC 2025: NQ1! MARKET RECAPLKZ:
3AM MODEL IN OPERATION
DISCLAIMER:
The owner of this page is an authorised Representative under supervision of TD MARKETS (PTY) LTD, an authorised Financial Services Provider (FSP No. 49128) licensed by the Financial Sector Conduct Authority (FSCA) under the Financial Advisory and Intermediary Services Act (FAIS).
The FSP is licensed to provide advice and intermediary services in respect of Category I financial products, including but not limited to derivative instruments, long-term deposits, and short-term deposits.
All investment ideas are provided in accordance with the scope of the FSP's license and applicable regulatory requirements. Derivative instruments is a leveraged products that carry high risks and could result in losing all of your capital, and past performance is not indicative of future results.
This idea and any attachments are informational/education and does not constitute a recommendation to buy/sell.
No guarantee is made regarding the accuracy or outcome of this trade idea.
If you choose to accept this idea, please do so at your own risk.

8 DEC 2025: NQ1! MARKET RECAPOH WOULD YOU LOOK AT THAT, HE IS TRYING TO PREDICT THE FUTURE...TSK TSK
DISCLAIMER:
The owner of this page is an authorised Representative under supervision of TD MARKETS (PTY) LTD, an authorised Financial Services Provider (FSP No. 49128) licensed by the Financial Sector Conduct Authority (FSCA) under the Financial Advisory and Intermediary Services Act (FAIS).
The FSP is licensed to provide advice and intermediary services in respect of Category I financial products, including but not limited to derivative instruments, long-term deposits, and short-term deposits.
All investment ideas are provided in accordance with the scope of the FSP's license and applicable regulatory requirements. Derivative instruments is a leveraged products that carry high risks and could result in losing all of your capital, and past performance is not indicative of future results.
This idea and any attachments are informational/education and does not constitute a recommendation to buy/sell.
No guarantee is made regarding the accuracy or outcome of this trade idea.
If you choose to accept this idea, please do so at your own risk.

Bearish Scenario on NQEyeing a bearish scenario on NQ after retracing it to 0.5 to 0.618 fib levels.
Bearish points
- Bearish Divergence on daily
- Rising wedge broken and retested
- Head n shoulder forming
Just waiting on breaking 24000 level to take a legendary short. And I beleive it should retrace back to atleast 0.5 fib level which is close to 21430.
Let's see....
Currently it seems it is going to pump from here to make a LH and then drop from there since it's oversold on Daily timeframe.
Please share your thoughts.

NQ Power Range Report with FIB Ext - 12/9/2025 SessionCME_MINI:NQZ2025
- PR High: 25728.50
- PR Low: 25692.00
- NZ Spread: 81.5
Key scheduled economic events:
10:00 | JOLTs Job Openings
13:00 | 10-Year Note Auction
Session Open Stats (As of 12:25 AM).
- Session Open ATR: 413.46
- Volume: 23K
- Open Int: 310K
- Trend Grade: Long
- From BA ATH: -2.7% (Rounded)
Key Levels (Rounded - Think of these as ranges)
- Long: 26521
- Mid: 25264
- Short: 24008
Keep in mind this is not speculation or a prediction. Only a report of the Power Range with Fib extensions for target hunting. Do your DD! You determine your risk tolerance. You are fully capable of making your own decisions.
BA: Back Adjusted
BuZ/BeZ: Bull Zone / Bear Zone
NZ: Neutral Zone

ICT liquidity sweep entry on fair value gapPrice just took liquidity at 5 minute highs and made a fair value gap for entry

AI Trading: The Revolution You Can't IgnoreThe Era of AI Trading Has Arrived And It's Only Getting Started
Forget the movie version of AI glowing red eyes flawlessly predicting every tick. The real story is colder, quieter, and way more powerful:
We are moving from a world where humans look at charts to a world where machines digest every tick, every candle, every flow of data… and feed you the edge you couldn't see on your own.
Right now, as you read this, AI is already sitting inside:
Execution algorithms routing institutional orders across venues
Risk engines stress testing portfolios in milliseconds
News and sentiment scanners parsing thousands of headlines a minute
Retail tools that turn a paragraph of English into working NYSE:PINE Script
This isn't science fiction. This is the baseline. And the baseline is rising.
The traders who survive this decade won't be the ones fighting AI. They'll be the ones partnering with it.
So What Exactly Is "AI Trading"?
At its core, AI trading is simply using algorithms that can learn from data to make parts of the trading process smarter.
That can mean anything from a small script that filters charts for you, all the way up to full stack systems managing billions. The spectrum looks like this:
AI Assisted Analysis You still click the buttons, but AI does the heavy lifting.
Pattern recognition on charts (trend, ranges, breakouts)
Scanning hundreds of symbols for your exact conditions
Sentiment analysis on news and earnings headlines
Idea generation: "Show me all large‑cap stocks breaking out with above‑average volume"
AI‑Generated Signals The machine tells you what it would do; you decide whether to listen.
Multi‑indicator models that output clear long/short/flat signals
Quant models that score each asset from 0-100 based on your rules
Bots that push alerts when high‑probability setups appear
Fully Automated Trading The system trades end‑to‑end while you supervise.
Execution from signal → order → risk control with no manual clicks
Self adjusting position sizing and risk controls
Strategies that re‑train on fresh data as regimes shift
Wherever you are on that spectrum, you're already in the AI game. The question isn't "Will I use AI?" it's "How deeply will I let it into my process?"
How AI Actually "Sees" the Market
Humans see a chart. AI sees a dataset.
Human view:
One instrument at a time
A couple of timeframes
A handful of indicators you like
Heavily filtered through emotion and bias
AI view:
Thousands of symbols at once
Dozens of timeframes and derived features
Years of historical data compressed into patterns
Zero fear, zero FOMO, zero boredom
Feed a model clean data and it can uncover:
Regimes you feel but can't quantify (trend, chop, grind, panic)
Relationships between assets that hold statistically
Behavioral patterns like "late‑day reversals after gap‑up opens"
Execution patterns in the order book around key levels
But here's the crazy part: AI is completely unforgiving about your assumptions.
If the data is noisy, biased, or poorly structured, the model will happily learn the wrong thing and apply it with perfect discipline. "Garbage in, garbage out" gets amplified at machine speed.
The Era We're Entering: Human + AI, Not Human vs AI
Over the next decade, expect three shifts to accelerate:
From Intuition First → Data‑First
Traders will still have hunches, but they'll validate them against hard data.
Instead of "this looks extended", you'll ask the system: "How often do moves like this actually continue?" and get an answer in seconds.
From Single‑Indicator Thinking → Multi‑Signal Models
No more worshiping one magic oscillator.
AI will blend technicals, fundamentals, flows, and sentiment into a unified view.
From Static Systems → Adaptive Systems
Instead of one set of parameters forever, models will adapt as volatility, liquidity, and structure change.
Think of it as a trading playbook that rewrites itself when the game changes.
Technologies like larger language models, specialized chips, and eventually quantum‑accelerated optimization won't magically "solve" markets, but they will make it cheaper and faster to test ideas, build systems, and manage risk.
The edge shifts from "Can I code this?" to "Can I ask the right questions, define the right constraints, and manage the risk around what the models tell me?"
Where You Fit In As a Trader
In the era of AI, your job becomes less about staring at every tick, and more about designing the rules of the game your tools play.
You define what "good" trades look like.
You choose which markets, timeframes, and risks matter.
You decide when a model is behaving, and when it's time to shut it off.
AI gives you:
Speed: scanning what you could never cover alone
Consistency: executing the plan without emotional drift
Feedback: showing you what really works in your own data
You bring:
Context: macro, narrative, and common sense
Values: what risks you refuse to take
Adaptability: knowing when to step back or switch regimes
Put together, that's where the edge lives.
Getting Started in the AI Era (Without Getting Overwhelmed)
You don't need a PhD, a server rack, or a lab full of quants. You can start small and intelligent:
Audit Your Current Process
Where are you slow? (Scanning, journaling, testing?)
Where are you emotional? (Entries, exits, sizing?)
Those are prime targets for AI assistance.
Add One AI Tool at a Time
Maybe it's an AI screener.
Maybe it's an NYSE:PINE Script assistant that helps you code and backtest.
Maybe it's a journaling tool that tags your trades automatically.
Learn to Read the Data Behind the Magic
Look at win rate, drawdown, expectancy.
Compare AI filtered setups to your old ones.
Keep what clearly improves your edge; drop the rest.
Respect the Risks
Over‑fitted models that look perfect on the past.
Black‑box systems you can't explain.
Over‑reliance on automation with no kill switch.
Is AI Going to Take Over Trading Completely?
In some corners of the market, AI and automation already dominate . High‑frequency execution, index rebalancing, options market‑making, these domains are machine territory.
But markets are more than math. They are human fear, greed, regulation, politics, liquidity constraints, structural changes and unexpected shocks. That messy mix is exactly where human oversight still matters.
The most realistic future isn't "AI replaces traders" it's AI replaces undisciplined, unstructured traders who bring nothing but guesses to the table.
Traders who can think in systems, understand risk, and collaborate with machines? They don't get replaced. They get leverage.
Your Turn
Where are you right now in this evolution?
Still fully manual, doing everything by hand?
Using a few AI assisted tools but not trusting them yet?
Already running bots and systematic strategies?
What part of AI trading are you most curious or skeptical about?
And the big question: Do you think the future of trading belongs to AI, or to traders who know how to use it?
Drop your thoughts in the comments this era is just beginning.

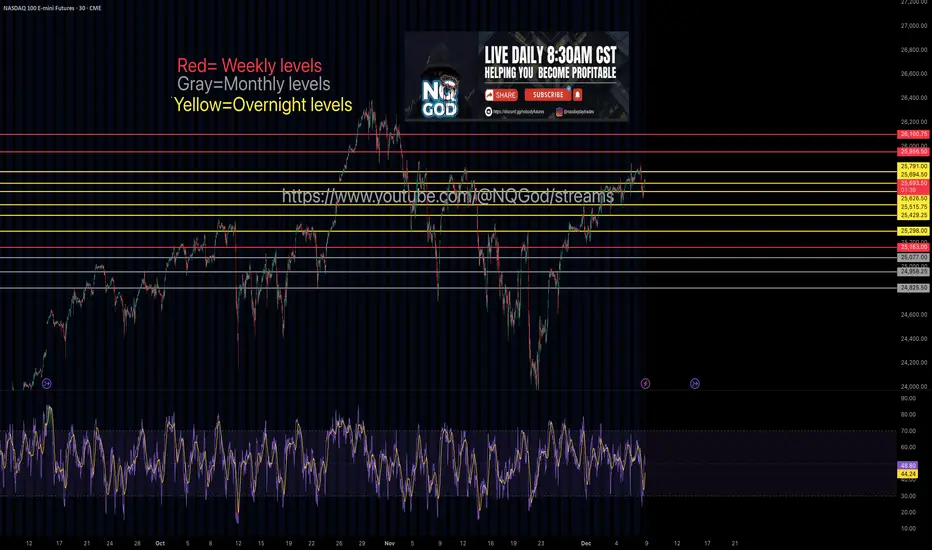
NQ Weekly, monthyl, Overnight levels from a Funded traderPing me with any quetions pretty straight forward levels here
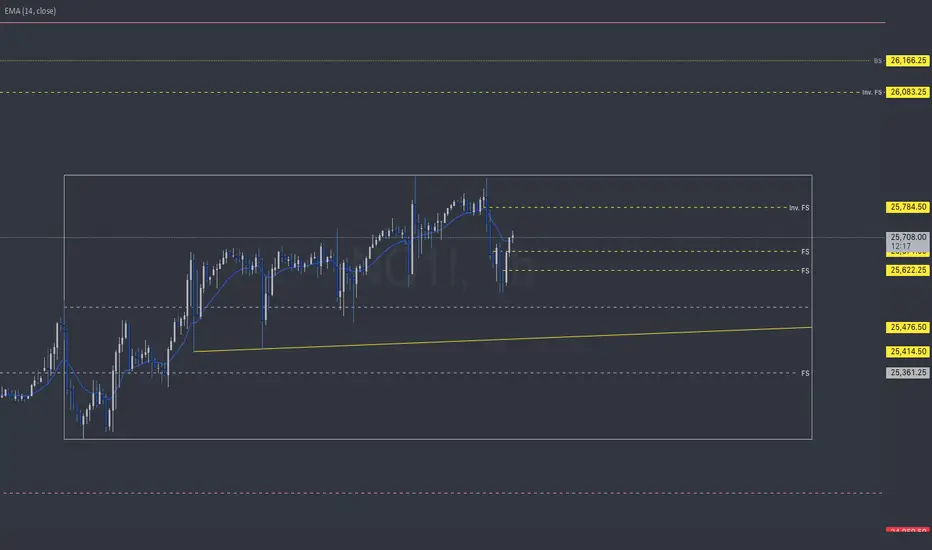
NQ | Week 50 | 1hr chartT.A explained -
BackSide (BS)
FrontSide (FS)
Inverse BS (Inv.BS)
Inverse FS (Inv.FS)
BS & FS levels are expected support when dashed lines, tested when dotted and resistance when solid lines.
The inverse is true for the Inv. BS Inv. FS levels, they are resistance as dashed lines, tested as dotted and support as solid lines.
Monthly timeframe is color pink
weekly grey
daily is red
4hr is orange
1hr is yellow
15min is blue
5min is green if they are shown.
strength favors the higher timeframe.
2x dotted levels are origin levels where trends have or will originate. When trends break, price will target the origin of the trend. its math, when the trend breaks, the vertex breaks too so the higher timeframe level/trend that breaks, the more volatility there could be as strength in the orders flow in to fuel the move.
NQ: Tue 9 DEC, 2025 Trading day biasPrevious day has taken out some major sellside liquidity. From what i have seen i believe buyside delivery has been started and we will be targeting the previous day high and that point also has NewYork session high which makes it relative equal highs.

Loss on NQTrade made sense and the body closed perfectly, hard to predict near to 10am. Half risk tomorrow. Also I am skeptical of no news mondays and mondays from now on

NQ key levels 12/8/2025Best opportunity is fading strength, with downside rotation targeting 25,805 → 25,800 → 25,740 if momentum confirms.
Do not chase breakouts early; trade reactions, take profits quickly, and assume rotation—not trend—unless acceptance above 25,840 holds.

Nasdaq nearing critical balanceIn November, we observed a Hagopian pattern - the market failed to reach the centerline despite the high probability of doing so (see weekly chart left). MACD-V is in divergence since then. A sign to be especially cautious.
This led to the current rally lasting more than ten days without a single close below a prior low. It seems the Plunge Protection Team may be at work.
In any case, we are now approaching the yellow centerline, the market’s point of balance. From there, the market will determine whether we push once more above the yellow centerline toward the white U-MLH, or turn downward, producing a second Hagopian and falling back toward the white centerline.
If the second scenario unfolds, the path toward significantly lower prices would be wide open.
Let’s see what we get for Christmas…

NQ Power Range Report with FIB Ext - 12/8/2025 SessionCME_MINI:NQZ2025
- PR High: 25770.00
- PR Low: 25719.50
- NZ Spread: 113.0
No key scheduled economic events
Session Open Stats (As of 12:15 AM).
- Session Open ATR: 426.48
- Volume: 21K
- Open Int: 307K
- Trend Grade: Long
- From BA ATH: -2.2% (Rounded)
Key Levels (Rounded - Think of these as ranges)
- Long: 26521
- Mid: 25264
- Short: 24008
Keep in mind this is not speculation or a prediction. Only a report of the Power Range with Fib extensions for target hunting. Do your DD! You determine your risk tolerance. You are fully capable of making your own decisions.
BA: Back Adjusted
BuZ/BeZ: Bull Zone / Bear Zone
NZ: Neutral Zone

POSSIBLE ROAD MAP FOR MNQZ2025 My last forecasting for this year and the highest probbility is the bullish scenario to take out the 25801. take care with the FOMC report on wdnesday

NQ Monday, 8 Dec to Sunday, 14 Dec trading weekly lookoutWe will layout either one of this trading variations. On variation A we will trade lower to get some sellside liquidity to push higher or we will push higher first and tap into the daily fvg then shoots lower.

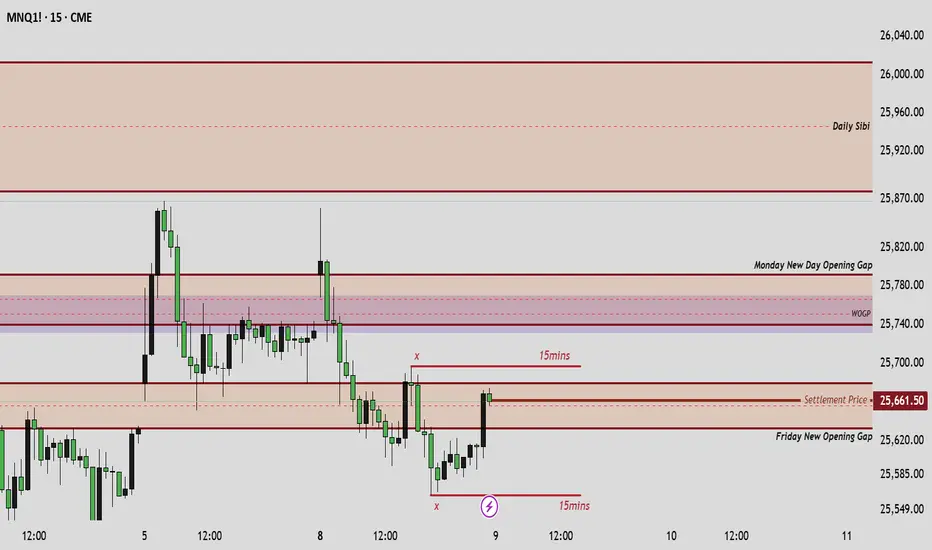
MNQZ Weeekly BiasInterested to see how price opens and play around these annotated levels this week. Bias wise, I'm expecting bullish until further notice, but will be keep a close eye on that upside daly Sibi, will see how price will react from it.

Location 15m NY Session 4 Dec 2025There are 3 setups based on 15 minute structure on 4th December 2025.
Location 1 :
- Trend sell
- Structure breakout sell
Location2 :
- Structure breakout sell
Location 3 :
- Trend sell
- Structure breakout sell

Location 30m NY Session 4 Dec 2025There are 2 setups based on a single location 30 minute structure on 4th December 2025.
Location 1 :
- Trend sell
- Structure breakout sell

Location 15m NY Session 3 Dec 2025 There are 2 setups based on a 15 minute structure on 2nd December 2025.
Location 1 :
- Trend buy
- Structure breakout buy
location 2 :
- Trend buy
- Structure breakout buy
