morning shortLooking for a 9:30 AM opening trade for a push-up to 26,145. And to short down to 26,020.
Trade ideas

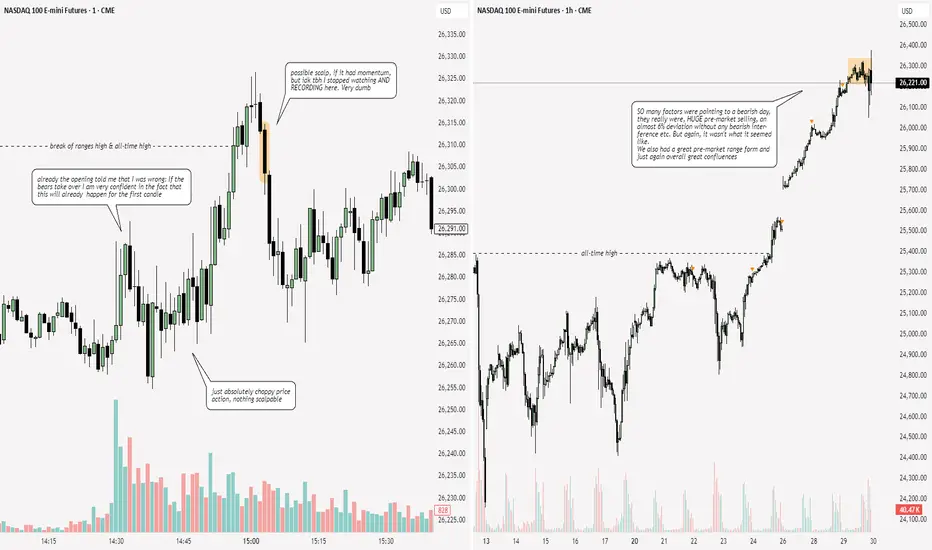
NQ: 278th trading session - recapGood session today, I'm just completely surprised again that we didn't get a single taste of bearish strength. I find it still very strange.
what if that was the meltup?think we get something like this going into Q1 '26
so many potential headwinds out there with the big boys priced for EXCEEDINGLY GOOD OUTCOMES...
lotta risk out there right now.
GOOD LUCK

MNQ Ladder of SuccessEntries: every ought and every five. i.e. every number divisible by 10 and every number divisible by 5.
Exits: 19 points for each and every entry.
Stop Loss: none
Entry type: stop market
Exit type: stop limit
Example
Let's say this bounces on 26220 with a high of 26243.
Entries will start @ 26245 and every 5 points thereafter.
Exits will start @ 26264 and every 5 points thereafter
You are now on The MNQ Ladder of Success. Once you reach the fourth rung you will have a revenue stream every 5 points. Until you don't i.e. after a pullback. When there is a pullback, wait for a bounce and start the process all over again.
If you combine this with A Pawn for a King trading plan your first entry will be -1 @ 26244.50. Beginning @ 26245 and every 5 points thereafter you will buy 2 contracts.
Raw numbers on a page can be confusing and intimidating. Demo trade this and you will see its simplicity.
Don't forget the Pawn is redeemable after a pullback.
Simple short Idea on NQOnce we didn't have much speed after respecting 1st P.FVG and broke below the OB- I was short, watch and see how I managed the trade and my thoughts.

Short Analysis for the NQ ft. ES, DOW & DXYNQ: Range bound , 50/50 as of the time posting this; due to the discrepancies in the 3 sisters and the unreliability of the DXY.
ES: Same situation as the NQ
DOW: Potentially pursuing higher highs with a probability of dragging the NQ and the ES along with it. Although they do not show such interests for now.
News: CPI, PPI, Non-Farm and other market drivers coming up in the next few weeks, which might provide some clarity on the mid to short-term. Calling a top now would be equivalent to gambling, in my opinion.

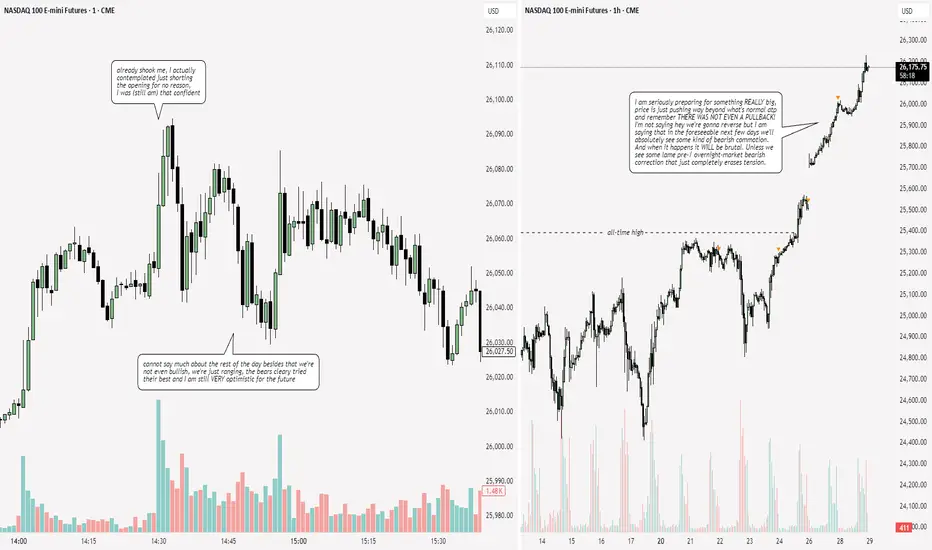
NQ: 277th trading session - recapVery interesting day today. I will be here tomorrow, but probably not on friday. I just really have to hope the bearish increase happens tomorrow or the day after that.
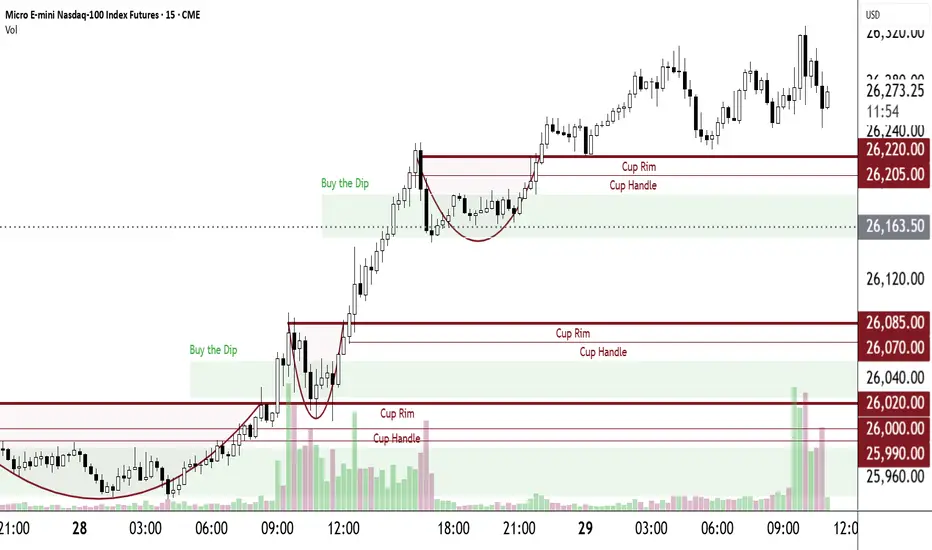
Pop Quiz5m chart. Which candle is shouting "I want to bounce!''? Correct - the 09:55 candle.
Where is it most likely to bounce? Correct once again - the Buy the Dip area especially at prior day's close.
Will it bounce here? Now that's the $64,000.00 question. Therein lies the challenge. As long as you manage your margin and as long as you have one or more Pawns in your pocket, you'll be fine. Prior posts go into both subjects in detail.

"Duct Tape" RallySo says Brian Brenberg of Fox Business's The Big Money Show.
Hopeful news over the weekend about a possible easing of U.S.- China trade tensions gave us today's rally. It's just another duct tape patch. Communism is based on a lie. No matter how cleverly designed and alluring, a lie is still a lie.
"Rob, Replicate and Replace" is a term commonly used when referring to Communist China's Trade policy. Thankfully, for now, we have an administration that knows this and knows how to handle this. Of course, China will continue to lie, obfuscate and delay, delay and delay some more, waiting for a new administration that won't be wise.
Despite this ongoing tension that gives us "duct tape" rallies and volatility, we do have an historical bull market built upon the bedrock of The Fourth Industrial Revolution, strong earnings, an administration that is peace minded and has cut taxes and red tape resulting in powerful economic growth and we have several trade plans that give stellar profits in such an environment. This bull market should last for quite some time.
If you have been following prior posts you would have had your Breakout Trades stacked to the ceiling, ready and waiting for the gap up we had on the 10.26 open. You would have made a pretty good day's pay.
Here is another trade plan I use frequently. I call it a Joker. As with all prior posted trade plans, there's no brilliance here - just common sense. It's a combination of a pivot trade and a Buy the Dip trade. At or near the low of a Buy the Dip area I buy 1 or more MNQ contracts with a profit taker of 101 points. The extra point gives a solid $200.00 profit. I usually get several every week. As usual, I don't use a stop loss. Make sure you manage your margin with this and every prior posted trade plan.
"Behold, I send you forth as sheep in the midst of wolves: be ye therefore wise as serpents, and harmless as doves." Mt. 10:16

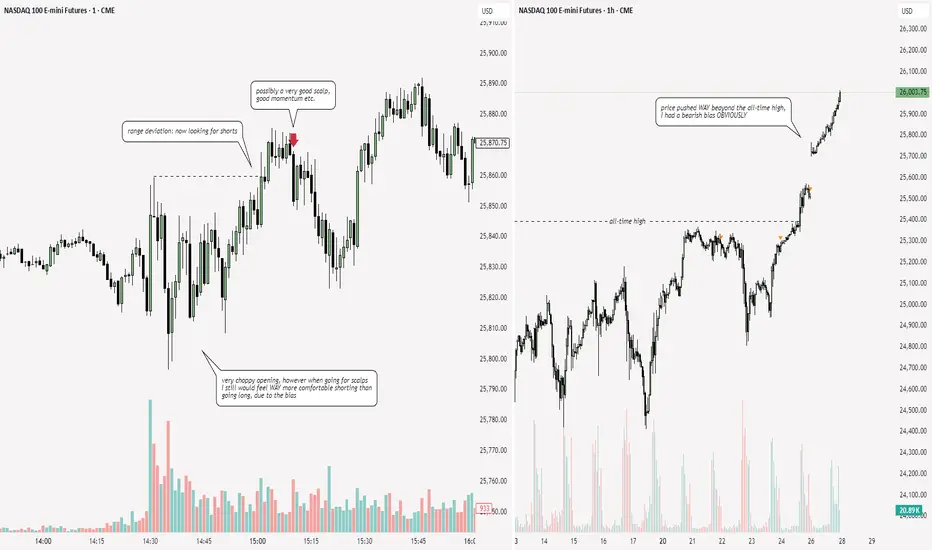
NQ: 276th trading session - recapI'm still contemplating whether I should focus on immediate price reversals when going for scalps that are primarily based off of structure...
AMD Model 2025The AMD model in trading stands for Accumulation, Manipulation, and Distribution. It describes how institutional traders, often called smart money, move the market to collect liquidity and position themselves before the real trend begins.
In the accumulation phase, the market moves sideways and builds liquidity above and below the range. This phase is used by smart money to quietly enter positions while retail traders get impatient, waiting for a breakout. Liquidity builds up at both ends of the range, creating potential stop zones for future manipulation.
Next comes the manipulation phase, which is when the market makes a false move. Price breaks out of the range, sweeping liquidity and triggering breakout traders who believe a new trend has started. In reality, this move is designed to trap traders and collect their stop losses. Once that liquidity is taken, the market usually reverses in the opposite direction — this is where smart money starts positioning for the true move.
Finally, the distribution phase is the real directional move after manipulation. Here, the market shows a clear break of structure, and momentum shifts strongly in one direction. This is when smart money distributes their positions for profit, while late traders are often caught on the wrong side.
The AMD model repeats across all timeframes — from daily to one-minute charts — and helps traders understand the logic behind market moves. To trade using AMD, you identify the range (accumulation), wait for the liquidity sweep (manipulation), and then enter after confirmation of the new trend (distribution). This model is simple but powerful, as it shows how liquidity, structure, and market psychology combine to create the rhythm of price movement.

Target areas - NQ price for Market open.10/27/25 - These are the target areas - NQ price for Market open depending if price moves up or down. Will look for trades into these areas.

PRICE FLOW MNQZ2025This week, the price flow, for this week we are going to look for a rebalance and we will have sales. First, we expect the price to reach the level of $25,788, then we will look for sales down to 25,290. Be attentive to the economic calendar, which can cause significant distortions in the price path performance.

NQ: 275th trading session - recapNothing happened yet again, just another session just for the books here. I will trade tomorrow hopefully, I've been sick

Can NQ1! Push Through $25K+ Resistance Zone?🎯 The Great NQ Heist: Layered Entry Strategy for E-Mini NASDAQ-100 Futures
📊 Market Overview
**Asset:** NQ1! (E-Mini NASDAQ-100 Futures)
**Strategy Type:** Swing/Day Trade - Wealth Accumulation Map
**Bias:** 🐂 **BULLISH**
🎭 The "Gentleman Thief" Layering Strategy
💰 Entry Philosophy: Layer Like a Pro
This setup uses a **sophisticated layering approach** - think of it as strategically placing multiple limit orders to capture the best average entry. You're not going all-in at one price; you're building your position like a chess master.
📍 Suggested Layer Entry Zones:
- 🎯 Layer 1: **24,800**
- 🎯 Layer 2: **24,900**
- 🎯 Layer 3: **25,000**
- 🎯 Layer 4: **25,100**
Note: You can scale in at ANY price level using this layering method. Add more layers based on your position size and risk tolerance. The beauty of this strategy is flexibility - enter where the market gives you opportunity! 🎪
🛡️ Risk Management
Stop Loss Zone: **24,700**
⚠️ **Important:** This is MY stop loss level based on technical structure. However, trading is a personal journey - YOU decide your own risk parameters. Protect your capital first, profits second. Your SL should align with YOUR risk tolerance and account size.
🎯 Profit Target
Target Zone: **25,600** 🚀
This level represents a confluence of:
- 💪 Strong resistance zone
- 📈 Overbought conditions
- Potential bull trap area
**Smart Exit Strategy:** As we approach this zone, consider scaling out of positions. Don't get greedy - take profits when the market offers them!
⚠️ **Reminder:** This is MY target projection. You're the captain of your own ship - take profits when YOU feel comfortable. Trail stops, scale out, or hold for moon - your money, your rules! 🌙
🔗 Related Pairs to Watch
Keep your eyes on these correlated instruments
- SEED_ALEXDRAYM_SHORTINTEREST2:NQ =F** - NASDAQ-100 Futures (spot reference)
- NASDAQ:QQQ - Invesco QQQ Trust (ETF equivalent)
- NASDAQ:AAPL , NASDAQ:MSFT , NASDAQ:NVDA , NASDAQ:GOOGL ** - Top NASDAQ-100 components
- NASDAQ:NDX - NASDAQ-100 Index (cash)
- CME_MINI:ES1! - E-Mini S&P 500 Futures (broader market correlation)
📌 Why these matter:** The NASDAQ-100 is tech-heavy, so major tech stocks drive NQ movement. Watch QQQ for retail sentiment and ES for overall risk appetite. When big tech moves, NQ follows! 💻
🎓 Strategy Breakdown
This "layering" or "scaling-in" approach offers several advantages:
- ✅ **Better average entry** - Dollar-cost averaging into position
- ✅ **Reduced timing risk** - Not dependent on perfect entry
- ✅ **Psychological comfort** - Builds confidence as position develops
- ✅ **Flexibility** - Adapt to market conditions in real-time
📢 Final Thoughts
The market rewards patience and discipline. This layered entry strategy is about working WITH the market, not against it. Whether you're a swing trader holding for days or a day trader scalping ticks, the principle remains: **Control your risk, let profits run.** 🏃♂️💨
✨ **If you find value in my analysis, a 👍 and 🚀 boost is much appreciated — it helps me share more setups with the community!**
**⚠️ DISCLAIMER:** This analysis represents a "gentleman thief" style layered trading strategy intended for educational and entertainment purposes only. This is NOT financial advice. Trading futures involves substantial risk of loss and is not suitable for all investors. Past performance is not indicative of future results. Always trade with risk capital you can afford to lose. Make your own trading decisions based on your personal risk tolerance, account size, and market analysis. 🎭📊
#NQ1 #NASDAQ100 #NASDAQFutures #EminiNQ #FuturesTrading #DayTrading #SwingTrading #TechnicalAnalysis #LayeringStrategy #ScalingIn #TradingSetup #FuturesMarket #TechFutures #NDX #QQQ #RiskManagement #TradingStrategy #MarketAnalysis #BullishSetup

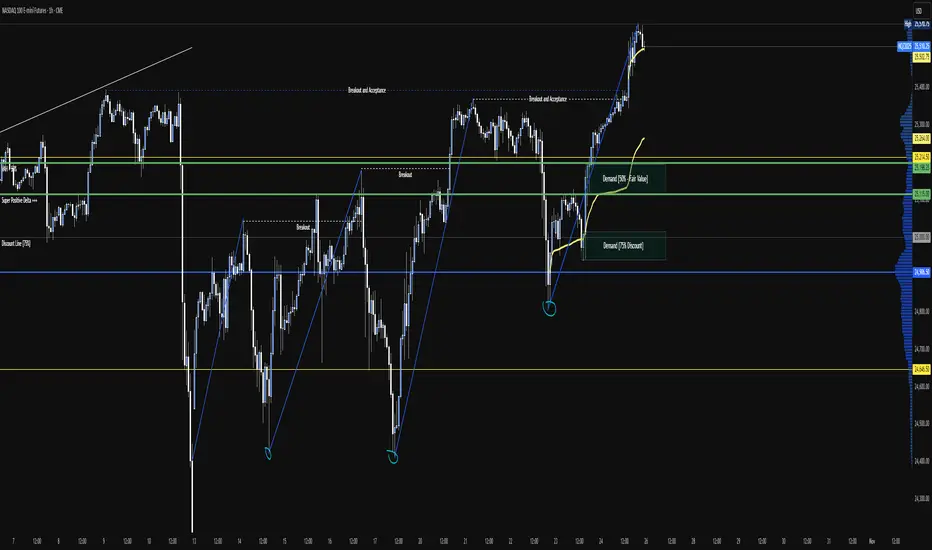
NQ - LONG SETUP AND STUDY ABOUT FAIL BEARISH CONTINUATIONContext:
CPI was already priced higher, anchoring expectations toward a risk-on sentiment.
Two VWAPs are now in play:
VWAP 1 – Origin of the Swing: drawn from the structural reversal low (failed bearish continuation).
VWAP 2 – Macro Event Anchor: anchored at the CPI release on Oct 24, 2025, serving as an institutional reference point until the next major macro event (Big Tech earnings next week).
Market Structure:
After three consecutive bearish structural failures and three long breakouts with acceptance, the bias had already shifted before the violation of 23,395.
The final breakout and acceptance realigned all timeframes to a long structural bias.
Operational Framework:
Macro Value Area (VAH): acts as resistance-turned-demand zone.
Discount Zone: preferred re-entry area.
Trigger: Reaccumulation or failed new low pattern inside value.
VWAP 1 + VWAP 2 confluence: defines fair value equilibrium and directional conviction.
Revision Note:
When sellers fail to extend a bearish range in index markets, all short setups must be reviewed.
The structural bias in equity indices remains long by default — short efficiency must be proven, not assumed.
Target areas - NQ price for Market open.10/24/25 - These are the target areas - NQ price for Market open depending if price moves up or down. Will look for trades into these areas.

NQ & ES Premarket Comment Friday 24-10-2025Good morning everyone.
Today we are operating within a Premium Zone. After witnessing price extend beyond the indices’ all-time highs (ATHs), our focus now shifts exclusively to short opportunities, should they arise.
We’re trading within an extended upper range where only short setups make sense following the market’s open.
It’s TGIF Strategy mode today — the goal is to target lower clusters/liquidity zones and aim for a weekly close below the highs. Our key objectives are the internal liquidity pools, fair value gaps (FVGs), and most importantly, the mean line (equilibrium point).
Stay disciplined and patient. When price aligns with your personal model’s rules and confirms your bias — execute the short. If confirmation doesn’t come, do nothing. Let the market deliver its lessons.
See you later in the final commentary of the week.
PF

NQ Power Range Report with FIB Ext - 10/24/2025 SessionCME_MINI:NQZ2025
- PR High: 25303.00
- PR Low: 25276.00
- NZ Spread: 60.5
Key scheduled economic events:
08:30 | CPI (Core|MoM|YoY)
09:45 | S&P Global Manufacturing PMI
- S&P Global Services PMI
10:00 | New Home Sales
AMP Futures temporarily setting US Equity Indices Margins to 25% for expected volatility spike for U.S. Economic News Releases
Session Open Stats (As of 12:55 AM)
- Session Open ATR: 385.77
- Volume: 20K
- Open Int: 284K
- Trend Grade: Long
- From BA ATH: -0.2% (Rounded)
Key Levels (Rounded - Think of these as ranges)
- Long: 26020
- Mid: 23571
- Short: 21939
Keep in mind this is not speculation or a prediction. Only a report of the Power Range with Fib extensions for target hunting. Do your DD! You determine your risk tolerance. You are fully capable of making your own decisions.
BA: Back Adjusted
BuZ/BeZ: Bull Zone / Bear Zone
NZ: Neutral Zone
NQ: 274th trading session - recapNun much again, mostly also for the books but atleast today price action wasn't as ugly as it normally is...
NQ Power Range Report with FIB Ext - 10/23/2025 SessionCME_MINI:NQZ2025
- PR High: 25059.50
- PR Low: 25000.25
- NZ Spread: 132.25
Key scheduled economic events:
08:30 | Initial Jobless Claims
10:00 | Existing Home Sales
Session Open Stats (As of 12:15 AM)
- Session Open ATR: 396.82
- Volume: 31K
- Open Int: 281K
- Trend Grade: Long
- From BA ATH: -1.1% (Rounded)
Key Levels (Rounded - Think of these as ranges)
- Long: 26020
- Mid: 23571
- Short: 21939
Keep in mind this is not speculation or a prediction. Only a report of the Power Range with Fib extensions for target hunting. Do your DD! You determine your risk tolerance. You are fully capable of making your own decisions.
BA: Back Adjusted
BuZ/BeZ: Bull Zone / Bear Zone
NZ: Neutral Zone

Forty Thousand Foot ViewCharles Payne recently said his favorite pattern is a Cup & Handle pattern. His guest agreed.
I use a chart like this to get the big picture. I want to emphasize several things.
1.Cup 1 is huge. It said, "Here is a foundation for building upon." You can see how it has fulfilled that bold statement and how strongly it has held fast.
2.Cups 2 & 3 are upside down, cup 3 higher than cup 2. These two cups are saying, "Things are going higher."
3.Cup 4, which is still forming, is saying, "Look here. We are building a new dance stage similar to Cup 1's dance stage and a whole lot of partying is going to happen when it is completed."
4.This is the most important takeaway for you. One Thousand ninety-three points separate the rims of cup 1 and cup 4. With the trading plans I have detailed in prior posts I have traded that 1,093 points many times over and so can you.
From 9/2 - 10/20 using these plans I grew my account by 44.7%. I'm not at all saying look how great I am. I am saying look what you can do.
Finding a trading plan that works is vital to success. It took me years and thousands and thousands of demo trades and live trades trying to replicate the trade ideas of others that I got from many and varied sources. The results were ever so disappointing.
One day I said, "Sidgate, you are a fellow of Common Sense. I challenge you to create a trading plan that works."
I took him up on that challenge and I share those results with you.
What's the catch? There has to be a hook here somewhere...
As corny as it may sound - it is indeed more blessed to give than to receive. I have found that as I have shared these plans and charts with you my trading results have improved. I don't think that would have happened had I not spent so many hours examining every little detail of my charts and trading plans in order to clearly communicate them to you.
I know I've made typos and simple math errors along the way. When I go back and see them, I cringe. Hopefully, you can learn despite those cringeworthy events.
Again, this is a 40,000-foot view. A very important view. For all entries and exits I use a 5-minute chart and 5-minute cups & handles. The 5-minute chart sure can get busy. I am very thankful Trading View gives us the option to hide drawings.
Just a little aside - today's low, the place where it bounced, was almost exactly on one of the handles of a 5-minute cup.
I am still a work in progress...

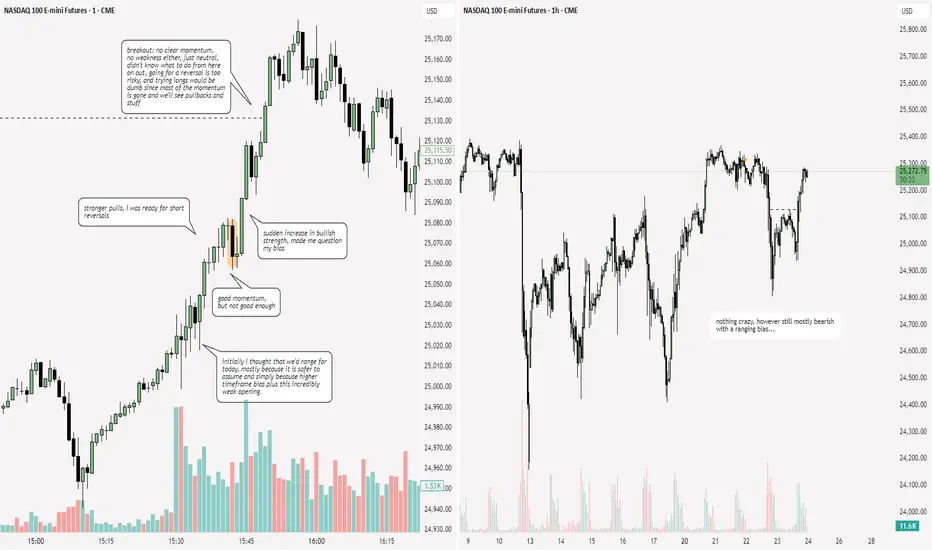
DEMO TRADE + REASONING AND EXCECUTION DEMO TRADE + REASONING AND EXCECUTION, My pre market analysis and trade excecution.
