NQ Power Range Report with FIB Ext - 9/4/2025 SessionCME_MINI:NQU2025
- PR High: 23458.25
- PR Low: 23434.25
- NZ Spread: 53.5
Key scheduled economic events:
08:15 | ADP Nonfarm Employment Change
08:30 | Initial Jobless Claims
09:45 | S&P Global Services PMI
10:00 | ISM Non-Manufacturing PMI
- ISM Non-Manufacturing Prices
12:00 | Crude Oil Inventories
Session Open Stats (As of 12:25 AM 9/4)
- Session Open ATR: 299.73
- Volume: 26K
- Open Int: 277K
- Trend Grade: Long
- From BA ATH: -2.3% (Rounded)
Key Levels (Rounded - Think of these as ranges)
- Long: 24382
- Mid: 23239
- Short: 22096
Keep in mind this is not speculation or a prediction. Only a report of the Power Range with Fib extensions for target hunting. Do your DD! You determine your risk tolerance. You are fully capable of making your own decisions.
BA: Back Adjusted
BuZ/BeZ: Bull Zone / Bear Zone
NZ: Neutral Zone
NQM2022 trade ideas
NQ - 9/4 1HRMonthly timeframe Pink
Weekly = Grey
Daily = Red
4hr = Orange
1hr = Yellow
15min = Blue
5min = Green
4 candles, 6 Levels, & MarketMeta
Range = 2 or consecutive candles of the same color.
Distribution Range - When price is above a distribution range it will act as support. When price is below, the SwingLow will be the boundary/entrance/exit of the range.
Distribution ranges consist of the 1st candle called the BackSide and last candle called the Frontside. Each has expectations.
BackSide candle (BS): expectation=strong reaction to price, support price. Hold price above it. Mark this level with a horizontal ray tool on the topside wick or topside body.
FrontSide candle (FS)
expectation = support price until trend reversal. Protects the SwingLow, exit of range.
To mark this level, place the horizontal ray tool on the topside wick or topside body.
SwingLow = the bottom side wick of the FrontSide Candle. Boundary of the range.
The Accumulation Range - When price is BELOW an accumulation range then these levels will act as resistance to price.
Inverse Backside (Inv.BS)= the first candle in the accumulation range. Its marked on the bottom side wick or body of the candle.
Its usually next to a Frontside candle. Traders like to see Inverse BackSide candles engulf Frontside candles and create an impulsive Fair Value Gap.
These f.V.G's next to FrontSide levels have higher probability than those that don't have the engulfing, F.V.G..
the last candle in the accumulation range is the Inverse FrontSide (Inv.FS)
marking the topside wick with the horizontal ray tool is to mark the SwingHigh Level. Mark the bottom side wick or body to display the Inv.FS level.

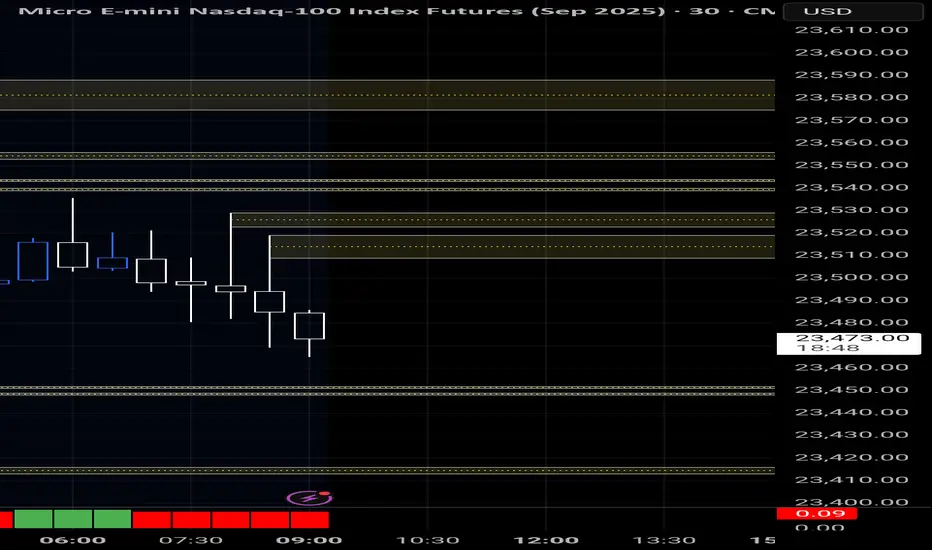
Targets above and below current price for NQ at US OpenTargets above and below current price for NQ at US Open.
9.8.25 Supply Demand Zones + My Key LevelsLink to chart: www.tradingview.com
Posting for the YT community fam.

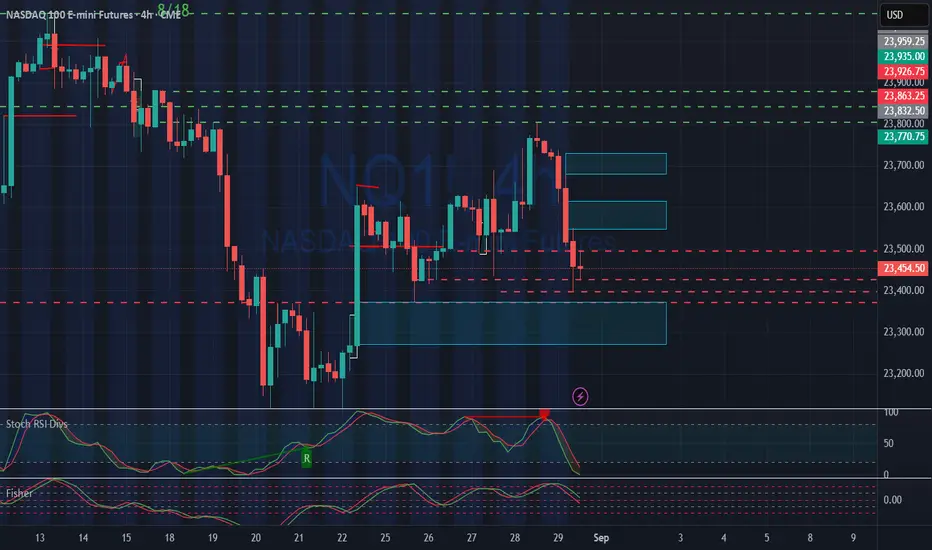
NQ FUTURES IDEA 9/7We are looking to test the top of 23,773 NQ but if we fall below 23,685 NQ we going short. I think we have a higher chance of going higher to retest 23,773 and even push up to PWH at 23,800 NQ tomorrow before pushing back.

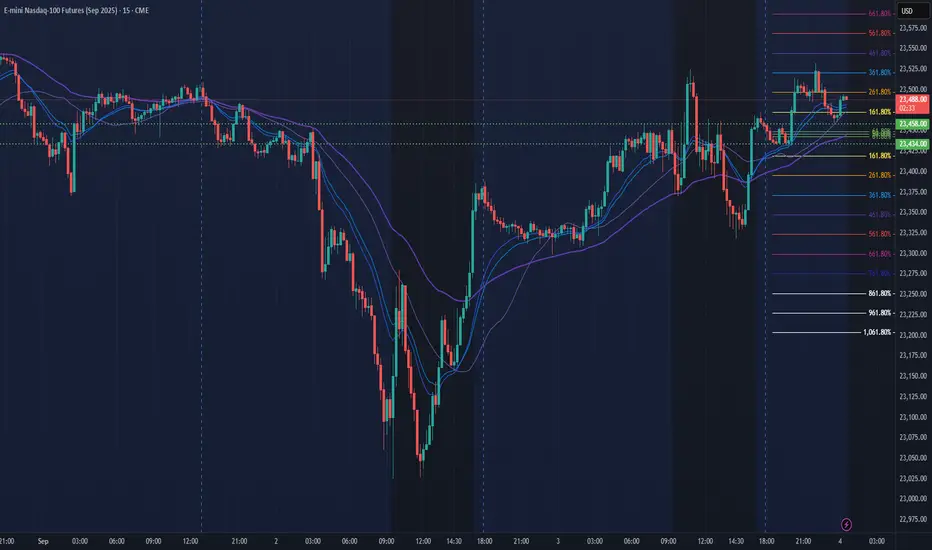
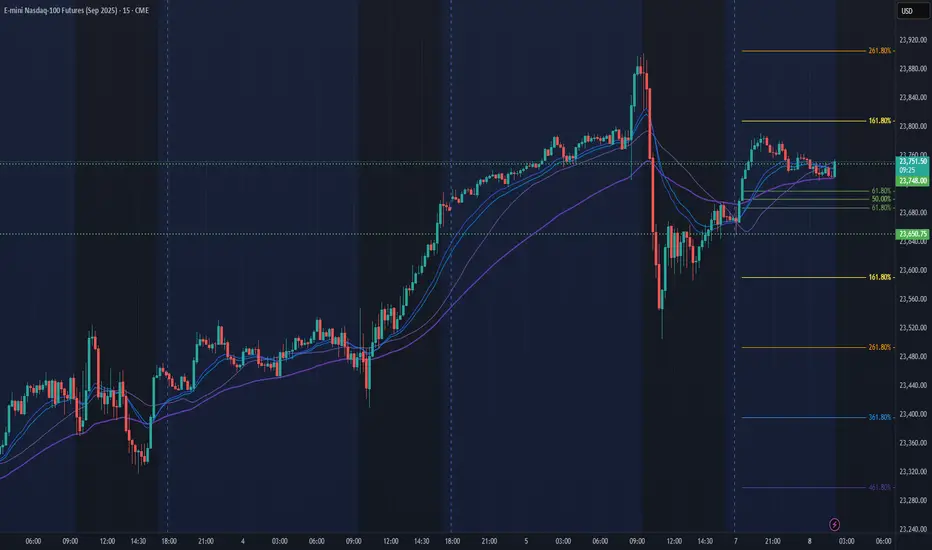
Dont take a short position if you didnt short 76% FIBOPossible movement to lick the trendline to the local low. I have a re-entry at the shooting star at 76%, it's not worth going short now.
just wait or go long for couple of days
SL(long) 23.350
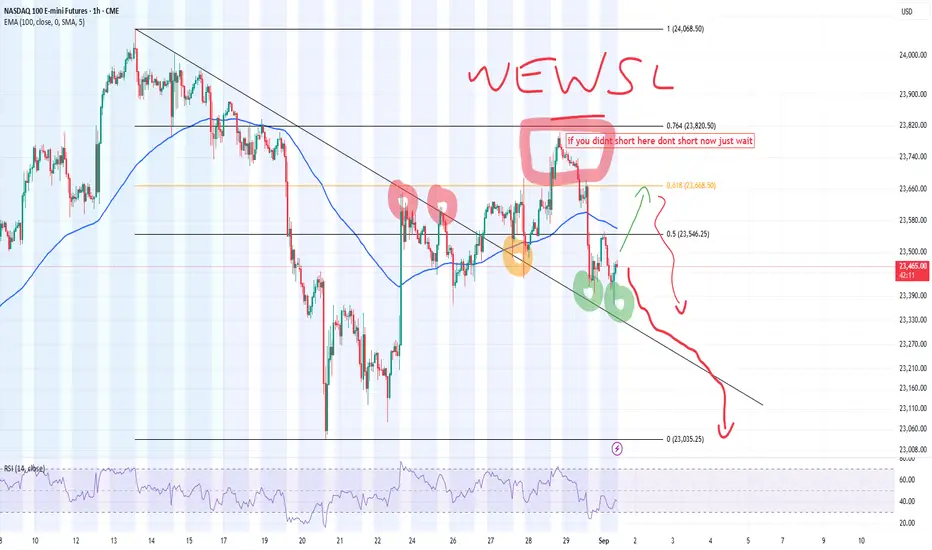
NQ Bearish Idea for week 08-12/09/25I can see 2 higher levels being reached first before price starts collapsing toward mid end of the week. Only taking short setups this week. News will drive us to Target 1,2 and potentially 3.
Always caution, patience and risk!
GL!
If you like the content give me a follow on X!
Check Bio. Cheers!

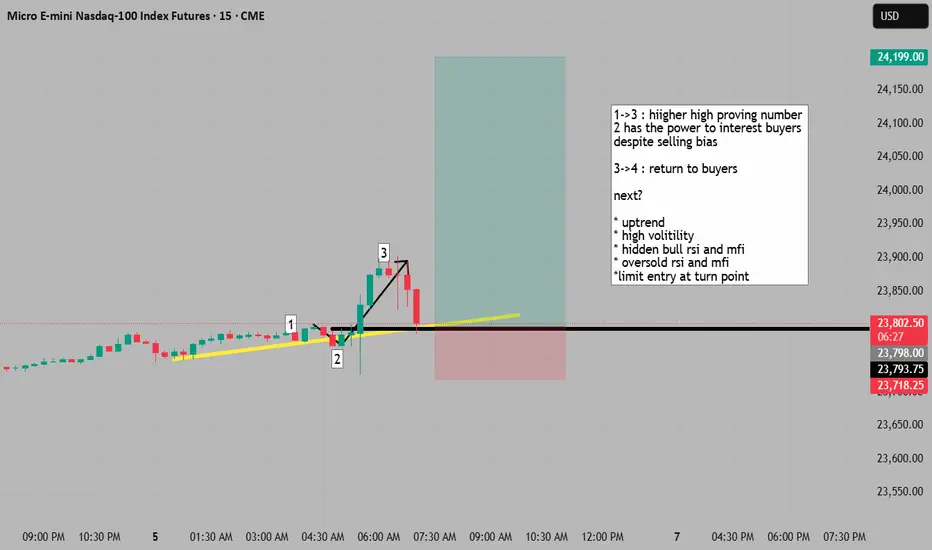
entry at markets edge for uptrend continuation idea 1->3 : hiigher high proving number
2 has the power to interest buyers
despite selling bias
3->4 : return to buyers
next?
* uptrend
* high volitility
* hidden bull rsi and mfi
* oversold rsi and mfi
*limit entry at turn point
NQ Next move after Fed decision I have mapped out possible moves for NQ in the coming weeks.
Trying to predict in this market is foolish as i have learned. trade the patterns. September should be a weak month and cycles suggest topping patterns, but this market seems relentless.
To much political interference in everything that is upsetting the status quo.
Be patient and trade carefully.

NQ FUTURES IDEA We are looking to test the top of 23,782 NQ but if we fall below 23,608 NQ we going short. I think we have a higher chance of going down below 23,782 NQ tomorrow. Because Wall Street is on edge heading into Friday’s nonfarm payrolls. Economists forecasting the U.S. economy added 75,000 jobs last month, a weak estimate that’s only slightly higher than the dismal 73,000 headline number in the July report. The unemployment rate is also projected to tick higher, to 4.3% from 4.2%. I know Las Vegas unemployment is one of the highest in the nation so things are not well so NQ will continue to have more volatility.

NQ! - September 3rd, 2025 - PMThe market has been beating me up these last few sessions...
I trade NQ futures. Here are my 2 last days of trading.
Good trading to all

NQ Power Range Report with FIB Ext - 9/8/2025 SessionCME_MINI:NQU2025
- PR High: 23748.00
- PR Low: 23650.25
- NZ Spread: 218.75
No key scheduled economic events
Session Open Stats (As of 1:25 AM 9/8)
- Session Open ATR: 307.04
- Volume: 31K
- Open Int: 285K
- Trend Grade: Long
- From BA ATH: -1.3% (Rounded)
Key Levels (Rounded - Think of these as ranges)
- Long: 24382
- Mid: 23239
- Short: 22096
Keep in mind this is not speculation or a prediction. Only a report of the Power Range with Fib extensions for target hunting. Do your DD! You determine your risk tolerance. You are fully capable of making your own decisions.
BA: Back Adjusted
BuZ/BeZ: Bull Zone / Bear Zone
NZ: Neutral Zone
E mini Nasdaq 100. Daily Outlook and walkthroughCME_MINI:NQU2025
Explained the reasoning and the orderflow on NQ. Clean onesided delivery during New York Open

Stock Index Matrix; NQ, ES, YM Monthly UpdateThe August Non-Farm Payrolls report, due on Friday, is the centrepiece of the week and will follow a monthly private payrolls reading and job openings figures.
I am looking at the undervalued areas in price action when buying the stock indexes.
Monthly Nasdaq inefficiency: $22,582.00 - $22,083.00
Monthly S&P 500 Inefficiency:
$6,227.25 - $6,063.00
Monthly Dow Jones Inefficiency:
$43,911 - $42,999

August 2025 pnl
This month I ran 3 algos on the micro futures (MES & MNQ).
Z-Score Strategies (MES + MNQ)
• 25 trades in total
• 60% win rate
• Net P/L: $294 after fees
→ These trades showed steady performance, leaning on consistency with solid risk/reward.
MNQ DVD Strategy
• 8 trades total
• 50% win rate
• Net P/L: $237 after fees
→ Fewer trades, but higher expectancy ($31 per trade) — when this one hits, it pays well.
📈 Takeaway:
The Z-Score setups gave more consistency, while the DVD algo added bigger pops per trade. Running them together balances steady gains with higher payoff opportunities.

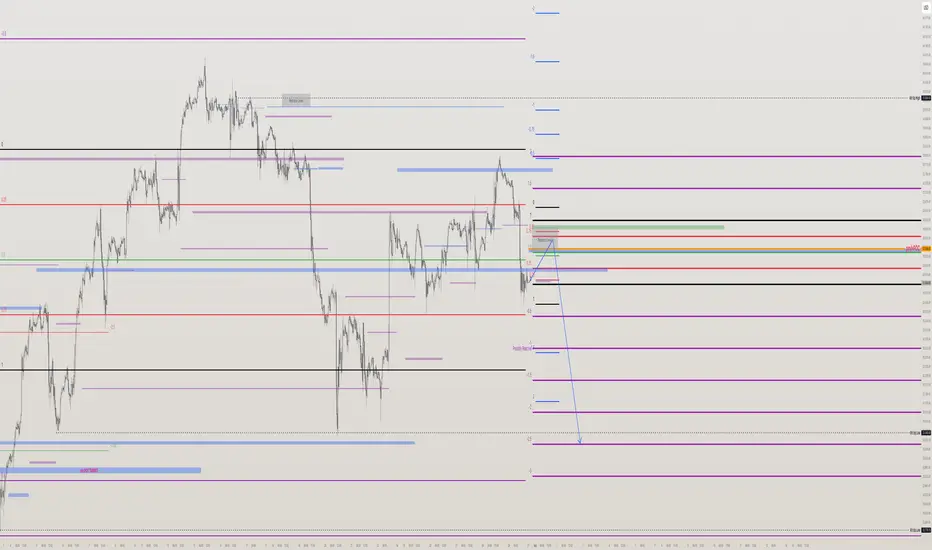
NQ - Nasdaq Short Playbook for the next weeksIn the NQ, they took out the high and then hit it on the head day by day. It finally stopped below the 1/4 line. If you look closely, you see that this was the slanted zone of Support — just like the slanted Resistance.
"As above, so below."
...write me in the comments who said this already a couple hundred years ago §8-)
The small Modified Schiff Fork tells a story too.
Price reached the Center Line and got rejected. Now it's on its way down towards the small Fork's L-MLH. A break of it would indicate further selling ahead.
And the last bastion is the green support level, which stems from the second-to-last prior confirmed Swing Low.
Beyond this level, it's only a question of time before price hits the Center Line.
And — God forbid — below the Center Line, the Sh...t hits the fan. So you better run... behind price with a decent short trade and ride it down to the Abyss.
No worries, I'm with you §8-)
Happy Monday, folks!

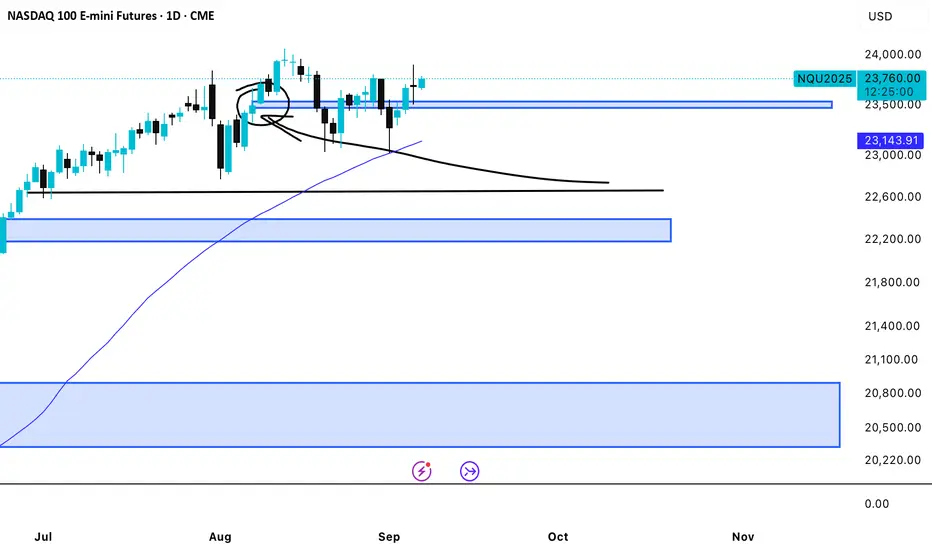
Thinking the impossibleIm thinking the impossible likeliness of NQ pushing higher testing 24000, before pulling back to create a leg down before moving higher again later. Sept & October is a possible red candle to allow long term buyers to buy at a lower price, perhaps similar to Feb and March pullback or perhaps not. The monthly candles are getting smaller during the past 2 months, which was also demonstrated in Feb and March. Price exhaustion based on a Demark 13 similar to Jun and July 24 before the pullback in August to October 24 adding the conviction of a probable pullback. Nobody can be certain what will happen in the future, just thinking the probable likeliness. Just an idea to ponder.

E mini Nasdaq 100. Weekly Outlook. September 01, 2025CME_MINI:NQ1!
Expecting all out meltdown on Nasdaq. And the other two indexes. August was insane. But September will be extremely volatile

NQ Range (08-25-25)Going back to Range play this week. We are in the middle of a long lasting trend of a Friday-Monday Long Play, this has been the redirect of any drop going back a year or two. Total guess this week, Blue Arrows are Key Levels to watch for hit/reversals. The Shaded Zone above is a Turn Zone that will/may reject and send the NAZ 23,486 or 486 1st then TZ try. Go Fed, BTD & FOMO for another Decade. The Buy The Dip Strategy seems to TRUMP all strategies and Wash Street is banking on that. Still feel we go lower prior to any new ATH. Look sideways to lower and stay long in any O/N Session.

NQ Prediction for week 1-7/09 2025After NQ reaches the reaction area above, we should wait and see if it's start rejecting it to start go lower. Overall bearish, so only bearish trades taken this week until proven wrong (see go higher from rejection)
NQ1! 4H Technical SnapshotNQ1! 4H Technical Snapshot
NQ1! is currently consolidating within a symmetrical triangle formation on the 4-hour timeframe.
The price is testing the Fib Golden Level (50-61.8% retracement) along with the ascending trendline, which serves as immediate confluent support.
The descending trendline above has acted as resistance, limiting upside momentum and defining the upper boundary of this consolidation.
Should current support break, further downside targets include the 'Good Support' zone around 23,000-23,100, followed by the 'Key Support' area near 22,800-22,900.
Disclaimer:
The information provided in this chart is for educational and informational purposes only and should not be considered as investment advice. Trading and investing involve substantial risk and are not suitable for every investor. You should carefully consider your financial situation and consult with a financial advisor before making any investment decisions. The creator of this chart does not guarantee any specific outcome or profit and is not responsible for any losses incurred as a result of using this information. Past performance is not indicative of future results. Use this information at your own risk. This chart has been created for my own improvement in Trading and Investment Analysis. Please do your own analysis before any investments.

NQ DAILY LEVELSKey levels that will be in play next week based of the four-hour time frame. We also have some fair value gaps and liquidity pools the market should be looking to take out. Expecting monday to be a bullish day due to more news the fed may lower interest rates.