MAJOR MARKET SIGNALPlease watch the entire video to understand my overall logic.
Through the years I've gone through many different strategies, learning, refining and sharpening my edge in the markets. Today I truly find myself most in the identity of a "Discretionary Trader" with a mechanical approach.
In this chart break down I am displaying a Monthly Hanging Man Signal Bar.
This is provided to me by the market not a 3rd person subjective strategy. We are going to want to monitor how price behaves at the high and low of prior monthly candle. Breaks of these levels will act as pivot points.
Do you think this could be the start of a massive correction?
NASDAQ 100 E-mini Futures
No trades
Market insights

IS THE NASDAQ 100 ABOUT TO FORM A HEAD AND SHOULDERS TOP?Hey Traders Happy Holidays to all!
So as we enter this volatile time period what better way would it be for stocks to close out the year with a bang and break the all time high when Santa Claus comes to town!
Hmmmm..... acutally I don't mean to be the Grinch that stole Christmas but lets not got too excited just yet the market has rallied strong since the volatile bottom in April and it is looking very heavy right now.
So I always say the charts tell a story and from what I see on the chart is a possible Head & Shoulders formation in the Nasdaq 100.
I think the line in the sand is going to be 24,145 if that breaks we could see it fall hard. The way should trade the Head & Shoulders is wait for market to close below the neckline then go short with a stop above the right shoulder or the head.
I think next week FED meeting Wed Dec 10 will tell us more truth be told alot of traders take the holidays off so expect very thin trading and low volume as we get closer to end of year. Sometimes its a good idea to take time off from trading too clear our heads and minds to prepare for new year.
So therefore here are todays Scenarios...
Bullish- wait for market to break the all time high and close above 26,410 then buy a pullback and be careful because Jan is seasonally bearish time for stocks until March/April. Or wait for market to fall and buy back in March/April when you see signs of bottom formation.
Bearish- For all you bears out there keep sharpening your claws. 😁 Ok seriously being bearish or shorting the stock market is a bad thing to do long term because the odds are always against us due to strong bull market runs. However there are 2 times a year when the odds go in our favor and that is Jan-March and Sep-Oct. So with the charts now showing a possible Head & Shoulders top about to form this could be one of those times to go short on a break below the neckline.
Commitment of Traders- none until end of Jan due to Govt Shutdown but last report showed Nasdaq with extreme long positioning which could be good sign also for over extended longs about to close positions if selloff begins.
Good Luck & Always use Risk Management!
(Just in we are wrong in our analysis most experts recommend never to risk more than 2% of your account equity on any given trade.)
Hope This Helps Your Trading 😃
Clifford
RISK DISCLOSURE
TRADING IN THE FUTURES AND FOREX MARKET INVOLVES SIGNIFICANT RISK. ALWAYS CONSULT A FINANCIAL ADVISOR AS HIGH RISK ASSET CLASSES MAY NOT BE SUITABLE FOR ALL INVESTORS. THIS IS NOT A RECOMMENDATION TO BUY OR SELL ANY ASSETS. ALL IDEAS ARE MADE FOR EDUCATIONAL PURPOSES. PAST PERFORMANCE DOES NOT GUARANTEE FUTURE RESULTS.
CFTC RULE 4.41 – HYPOTHETICAL OR SIMULATED PERFORMANCE RESULTS HAVE CERTAIN LIMITATIONS. UNLIKE AN ACTUAL PERFORMANCE RECORD, SIMULATED RESULTS DO NOT REPRESENT ACTUAL TRADING.

short nasdaq nasdaq looking good for some shorts.
high time frame smt divergence , a lot of confluences for the downside.

$11,300 in 14 minutes!Trading isn’t hard.
Interpreting everything at once is.
This NQ trade wasn’t about predicting anything.
It was about confluence being clear enough to act without hesitation.
Trend, momentum, structure, and higher-timeframe context were aligned.
No mixed signals. No mental gymnastics. No second-guessing.
When multiple inputs agree, the trade becomes obvious.
Execution gets simple.
Management gets boring.
And exits stop feeling like guesses.
This is what happens when you’re not juggling indicators in your head, but reading one coherent market state instead.
Same market.
Same volatility.
Just organized context.
Clarity, bar by bar.

NQ Pre-date ideaAfter yesterday’s sell-off, I’ve moved away from the idea that this was a daily uptrend experiencing a simple 4-hour retracement. Price action clearly indicated a need for deeper corrective movement.
At this point, I believe there is still downside risk, which forms my bias for the day. On the 15-minute to 1-hour charts, the structure appears to be a 1-hour retracement within a broader 4-hour downtrend—an area that could present a high-quality short opportunity.
Additionally, we have yet to see a sweep of any significant liquidity to the downside that would generate sufficient buying pressure to reclaim higher levels and shift market structure back to the upside.
Today, I’ll be watching for a breakdown and continuation out of the 15-minute to 1-hour retracement, with Wednesday’s low of day as the primary downside target.

NQ Power Range Report with FIB Ext - 12/18/2025 SessionCME_MINI:NQH2026
- PR High: 24999.00
- PR Low: 24925.00
- NZ Spread: 165.5
Key scheduled economic events:
08:30 | Initial Jobless Claims
- CPI (Core|MoM|YoY)
- Philadelphia Fed Manufacturing Index
Session Open Stats (As of 12:55 AM)
- Session Open ATR: 426.70
- Volume: 36K
- Open Int: 266K
- Trend Grade: Long
- From BA ATH: -5.3% (Rounded)
Key Levels (Rounded - Think of these as ranges)
- Long: 26521
- Mid: 25264
- Short: 24008
Keep in mind this is not speculation or a prediction. Only a report of the Power Range with Fib extensions for target hunting. Do your DD! You determine your risk tolerance. You are fully capable of making your own decisions.
BA: Back Adjusted
BuZ/BeZ: Bull Zone / Bear Zone
NZ: Neutral Zone

Theory: 24,200 target in Globex session 12/17/25This is a theory based on speculation. Normally, we don't speculate but this is backed by technicals.
Trump addressing nation at 9 pm today. Keep that in mind.
All day, market's been dumping. We finished around -1.75% in the red. CME_MINI:NQ1!
Now hear me out. At MOC, we dumped 100 points and the low of day was literally the 3:59:59 pm candle. EST of course.
What happened after 4 pm? Pumped 110 points almost instantly:
Why did that happen? To cause a gap after market and then get dumped on during Globex.
Potentially: what caused the dip? Sure sure some news. But what caused EOD dip other than Market On Close Imbalance?
Potentially: someone knows what 9 pm will be about (Venezuela War?), "My fellow Americans, we're going to war". Something like that. Recall: GWB II & Iraq.
But why address the nation at 9 pm in Globex if it's not bearish? To cause as much dip as possible and let it settle overnight where buyers can buy the dip. That means people who dipped at 3:57-3:59 pm get in lower tomorrow at 9:30 AM.
What's my plan? Trade shorts in Globex tonight if I do trade.
So far the theory is theorying and Globex is dumping with tp below NYC close:
Will probably aim to buy dips low low 24ks tomorrow after market open. Remember the people who exited 3:59 will wanna get in lower. Otherwise it's not worth it for em.
Disclaimer: this is all speculation backed with some technicals. I usually don't trade this way. But if we're talking bearish, look at the 4hr inverse cup & handle & 25076 support break & close below the whole day's range.

What to watch for on NAS100?With all of shifts in the climate, market, etc., you never know how the market will respond.
Here are few potential ideas to watch for in the coming weeks.

NQ idea
Seems like NQ is going to want to grab the Liquidity chilling at this 4hr before making any shot at moving higher. If we just smash through it, we are likely trying the fill the volume imbalance on the Daily Time frame (the blue box)
This market is some what of a hard read since we are in a daily up trend, but in a 4 hour downtrend. This 4hr trend could either be a retracement or a complete structure shift. Only the future can confirm

NQ: 291st trading session - recapI'm so mad, last post was called "260th" when it shouldve been "290th", that actually makes me so mad rn...

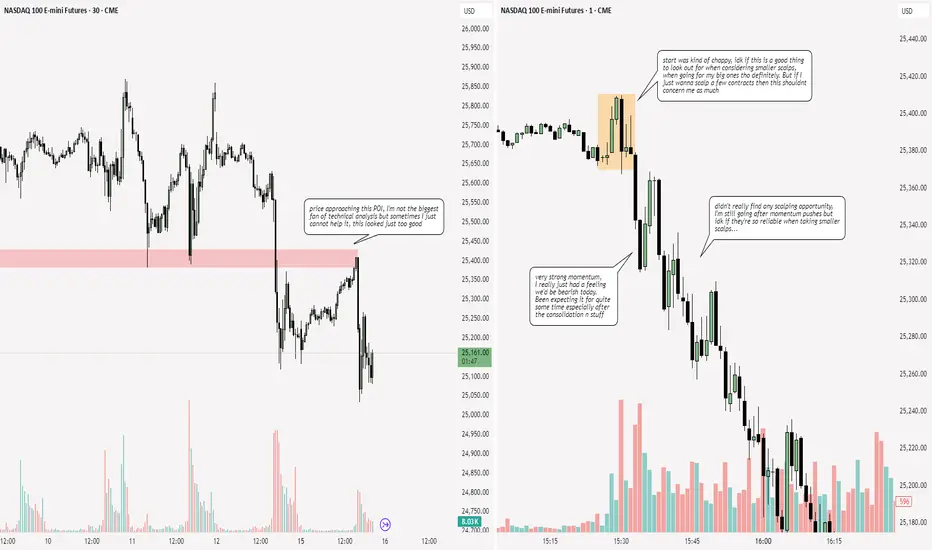
NQ: 260th trading session - recapIdk whether this is exactly the 260th session. I mean even when I started out I guessed on how many sessions I had, now with not posting but still scalping I just figured this is a good number.
After a month of not really being able to lock in due to personal issues I am finally confident in saying that I am back.
Won't scalp on thursday, but I'll skip school on wednesday so I can scalp then.

QQQ- are we going to make a new high or lower high?This is the set up at the moment what do you think?

NQ Power Range Report with FIB Ext - 12/17/2025 SessionCME_MINI:NQH2026
- PR High: 25363.00
- PR Low: 25294.25
- NZ Spread: 154.0
No key scheduled economic events
Session Open Stats (As of 12:25 AM)
- Session Open ATR: 414.92
- Volume: 32K
- Open Int: 246K
- Trend Grade: Long
- From BA ATH: -4.0% (Rounded)
Key Levels (Rounded - Think of these as ranges)
- Long: 26521
- Mid: 25264
- Short: 24008
Keep in mind this is not speculation or a prediction. Only a report of the Power Range with Fib extensions for target hunting. Do your DD! You determine your risk tolerance. You are fully capable of making your own decisions.
BA: Back Adjusted
BuZ/BeZ: Bull Zone / Bear Zone
NZ: Neutral Zone

NQ_F is at an important spot here. Shorts are valid below 50MA.#NQ_F is really struggling to reclaim the 50MA(25200). In weak markets you should be looking to sell bounces that fail and this market is looking weak. 8MA(25458) is trying to cross below the 21MA(25406) with all 3 MA's curling down. I wouldn't be long here unless price can reclaim 25200 and I would be short on tests of 25120 or 25170 that fail or on a hold below 25940 to target 24820, 24775 and the 100MA(24631). Look out below if the 100MA breaks.


NQ Power Range Report with FIB Ext - 12/16/2025 SessionCME_MINI:NQH2026
- PR High: 25373.25
- PR Low: 25280.25
- NZ Spread: 208.0
Temp 25% AMP margin requirements increase
Key scheduled economic events:
08:30 | Average Hourly Earnings
Retail Sales (Core|MoM)
Nonfarm Payrolls
Unemployment Rate
09:45 | S&P Global Manufacturing PMI
S&P Global Services PMI
Session Open Stats (As of 12:55 AM)
- Session Open ATR: 430.72
- Volume: 41K
- Open Int: 168K
- Trend Grade: Long
- From BA ATH: -4.8% (Rounded)
Key Levels (Rounded - Think of these as ranges)
- Long: 26521
- Mid: 25264
- Short: 24008
Keep in mind this is not speculation or a prediction. Only a report of the Power Range with Fib extensions for target hunting. Do your DD! You determine your risk tolerance. You are fully capable of making your own decisions.
BA: Back Adjusted
BuZ/BeZ: Bull Zone / Bear Zone
NZ: Neutral Zone

How to trade every smart money concept: HTF tutorialI talk about trading HTF concepts inside of the smart money world not chasing minutia but paying attention to the larger levels


Big bearmarket on NQ1! I assume the market is going down ca. 5%The Nasdaq (NQ) is a highly liquidity-driven market, dominated by technology stocks that react strongly to interest rates, monetary policy, and institutional positioning. Price movements are often not driven by news itself, but by where liquidity is resting.
Markets tend to move toward obvious highs and lows because that is where stop orders and resting liquidity accumulate. When the Nasdaq trades above prior highs, it often triggers buy-side liquidity, such as stop losses from short sellers and breakout buyers. Once this liquidity is absorbed by larger players, buying pressure can quickly weaken, creating conditions for a reversal lower.
Another key factor is institutional distribution. During extended rallies, smart money often sells into strength while retail traders continue to buy. This distribution typically occurs near range highs, equal highs, or premium price zones, where liquidity is highest. After distribution is complete, price no longer has the support needed to continue higher.
From a liquidity perspective, a decline in NQ is likely when buy-side liquidity above highs has been taken, price fails to hold above key resistance, market structure shifts from higher highs to lower highs, and sell-side liquidity below recent lows becomes the next target.
In such scenarios, the market seeks sell-side liquidity below previous lows, value areas, or unfilled inefficiencies. This downward move is not random but a natural rebalancing process, allowing institutions to enter or re-accumulate at lower, more favorable prices.
In summary, the Nasdaq falls not because of fear or headlines, but because liquidity has already been collected on the upside, and price must move lower to find new liquidity and restore balance.


NQ | WK 51T.A explained -
BackSide (BS)
FrontSide (FS)
Inverse BS (Inv.BS)
Inverse FS (Inv.FS)
BS & FS levels are expected support when dashed lines, tested when dotted and resistance when solid lines.
The inverse is true for the Inv. BS Inv. FS levels, they are resistance as dashed lines, tested as dotted and support as solid lines.
Monthly timeframe is color pink
weekly grey
daily is red
4hr is orange
1hr is yellow
15min is blue
5min is green if they are shown.
strength favors the higher timeframe.
2x dotted levels are origin levels where trends have or will originate. When trends break, price will target the origin of the trend. its math, when the trend breaks, the vertex breaks too so the higher timeframe level/trend that breaks, the more volatility there could be as strength in the orders flow in to fuel the move.

NQ Power Range Report with FIB Ext - 12/15/2025 SessionCME_MINI:NQH2026
- PR High: 25245.25
- PR Low: 25132.50
- NZ Spread: 252.25
No key scheduled economic events
Index futures contract rollover week
Session Open Stats (As of 12:25 AM)
- Session Open ATR: 434.10
- Volume: 17K
- Open Int: 60K
- Trend Grade: Long
- From BA ATH: -4.2% (Rounded)
Key Levels (Rounded - Think of these as ranges)
- Long: 26521
- Mid: 25264
- Short: 24008
Keep in mind this is not speculation or a prediction. Only a report of the Power Range with Fib extensions for target hunting. Do your DD! You determine your risk tolerance. You are fully capable of making your own decisions.
BA: Back Adjusted
BuZ/BeZ: Bull Zone / Bear Zone
NZ: Neutral Zone
