SELL ON NQJust happened to find this setup and wanted to share. Really small SL for reward potential. SL does not need any room. If it goes above the high, the short idea is gone
Trade ideas

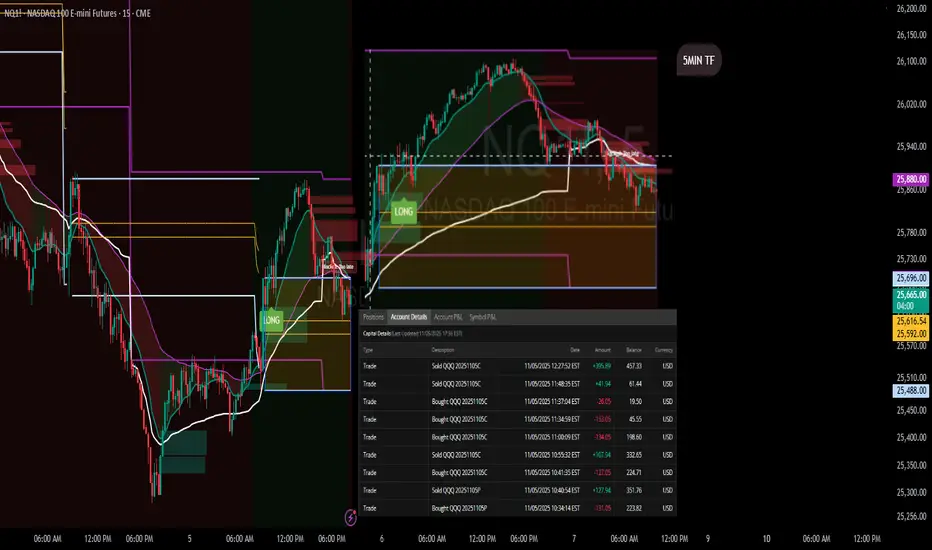
ORB Pro Signal Recap – Nov 5, 2025 | “Respect the Levels”Ticker: QQQ / NQ1! (5-min + 15-min TF)
Strategy: ORB Pro + Trendline Breakdown + Previous Day High Rejection
Focus: Signal confirmation & reaction zones
🧭 Market Context
The morning started strong, with buyers pushing off the open toward the previous day’s high (PDH) and ORB extension zone.
As price tapped the upper band, the ORB Pro system generated a clean long confirmation, aligned with the higher timeframe momentum.
But the rally quickly stalled at the PDH — a textbook reaction zone where the structure shifted.
From there, trendline breakdowns on both 5-min and 15-min charts confirmed exhaustion, and the system correctly prevented new long entries once momentum failed.
💹 Trade Breakdown
Initial Long: Taken on ORB Pro signal confirmation near the intraday retest (strong follow-through into PDH).
Profit-Take Zone: Price rejected sharply at the PDH and VWAP cluster — partials locked.
No Chasing: After the rejection, ORB Pro flagged “Blocked / Too Late,” keeping risk managed while trend flattened.
Result: Finished the day green with multiple small wins across calls — +$89.68 net on the $623C and +$15.89 on $626C.
📊 Performance Summary
Symbol Side Contracts Net Result
QQQ $623C Long 2 +$89.68
QQQ $626C Long 1 +$15.89
QQQ $622P Short hedge 1 –$3.11
Total P/L + $102.46 (Realized)
📈 Chart Recap
Price pushed through the early range with momentum but stopped exactly at the previous day’s ORB high and Fib confluence.
That rejection aligned perfectly with the HTF resistance zone on both 5-min and 15-min TFs.
The chart shows two green “LONG” entries and a clean signal fade once volume dropped —
a prime example of respecting structure over bias.
💡 Key Takeaways
PDH = Reaction Zone: Don’t ignore prior highs — they mark algorithmic defense zones.
Trust the Filters: ORB Pro prevented chasing the failed continuation after PDH rejection.
Structure First: The trendline breakdown confirmed what price was already telling us.
🧘♂️ Reflection
“The system signaled the move early, and I followed structure. PDH rejection confirmed the top, and discipline locked the profit. The goal wasn’t to predict — it was to react with control.”
NQ: 282st trading session - recapSession was pretty alright, learned a couple new things tbh sooo atelast a good experience

Educational Video pt. 2 Found a couple trades and gave some good reasoning on why I would take them ..... 'like' this video

Educational video. Hit the 'LIKE' button if this helped you.This is my thought process on how to trade. If you would like me to post more recorded videos like this.. or even when I am in a trade , please feel free to 'COMMENT' below this video. This is my logic on the market and this is why my name is NASDAQNYK. You dont need 20 indicators on your charts, you dont need anything but your eyes and 3 confluences to determine your typical entry and exit. Trading is only hard when you make it hard.

Tape reading and reasoning for AM trade excecutionMe explaining what SHOULD happen in price over price action and then doing an AM trade review.

REMOVING NASDAQ FROM MY TRADING PLANTransition Note – Focusing Exclusively on EUR/USD
After several months of structured testing and data collection, I’ve decided to permanently remove the NASDAQ (US100) from my analytical framework and trading routine.
While the index offers remarkable volatility and potential, my recent journal review made something clear: the NASDAQ does not align with my strategy’s statistical edge.
The asset’s internal structure — heavily driven by algorithmic order flow and micro-volatility — tends to invalidate setups based on value zones, Wyckoff redistribution, and delta imbalances, which are the core of my system.
In contrast, EUR/USD consistently responds to institutional behavior:
clear dealing ranges and discount/premium rotations,
stronger respect for volume-based structures,
and predictable liquidity flow across sessions.
The data is objective:
• Win rate on NASDAQ – 38%
• Payoff ratio – 1.1:1
• Net result – negative
• Win rate on EUR/USD – 52%
• Payoff ratio – 2.16:1
• Net result – strongly positive
Therefore, all future macro and technical publications will focus exclusively on EUR/USD, with no further NASDAQ breakdowns or updates.
My aim is to refine precision, deepen macro integration (liquidity, yields, policy cycles), and operate where the statistical edge truly exists.
Consistency begins with focus — and mine is now 100% on the euro.

Simple trade Idea, clear bias and excecution.Trading In the direction of the 1H narrative along with judas swing, excecution on the suspension block supporting price, targeting REH's. Simple.

Target areas - NQ price for Market open.11/5/25 - These are the target areas - NQ price for Market open depending if price moves up or down. Will look for trades into these areas.

NQ: 281st trading session - recapWasn't focused today AT ALL, got some personal stuff going on rn but I didn't wanna miss my session, stuck to just mostly glancing at the chart ig
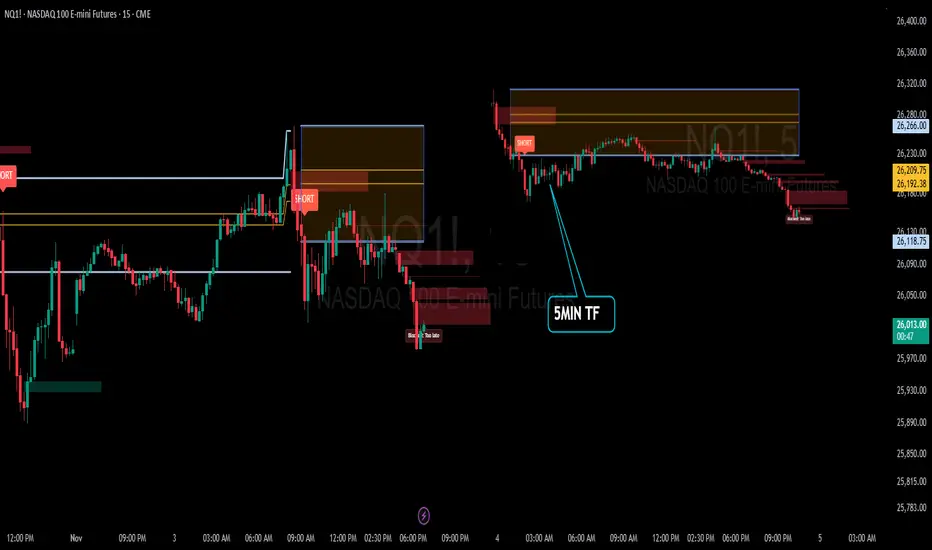
Recap: ORB Pro in Action | “Discipline > Direction”Date: November 3rd 2025
Ticker: QQQ / NQ1! (5-min TF)
Strategy: ORB Pro + Golden Pocket Retest + Volume Filter
Focus: Trend confirmation & controlled execution
🧭 Market Context
The morning opened sideways inside the ORB range — no clean conviction early on.
Around mid-morning, sellers gained control as lower highs formed beneath the EMA band and the Golden Pocket retest (0.5/0.618) failed with volume confirmation.
That break produced the clean short setup of the day, perfectly aligned with the higher-timeframe (HTF) downtrend.
🧠 Trade Review
Early Entries: Entered pre-confirmation and took initial heat.
Mid-Morning Setup: All filters aligned — EMA, volume, HTF direction. This was the textbook short that delivered follow-through.
Late Session Attempts: Momentum faded after lunch, with signals correctly blocked as “Too Late.”
Result: Several small wins offset by early losses, closing the day + $7.34 realized P/L after fees.
📊 Performance Snapshot
Metric Value
Win Rate ≈ 42 %
Best Trade + $287.94
Largest Loss – $189.05
Net Result + $7.34 (Realized)
Setup Accuracy High — execution mixed
📈 Chart Breakdown
The 5-minute chart highlighted a short trigger around 26 260 – 26 280, with smooth continuation into ORB extensions.
The ORB Pro filter marked “Blocked / Too Late” after the move — confirming that the system logic protected capital from late chases.
💡 Key Takeaways
Patience > Prediction — early entries rarely pay off.
Protect Green — partial profit lock once 1 R:R is reached.
System Strength — ORB Pro continues to validate structure when filters align.
🧘♂️ Reflection
“The system nailed the move — I jumped early. Still finished green, proving that execution discipline is the real edge. Tomorrow’s goal: one clean setup, one confident hold, and protect the profit.”
🧩 Next Steps
✅ Wait for full confirmation before entry
✅ Hold until 1:2 R:R min
✅ Avoid re-entries once HTF zone is tapped
NQ: 280th trading session - recapWas pretty cool today, not really any scalpable price action but there were some moments that looked really good...

"Stand by Me"Ben E. King, 1961. Classic Soul, Rhythm & Blues. Inspired by a popular gospel hymn of the South, same title.
Your author wanted to show a clean trading chart, and he also wanted to show his "Stand by Me" chart with its many supports and resistances.
He always trades from a clean 5minute chart. He simply clicks the hide button on & off.
If you switch to a 5m chart and you follow his trading plans you know he "bot" the Dip from 26110 - 26085. He also "bot" the Dip from 26060 - 26010.
You know he is nearly always Long and Short. He "would have" already pocketed much profit from 11.2 open to 11.3 10:15 - the first BTD entry.
You would also know he "started" a new Pawn for a King sequence selling 1 Pawn @ 26079.50 & buying 2 Kings @ 26080.00.
What's up with the quotation marks? Thrice this year he has been flagged as a national security risk. Twice he has been deplatformed and twice his trading account seized. This third time he pulled his account before it could be seized once again, & he deplatformed once again.
Adokimos is the Greek word Paul used in Rom.1:28 to describe our present society. It's a form of insanity. A society that declares itself autonomous from Eternal Truth always ends up here. Such a society perverts good and evil to such an extent that it punishes good and exalts evil.
We do have the best form of human government ever conceived - the culmination of millennia of Judaism and Christianity. We do get the government we deserve. When we choose to throw off self-government, i.e. virtue, we end up with Nihilism, Adokimos, our present society.
John Adams, one of our founding fathers, is well-known for having written, "Our Constitution was made only for a moral and religious people. It is wholly inadequate to the government of any other." Regarding self-government, i.e. individuals governing their behavior by Judeo-Christian ethics, he wrote, "The only foundation of a pure Constitution is pure virtue." "When public virtue is gone, when the national spirit is fled, the republic is lost in essence, though it may still exist in form." "The Declaration of Independence laid the cornerstone of human government upon the first precepts of Christianity."
On this, the eve of the New York mayoral election, Adams wrote this - "...poets read history to collect flowers not fruits - they attend to fanciful images, not the effects of social institutions."
There is so much that is just, pure and virtuous that our founding fathers have left us that many volumes have been written and, unfortunately, rejected by our present society. I will end with this quote from Adams, "The jaws of power are always open to devour, and her arm is always stretched out, if possible, to destroy the freedom of thinking, speaking, and writing." And I shall add - Trading. Adokimos.

Part 2 NWOG saves the dayPart 2 of my short, we renter short. Simple stuff really, NWOG is a black hole.

Long trade
📘 Trade Journal Entry
Pair / Symbol: MNQ1! (Micro E-Mini Nasdaq-100 Index Futures)
Direction: Buy-Side Trade
Date: Mon 3 Nov 25
Time: 1:00 am
Session: London Session AM
Timeframe: 1 Hour
🔹 Trade Details
Metric Value
Entry 26,057.50
Profit Level (TP) 26,390.50 (+1.28 %)
Stop Level (SL) 26,004.00 (–0.21 %)
Risk–Reward (RR) 4.36 R
🔸 Technical Context
Market Structure:
The index has been consolidating after a prior impulsive up-leg from mid-October.
A liquidity sweep below the 26,000 handle and BOS on lower time frames confirmed short-term accumulation.
15min TF Overview
Confluence Factors:
KAMA (Kaufman Adaptive MA) has flattened and begun to curl upward — early momentum shift.
Volume Expansion: Spike during the London open, suggesting institutional re-entry after the weekend gap. Intraday PD Array Alignment: Demand zone and VWAP cluster at 25,980–26,020 confluence zone. Session Overlay: Previous NY session lows have been taken out; London reclaim confirms buyside intent.
Key Zones:
Demand Base: 26,000 – 26,030
Target Zone: 26,380 – 26,400 (liquidity resting above prior London swing highs)
Extended Target: 26,790 (1.618 fib projection of current impulse)
🔹 Narrative & Bias
The setup reflects short-term accumulation within the broader bullish structure, consistent with rotation back into tech futures as the USD consolidates.
The 26,000 psychological level acted as a liquidity magnet — price swept stops, reclaimed structure, and produced a bullish displacement candle.
Macro Sentiment:
Renewed optimism in the Q4 earnings cycle; U.S. indices stabilising post-CPI data.
NASDAQ is outperforming due to sector rotation into large-cap growth (AAPL, ZS, NVDA correlation).
Projection:
Expect price to continue toward 26,390–26,400, with a partial profit zone near the prior swing high and potential continuation to the 26,780 1.618 extension if NY session momentum follows through.


NQ week 45Last weeks chart didn't have the fib levels to guess the tops so the chart quickly became invalid. I added the fib levels this week and posting on the 1hr instead of the 15min timeframe.
T.A explained -
BS & FS levels are expected support when dashed lines, tested when dotted and resistance when solid lines.
The inverse is true for the Inv. BS Inv. FS levels, they are resistance as dashed lines, tested as dotted and support as solid lines.
Monthly timeframe is color pink
weekly grey
daily is red
4hr is orange
1hr is yellow
15min is blue
5min is green if they are shown.
strength favors the higher timeframe.
2x dotted levels are origin levels where trends have or will originate. When trends break, price will target the origin of the trend. its math, when the trend breaks, the vertex breaks too so the higher timeframe level/trend that breaks, the more volatility there could be as strength in the orders flow in to fuel the move.

NQ PULLING BACK TO MAKE A HIGHER HIGH?When the market opens on Sunday, it usually gives you a set up on a buy or sell depending on which way it breaks out of first 5 MINUTE ZONE high or low. This is usually a good entry for retest and a good exit area to make a profit. It may be a good idea to WAIT for the market to pull back and touch the 4hr FVG below before it moves to make a new all-time high.

Possible price forecast, roadmap MNZQ2025 3-7 Nov 25The price will be continue with bearish action the main target will be $ 25855 please be cautious do not trade on Thursday and NFP news

#202544 - priceactiontds - weekly update - nasdaq e-mini futuresGood Evening and I hope you are well.
comment: Two red days to end the month but until the giant gap down to 25350 is closed, nothing matters for the bears. Only below that price we can think about getting down to the bull trend line around 24800 but for now we are 400 points below the ath and the mania continues. I firmly believe the move from 24933 to 26399 was the blow-off-top but no one can tell until we completely reverse it.
current market cycle: bull trend
key levels for next week: 24800 - 26500
bull case: Every dip is heavily bought, even dips so small, you can not even see them properly on the daily chart. Full on fomo in the last inning of this. Only a complete AGI/proper lvl5 self driving can convince me otherwise. This is ‘99 all over and for sure we will get an amazing Michael Lewis book about this. Bulls remain in control until we completely reverse the last move and print below 24800 again. Every short is low probability but great r:r.
Invalidation is below 24900.
bear case: We will most likely test the bigger bull trend line again. As of now, the price action shows nothing bearish. Market is driven by a hand full of stonkz but at this point, no one cares because it’s only going up. No measure of excess matters because the snake-oil salesmen just make up new ones. Again. Nothing about the chart is bearish and until we at least close the gap down to 25350, we can not even think about getting confident about shorts. Yes it’s overbought, overdone, a bubble, whatever have you. Does not help with making money shorting this one bit. Wait.
Invalidation is above 26500.
short term: Neutral.
medium-long term - Update from 2024-11-02: Market went further in the wrong direction so my targets become increasingly unrealistic. Right now the 50% retracement is 21750 and would mean a 18% drop. That’s a bit too much to ask for as of now. 23150 is the breakout-retest of the prior ath from 2024-12 and a more realistic target.

NASDAQ this is my opinion for the week not an advice I hate ath price action but I think it will be better when we start q1 next year
be safe trade good don't burn money and be patient the most important! follow your rules

Potential ShortFriday Price pulled back into 26065 and rejected and started to push back to the downside so I do believe that price could go down and close up the FVG and could push lower.
