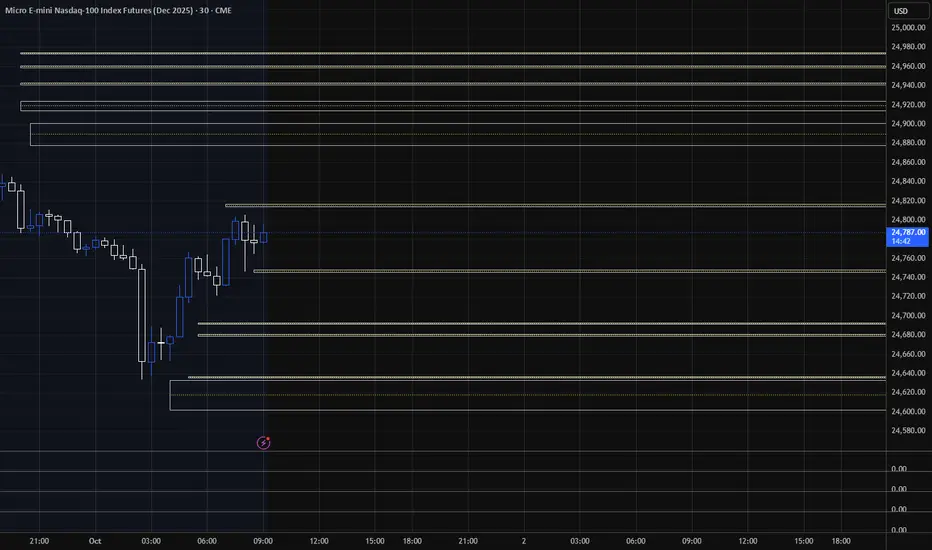
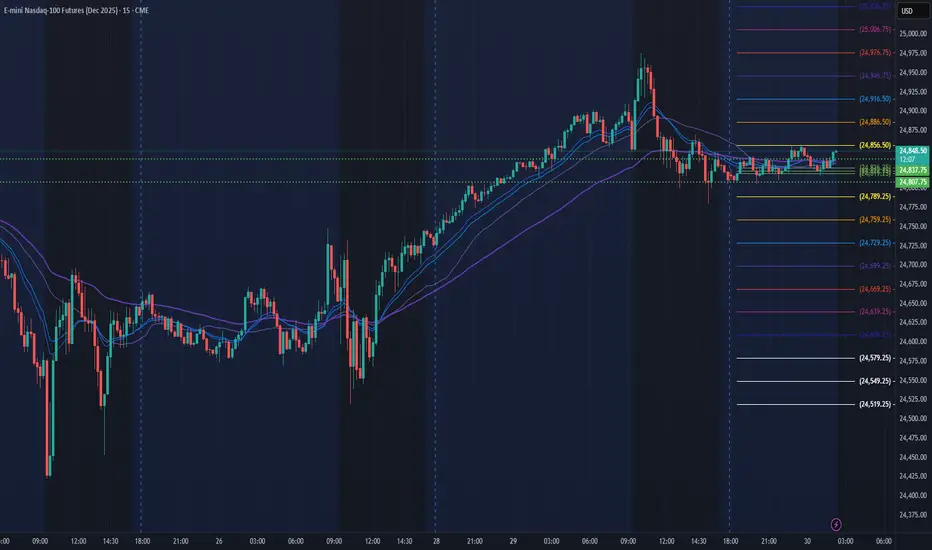
Can NQ1! Push Through $25K+ Resistance Zone?🎯 The Great NQ Heist: Layered Entry Strategy for E-Mini NASDAQ-100 Futures
📊 Market Overview
**Asset:** NQ1! (E-Mini NASDAQ-100 Futures)
**Strategy Type:** Swing/Day Trade - Wealth Accumulation Map
**Bias:** 🐂 **BULLISH**
🎭 The "Gentleman Thief" Layering Strategy
💰 Entry Philosophy: Layer Like a Pro
This setup uses a **sophisticated layering approach** - think of it as strategically placing multiple limit orders to capture the best average entry. You're not going all-in at one price; you're building your position like a chess master.
📍 Suggested Layer Entry Zones:
- 🎯 Layer 1: **24,800**
- 🎯 Layer 2: **24,900**
- 🎯 Layer 3: **25,000**
- 🎯 Layer 4: **25,100**
Note: You can scale in at ANY price level using this layering method. Add more layers based on your position size and risk tolerance. The beauty of this strategy is flexibility - enter where the market gives you opportunity! 🎪
🛡️ Risk Management
Stop Loss Zone: **24,700**
⚠️ **Important:** This is MY stop loss level based on technical structure. However, trading is a personal journey - YOU decide your own risk parameters. Protect your capital first, profits second. Your SL should align with YOUR risk tolerance and account size.
🎯 Profit Target
Target Zone: **25,600** 🚀
This level represents a confluence of:
- 💪 Strong resistance zone
- 📈 Overbought conditions
- Potential bull trap area
**Smart Exit Strategy:** As we approach this zone, consider scaling out of positions. Don't get greedy - take profits when the market offers them!
⚠️ **Reminder:** This is MY target projection. You're the captain of your own ship - take profits when YOU feel comfortable. Trail stops, scale out, or hold for moon - your money, your rules! 🌙
🔗 Related Pairs to Watch
Keep your eyes on these correlated instruments
- SEED_ALEXDRAYM_SHORTINTEREST2:NQ =F** - NASDAQ-100 Futures (spot reference)
- NASDAQ:QQQ - Invesco QQQ Trust (ETF equivalent)
- NASDAQ:AAPL , NASDAQ:MSFT , NASDAQ:NVDA , NASDAQ:GOOGL ** - Top NASDAQ-100 components
- NASDAQ:NDX - NASDAQ-100 Index (cash)
- CME_MINI:ES1! - E-Mini S&P 500 Futures (broader market correlation)
📌 Why these matter:** The NASDAQ-100 is tech-heavy, so major tech stocks drive NQ movement. Watch QQQ for retail sentiment and ES for overall risk appetite. When big tech moves, NQ follows! 💻
🎓 Strategy Breakdown
This "layering" or "scaling-in" approach offers several advantages:
- ✅ **Better average entry** - Dollar-cost averaging into position
- ✅ **Reduced timing risk** - Not dependent on perfect entry
- ✅ **Psychological comfort** - Builds confidence as position develops
- ✅ **Flexibility** - Adapt to market conditions in real-time
📢 Final Thoughts
The market rewards patience and discipline. This layered entry strategy is about working WITH the market, not against it. Whether you're a swing trader holding for days or a day trader scalping ticks, the principle remains: **Control your risk, let profits run.** 🏃♂️💨
✨ **If you find value in my analysis, a 👍 and 🚀 boost is much appreciated — it helps me share more setups with the community!**
**⚠️ DISCLAIMER:** This analysis represents a "gentleman thief" style layered trading strategy intended for educational and entertainment purposes only. This is NOT financial advice. Trading futures involves substantial risk of loss and is not suitable for all investors. Past performance is not indicative of future results. Always trade with risk capital you can afford to lose. Make your own trading decisions based on your personal risk tolerance, account size, and market analysis. 🎭📊
#NQ1 #NASDAQ100 #NASDAQFutures #EminiNQ #FuturesTrading #DayTrading #SwingTrading #TechnicalAnalysis #LayeringStrategy #ScalingIn #TradingSetup #FuturesMarket #TechFutures #NDX #QQQ #RiskManagement #TradingStrategy #MarketAnalysis #BullishSetup
Trade ideas

ES1 & NQ1 Daily Trade Setups 2/10/25IN this update we review th erecent price action in Sp500 & Nasdaq futures contracts and identify the next high probability trade setups and price opbjectives to tatrget. To review today's video analysis click below!

Global Financial Markets and Their Structure1. Overview of Global Financial Markets
Financial markets can be broadly defined as platforms where financial instruments are traded between buyers and sellers. They can be categorized based on:
Type of instruments traded – equities, bonds, currencies, derivatives, commodities, and digital assets.
Maturity of instruments – money markets (short-term) and capital markets (long-term).
Trading mechanism – exchange-traded markets and over-the-counter (OTC) markets.
Geographical scope – domestic markets and international markets.
Globally, financial markets operate continuously, interconnected through electronic trading platforms and international financial institutions. The growth of globalization, financial liberalization, and technological innovation has significantly expanded the depth, liquidity, and efficiency of these markets.
2. Types of Global Financial Markets
2.1 Capital Markets
Capital markets are platforms for long-term funding where securities with maturities of more than one year are traded. They include:
Equity Markets: Where shares of publicly listed companies are issued and traded. Examples include the New York Stock Exchange (NYSE), London Stock Exchange (LSE), and Tokyo Stock Exchange (TSE). Equity markets facilitate capital raising for companies and provide investors an opportunity to participate in corporate growth.
Debt Markets (Bond Markets): Where government, corporate, and municipal bonds are issued and traded. Bond markets are crucial for governments to finance infrastructure projects and for corporations to raise long-term funds. Major debt markets include the U.S. Treasury market, Eurobond market, and corporate bond markets in Europe and Asia.
2.2 Money Markets
Money markets deal in short-term debt instruments, usually with maturities of less than one year. They provide liquidity and fund management solutions for governments, financial institutions, and corporations. Instruments include:
Treasury bills
Commercial paper
Certificates of deposit
Repurchase agreements
The money market is critical for maintaining liquidity and controlling short-term interest rates in the global economy.
2.3 Foreign Exchange (Forex) Markets
Forex markets are the largest financial markets globally, with an average daily turnover exceeding $7 trillion. They enable the trading of currencies for international trade, investment, speculation, and hedging. Forex markets operate 24 hours due to time zone differences across London, New York, Tokyo, and Sydney.
Major participants include central banks, commercial banks, hedge funds, multinational corporations, and retail traders. The forex market significantly influences global trade balances, monetary policy, and capital flows.
2.4 Derivatives Markets
Derivatives markets facilitate trading of contracts whose value is derived from an underlying asset. Common derivatives include:
Futures
Options
Swaps
Forwards
Derivatives are used for hedging, speculation, and arbitrage. Key markets include the Chicago Mercantile Exchange (CME), Eurex in Europe, and the Dubai Mercantile Exchange. Derivatives markets play a crucial role in risk management but also introduce systemic risks if leveraged excessively.
2.5 Commodity Markets
Commodity markets deal with the trading of raw materials like oil, gold, metals, agricultural products, and energy resources. They are classified as:
Physical Markets: For actual delivery of commodities.
Futures Markets: For trading standardized contracts with future delivery dates.
Major commodity exchanges include the London Metal Exchange (LME), Chicago Board of Trade (CBOT), and Multi Commodity Exchange of India (MCX). Commodity markets are vital for price discovery, risk management, and hedging against inflation.
2.6 Digital and Crypto-Asset Markets
The rise of blockchain technology has given birth to digital asset markets, including cryptocurrencies, stablecoins, and central bank digital currencies (CBDCs). These markets offer decentralized financial solutions, new investment opportunities, and cross-border payment efficiencies. Exchanges like Coinbase, Binance, and Kraken operate globally, while central banks experiment with digital currencies to improve payment systems and monetary policy implementation.
3. Key Participants in Global Financial Markets
3.1 Institutional Investors
Institutional investors include mutual funds, hedge funds, insurance companies, pension funds, and sovereign wealth funds. They are major drivers of capital flows and market liquidity. Their strategies often involve asset allocation, risk management, and long-term investment horizon.
3.2 Retail Investors
Retail investors are individual participants who invest in stocks, bonds, mutual funds, and other securities. They represent a significant portion of market activity, especially in developed economies with well-established broker networks and electronic trading platforms.
3.3 Corporations
Corporations participate as issuers of equity and debt instruments, seeking funding for expansion, research, and capital projects. They also engage in currency hedging, commodity contracts, and derivative trading to manage operational and financial risks.
3.4 Governments and Central Banks
Governments issue sovereign bonds to fund fiscal deficits and infrastructure projects. Central banks control monetary policy, manage interest rates, stabilize currency values, and intervene in foreign exchange markets to influence capital flows and inflation.
3.5 Intermediaries
Banks, brokers, dealers, and market makers facilitate transactions, provide liquidity, and offer advisory services. Investment banks play a critical role in underwriting, mergers and acquisitions, and structuring complex financial instruments.
4. Structure of Global Financial Markets
The structure of global financial markets can be examined through market segmentation, interconnectedness, and regulatory frameworks.
4.1 Primary and Secondary Markets
Primary Market: Where new securities are issued for the first time, such as IPOs and bond issuances. Capital raised in primary markets finances business expansion and government projects.
Secondary Market: Where existing securities are traded between investors. Secondary markets provide liquidity, facilitate price discovery, and help determine the cost of capital.
4.2 Exchange-Traded vs Over-the-Counter Markets
Exchange-Traded Markets: Transactions occur on regulated exchanges with standardized contracts and transparency (e.g., NYSE, CME).
OTC Markets: Trades are bilateral agreements between parties, often customized and less transparent (e.g., forex forwards, swaps).
4.3 Segmentation by Geography and Time Zone
Global financial markets are interconnected across regions:
Asia-Pacific Markets: Tokyo, Shanghai, Hong Kong, Singapore, and Sydney.
European Markets: London, Frankfurt, Paris, and Zurich.
Americas Markets: New York, Toronto, and Chicago.
Time zone differences create continuous trading opportunities, but also pose risks of volatility spillovers and information asymmetry.
4.4 Market Integration
Integration occurs through capital mobility, cross-border investment, and harmonized regulations. Fully integrated markets enable diversification, lower cost of capital, and efficient resource allocation. Partial integration often results in fragmented liquidity and regional discrepancies in pricing.
5. Instruments Traded in Global Financial Markets
5.1 Equity Instruments
Equities provide ownership in companies and the right to dividends. They are traded on stock exchanges or OTC platforms. Variants include:
Common stock
Preferred stock
Depository receipts (e.g., ADRs, GDRs)
5.2 Debt Instruments
Debt instruments provide fixed or floating returns to investors. They include:
Government securities (treasuries, gilts)
Corporate bonds
Municipal bonds
Floating rate notes
5.3 Derivatives Instruments
Derivatives derive value from underlying assets and are used for hedging or speculation. Types include:
Futures contracts
Options contracts
Swaps (interest rate, currency, credit)
Forwards
5.4 Hybrid Instruments
Hybrid instruments combine features of debt and equity, such as convertible bonds, preferred shares, and structured notes. They offer flexibility in risk and return profiles for investors.
5.5 Alternative Instruments
Alternative instruments include commodities, real estate investment trusts (REITs), private equity, venture capital, and digital assets. These instruments enhance portfolio diversification and risk management.
6. Functions of Global Financial Markets
Financial markets perform several critical functions:
Capital Allocation: Efficiently channel funds from savers to borrowers for productive investment.
Price Discovery: Determine fair prices of financial instruments through supply and demand dynamics.
Liquidity Provision: Allow participants to buy or sell assets quickly without significantly impacting prices.
Risk Management: Provide tools like derivatives to hedge against market, credit, and currency risks.
Information Dissemination: Reflect economic, corporate, and geopolitical information in prices.
Economic Growth Support: Facilitate investment in infrastructure, innovation, and industry expansion.
7. Regulation of Global Financial Markets
Regulation ensures stability, transparency, and investor protection. Key regulatory frameworks include:
United States: Securities and Exchange Commission (SEC), Commodity Futures Trading Commission (CFTC), Federal Reserve.
Europe: European Securities and Markets Authority (ESMA), national regulators like FCA (UK), BaFin (Germany).
Asia-Pacific: Securities and Exchange Board of India (SEBI), China Securities Regulatory Commission (CSRC), Monetary Authority of Singapore (MAS).
Regulation covers market conduct, disclosure requirements, capital adequacy, trading limits, anti-money laundering, and risk management. Cross-border coordination is vital due to globalization of financial markets.
8. Trends and Innovations
8.1 Technological Advancements
Algorithmic and High-Frequency Trading (HFT): Use of automated systems to execute trades at microsecond speeds.
Blockchain and Distributed Ledger Technology: Facilitate transparent, secure, and decentralized transactions.
Robo-Advisors: Automated investment advisory platforms improving accessibility for retail investors.
8.2 Globalization and Integration
Capital flows across borders, with emerging markets increasingly participating in global investment. Financial integration allows diversification but increases vulnerability to external shocks.
8.3 Sustainable and ESG Investing
Environmental, Social, and Governance (ESG) factors are increasingly incorporated in investment strategies, impacting capital allocation and corporate behavior.
8.4 Digital Currencies
CBDCs and cryptocurrencies are transforming cross-border payments, monetary policy transmission, and investment opportunities.
9. Challenges in Global Financial Markets
Volatility and Systemic Risk: Interconnectedness can transmit shocks rapidly across borders.
Regulatory Arbitrage: Firms may exploit differences in national regulations.
Cybersecurity Threats: Digitalization exposes markets to hacking and fraud.
Liquidity Mismatches: Especially in emerging markets or during crises.
Currency and Interest Rate Risks: Global flows are affected by exchange rate fluctuations and monetary policy divergence.
10. Importance for Investors, Traders, and Policymakers
10.1 Investors
Understanding market structure helps in portfolio diversification, risk management, and strategic allocation of capital across geographies and asset classes.
10.2 Traders
Market structure knowledge is critical for developing trading strategies, exploiting arbitrage opportunities, and managing intraday and long-term market risks.
10.3 Policymakers
Insights into market behavior, liquidity conditions, and capital flows assist in macroeconomic policy, regulation, and crisis management.
Conclusion
Global financial markets are the lifeblood of the modern economy. Their structure is vast and multi-layered, encompassing diverse instruments, participants, and functions. Efficient, transparent, and integrated markets enhance economic growth, facilitate investment, and support risk management. At the same time, challenges such as systemic risk, regulatory complexity, and technological disruption demand vigilance from all participants.
For investors, traders, and policymakers, understanding the structure and functioning of these markets is essential to navigate global capital flows, identify opportunities, and mitigate risks. As markets evolve with technology, sustainability concerns, and financial innovation, continuous learning and adaptation are key to thriving in this dynamic global financial ecosystem.
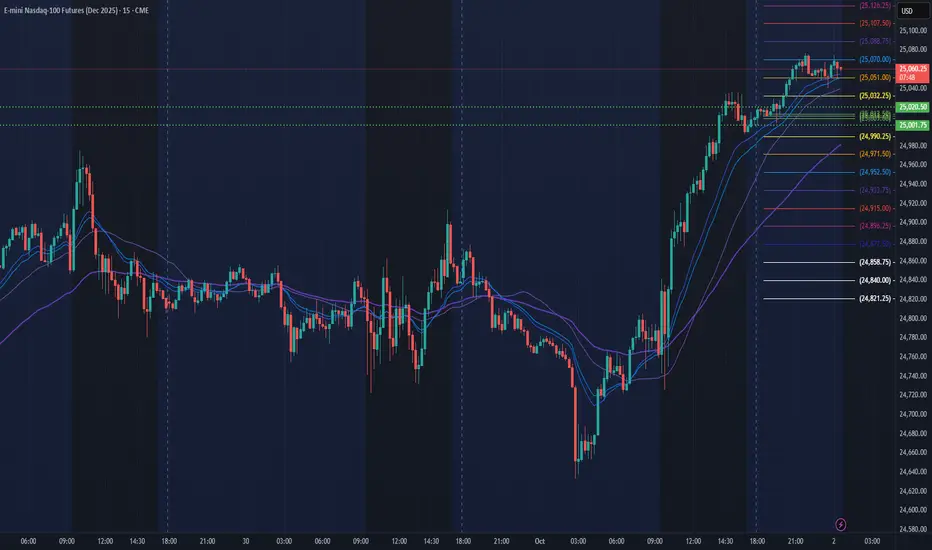
NQ Power Range Report with FIB Ext - 10/2/2025 SessionCME_MINI:NQZ2025
- PR High: 25020.25
- PR Low: 25001.75
- NZ Spread: 41.5
Key scheduled economic events:
08:30 | Initial Jobless Claims
ATH push continues
Session Open Stats (As of 12:15 AM)
- Session Open ATR: 271.02
- Volume: 21K
- Open Int: 285K
- Trend Grade: Long
- From BA ATH: -0.0% (Rounded)
Key Levels (Rounded - Think of these as ranges)
- Long: 25204
- Mid: 23571
- Short: 21939
Keep in mind this is not speculation or a prediction. Only a report of the Power Range with Fib extensions for target hunting. Do your DD! You determine your risk tolerance. You are fully capable of making your own decisions.
BA: Back Adjusted
BuZ/BeZ: Bull Zone / Bear Zone
NZ: Neutral Zone
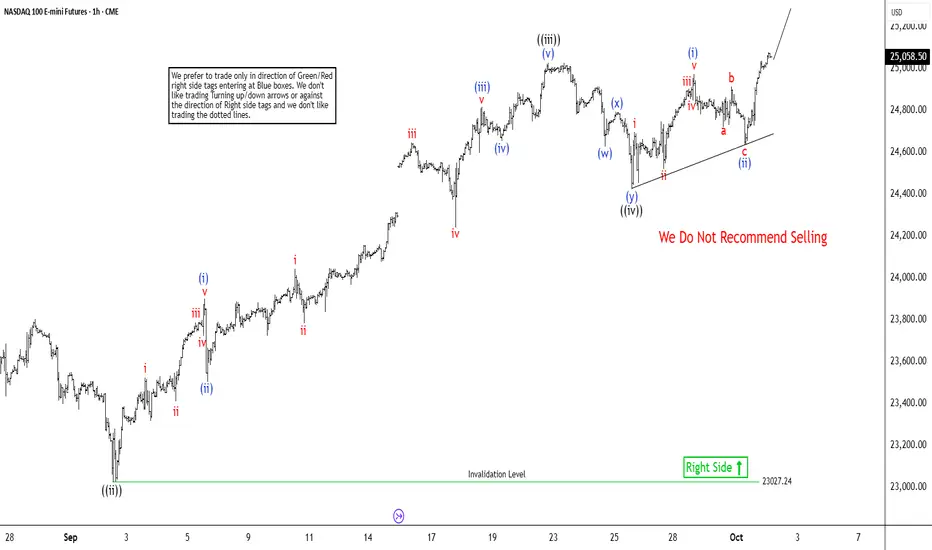
Nasdaq (NQ) on Track for Higher Wave 5 FinishThe short-term Elliott Wave analysis for the Nasdaq (NQ) reveals a bullish cycle initiated from the August 2, 2025, low, progressing as a five-wave impulse structure. Wave ((i)) surged to 24,068.5. The corrective wave ((ii)) concluded at 23,025.25, as depicted in the one-hour chart. The Index then advanced in wave ((iii)) to 25,027.25. This wave developed as an impulse in a lesser degree, showcasing robust bullish momentum in the market.
From the wave ((ii)) low, wave (i) climbed to 23,902. A brief dip in wave (ii) stabilized at 23,505. Wave (iii) rallied to 24,816. A minor pullback in wave (iv) ended at 24,655. The final leg, wave (v), reached 25,027.25, completing wave ((iii)) in the higher degree. The subsequent wave ((iv)) correction unfolded as a double-three Elliott Wave structure, a common pattern in such cycles. From wave ((iii)), wave (w) declined to 24,627. Wave (x) recovered to 24,793.50. Wave (y) then dropped to 24,422.5, finalizing wave ((iv)).
As long as the pivotal low at 23,027.2 remains intact, the Index is expected to extend higher in wave ((v)). This outlook supports continued upside in the near term, consistent with the impulsive structure’s progression and market dynamics.
Nasdaq Buy idea Based on previous data Nasdaq should expect a push upwards. I’ve marked charts with reasoning and added SL and TP levels. Good luck


day 7 trading 100 to 1,000,000I over traded today with a total of 15 trades on average 10$ per loss. will be back tomorrow.

Short on ifvg ICT concepts Am session Model 7am buyside swept took a short in the ifvg back down to the 7am Low 62 points

Target areas - NQ price for Market open.10/1/25 - These are the target areas - NQ price for Market open depending if price moves up or down. Will look for trades into these areas.
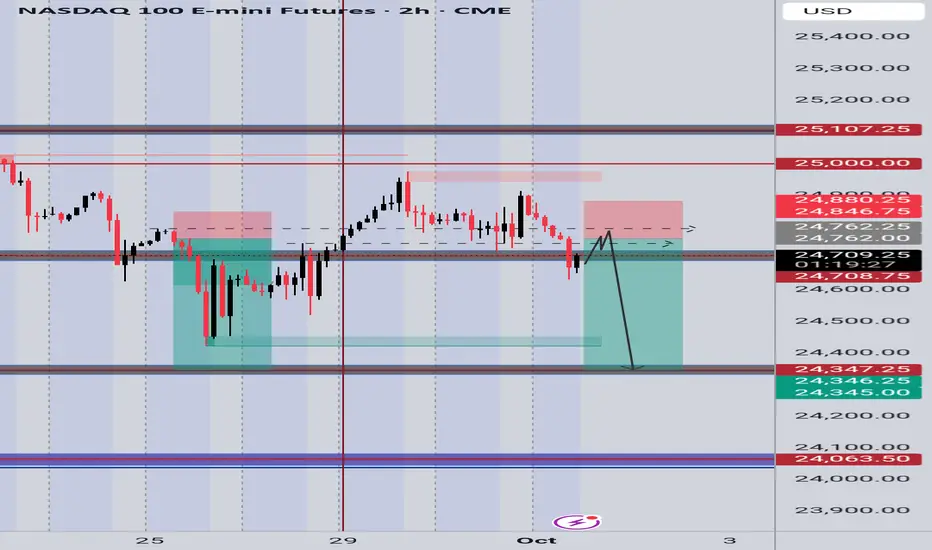
NASDAQ 100 E-mini Futures (NQ1!) Sell SetuSell Confirmation: Price rejected from the 25,000 – 25,107.25 resistance zone with strong bearish candles, signaling exhaustion of buying pressure.
Entry Trigger: Break and close below 24,762.25 confirms bearish continuation.

NQ Power Range Report with FIB Ext - 10/1/2025 SessionCME_MINI:NQZ2025
- PR High: 24876.75
- PR Low: 24822.00
- NZ Spread: 122.25
Key scheduled economic events:
08:15 | ADP Nonfarm Employment Change
09:45 | S&P Global Manufacturing PMI
10:00 | ISM Manufacturing PMI
- ISM Manufacturing Prices
Session Open Stats (As of 12:15 AM)
- Session Open ATR: 265.39
- Volume: 26K
- Open Int: 279K
- Trend Grade: Long
- From BA ATH: -1.0% (Rounded)
Key Levels (Rounded - Think of these as ranges)
- Long: 25204
- Mid: 23571
- Short: 21939
Keep in mind this is not speculation or a prediction. Only a report of the Power Range with Fib extensions for target hunting. Do your DD! You determine your risk tolerance. You are fully capable of making your own decisions.
BA: Back Adjusted
BuZ/BeZ: Bull Zone / Bear Zone
NZ: Neutral Zone
Short Trade Idea for 9/30 | NQI’m anticipating price to either push into the 1H bearish imbalance at 24,894 or reject from the NWOG around the 24,856 range before turning lower toward the 24,640.00 range. My bias is firmly short for now — but I’ll reassess as we approach the open.

Long NQDon’t go in heavy on this one — it could be the start of a reversal. Go long, but keep your position size reasonable.
I’d say it’s about 70:30 in favor of the bulls. I still prefer buying over selling, even though there’s some visible weakness. That weakness is likely just the result of stop-losses being triggered above previous highs, and price might still aim to take out the next highs.

NASDAQ – Decision Point is Now: Breakout or Breakdown?📈🔍 NASDAQ at Key Inflection – Momentum or Meltdown? ⚠️💥
Hey Traders,
The NASDAQ 100 is now standing right at the make-or-break zone: 22,655. This level marks a critical retest of the recent breakout, and what happens here could define the next major move.
🔵 The Setup:
After a strong bounce and sharp rally from below 18K, we've climbed back into the tight ascending structure. But momentum is slowing…
This zone could produce either a bullish continuation to new highs — or a brutal rejection that unwinds the entire move.
📍 Structure Speaks:
Holding above 22,655 = likely continuation
Breakdown = deeper pullback toward 20,000 and lower channel support
Momentum names like NVIDIA are doing the heavy lifting again — but can they sustain the market alone?
📊 What I'm Watching:
Bullish path = measured target ~25,000+
Bearish path = test of the broader trendline near 20,000 or even the 18,200 region
Macro signals still mixed — stay nimble, not married to one bias
⚠️ Stay Sharp:
Just like in crypto, the Nasdaq can punish both bulls and bears when it enters chop mode. Structure and discipline remain your best defense.
I’ve updated the chart — fresh out the oven 🍞 — and more market ideas are following, including BTC, ETH, and BTC Dominance.
One Love,
The FXPROFESSOR 💙
Disclosure: I am happy to be part of the Trade Nation's Influencer program and receive a monthly fee for using their TradingView charts in my analysis. Awesome broker, where the trader really comes first! 🌟🤝📈

NQ: 263rd trading session - recapWon't trade tomorrow nor the day after that. It is unfortunate but atleast we're in a spot of where price is now least likely to show real strong signs of a bearish pullback / reversal
Target areas - NQ price for Market open.9/30/25 These are the target areas - NQ price for Market open depending if price moves up or down. Will look for trades into these areas.

30 sept DOWN NASDAQshort in nasdaq.
looking at weaknes in daily.
entry in blue
stop in red.
target in green.
have fun
all details of the trade are explained on the video
Electra 33

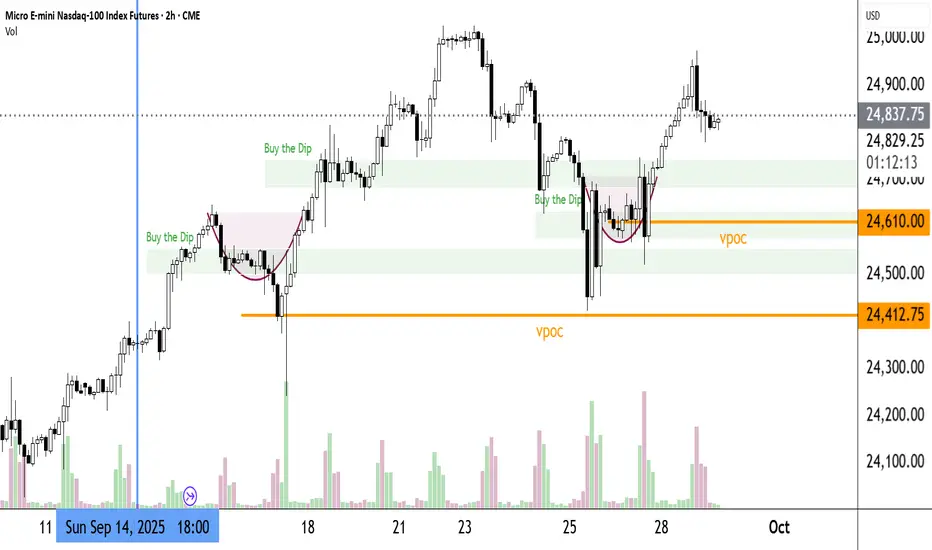
Such a Beautiful ChartMust be published.1.Ascending Triangle 2.Magnificent Resistance 3.Much more besides. Take it all in. Breakout, Buy the Dips and Pivots. Much fertile ground.

NQ Power Range Report with FIB Ext - 9/30/2025 SessionCME_MINI:NQZ2025
- PR High: 24837.75
- PR Low: 24807.75
- NZ Spread: 67.0
Key scheduled economic events:
09:45 | Chicago PMI
10:00 | CB Consumer Confidence
- JOLTS Job Openings
Session Open Stats (As of 12:15 AM)
- Session Open ATR: 267.05
- Volume: 16K
- Open Int: 274K
- Trend Grade: Long
- From BA ATH: -0.7% (Rounded)
Key Levels (Rounded - Think of these as ranges)
- Long: 25204
- Mid: 23571
- Short: 21939
Keep in mind this is not speculation or a prediction. Only a report of the Power Range with Fib extensions for target hunting. Do your DD! You determine your risk tolerance. You are fully capable of making your own decisions.
BA: Back Adjusted
BuZ/BeZ: Bull Zone / Bear Zone
NZ: Neutral Zone
NQ1/NDX - LONG TO FINAL BOSSGood Morning,
Long till final boss. We saw NDX take a pull-back in last weeks session. Since there has been some great momentum and now we are seeing a break out of consolidation into what is looking like a pretty nice run.
EMA 9 crossed EMA 50 - Breakout from consolidation and en route to break about previous highs.
Keep on eye on the 9 & 50 EMA as the trade progresses upwards. Break below these moving averages would suggest more consolidation until the new trend is determined.
Trade Safe Enjoy!

Face Value: Poised to go up1.Fundamentals of growth are good.
2.Q2 est. 3.8% growth
3.Q3 growth tracking @ 3.9% growth
4.Projections of $45/barrel oil in 2026
5.Many other favorable reasons
On the other hand
Jerome Powell and the Federal Reserve say that they focus on supply-demand balance: when demand outpaces supply prices go up, and we have inflation. Therefore, so they conclude, we must keep interest rates high so people can't afford anything.
Common sense says if you lower interest rates the money necessary for production will be less expensive, the supply will increase and prices will go down, as will inflation.
Their view of ''supply-demand balance'' sounds like nonsense. I think common sense wins every time.
The chart appears to be building a new base from which to head upwards. I'd like to see it go lower, but my Breakout trades are in place and I'm ready for the Breakout if it happens here.
If this does become a new base, barring a Black Swan event, we should see a new high soon.