Emini Nasdaq 100. 10.10.2025, WalkthroughCME_MINI:MNQ1!
One-sided expansion after Trump announcement on China tariffs. A geopolitical event and major liquidation across the board.
Trade ideas

A Pawn for a King: Freefall - Extra Content I love charts. I know you can see the beauty and intricacies of this one and how it relates to our A Pawn for a King trading plan.
What a terrific money-making freefall. What a magnificent double bottom, bouncing on the 50- day sma. If you don't get excited observing this - you better check to see if you still have a pulse.
I am compelled to publish this chart as a sequel to my prior idea. They go together like peanut butter and jam.
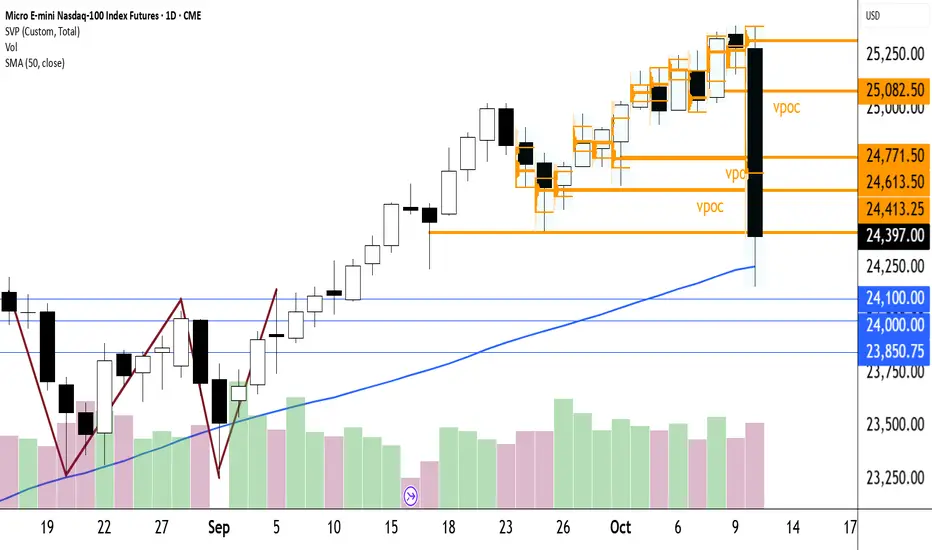
I'm guessing there is a vpoc near the neck of that monumental W. I'm only able to get 21 or 22 days of svps on my chart. Does anyone know how to get more?
Isn't it a thing of beauty that the 50-day sma checked the 10.10. freefall? That's something to get excited about.
Let's see what happens. Whenever and wherever it bounces, we are ready to pounce with an arsenal of Breakout Trades, Buy the Dip Trades, Buy the Pivot Trades and A Pawn for a King Trades.
Some day. Some Golden Day...
A Pawn for a King: Freefall - Panic time? No way! This is where we stick the landing and win the gold!
Why is Paul Bunyan often depicted as a smiling, cheerful character? Why is he portrayed as a confident I can do this man? We all know why. It is because he is a man who is good at what he does, a man who can proudly say look at what I have accomplished, not in a braggadocios way but in a way of feeling delight in a job well done. It is his force multiplier - his great size and strength - that enable him to be so. We admire him for his character. We are drawn to him for his character. He realizes his full potential in life using his innate unique abilities and opportunities in a cheerful and humble attitude.
Let us now apply Bunyan's example to further illustrate the benefits of A Pawn for a King trading plan using the price action on Friday, 10.10.2025 as an example of its simplicity and its built-in force multiplier.
Let us pick up with our real-life example where we left off on my prior published idea. Everything is real. Only the names have been changed to protect the innocent.
Let us recall how the trade started. We waited for a good bounce on a strong support. Then we entered the trade by buying 2 MNQ contracts @ 24,994.5 and we sold 1 MNQ contract @ 24,994.
We then added 22 points to each of those entries - we bot 2 contracts @ 24,994.5 + 22 = 25016.5 and we sold 2 contracts @ 24,994 + 22 = 25016. Do NOT miss the subtlety. Our first trade we sold ONE contract. On this second and all subsequent trades, we will sell TWO contracts. This subtlety is the key to this plan. It is the force multiplier. When the pull back happens, and we all know it will, we have a secret weapon that enables us to do away with those awful things called stop losses, I meantersay, who's in this to lose? Instead of that losing proposition we have Paul Bunyan. We are Paul Bunyan!
We left off with $1,247.38 profit and we have just sold 2 contracts @ 25,390 and we bot 2 contracts @ 25,390.5. We are still 1L.
The px plummets. Do we plummet as well? NO WAY! We've got a force multiplier! That initial ONE contract we sold at the outset.
So, what do we do? That is a very simple question to answer. We wait for the next bounce at a strong support. This hasn't happened yet. We have a strong support in the area of 24,100 - 24,000. Whenever and wherever that bounce happens, we start the A Pawn for a King plan again. We sell 1 contract, and we buy 2 contracts $.50 above that. Remember how we were 1L when the px plummeted? Well now we are two long and no stop loss got in our way.
Now the force multiplier comes in. Let's say it bounces at 24,000 and we sell 1 contract @ 24,000 and we buy 2 @ 24,000.50. We add 22 points to each number, and we sell THREE contracts @ 24,000 +22 = 24,022 and we buy THREE contracts @ 24,000.50 + 22 = 24022.50.
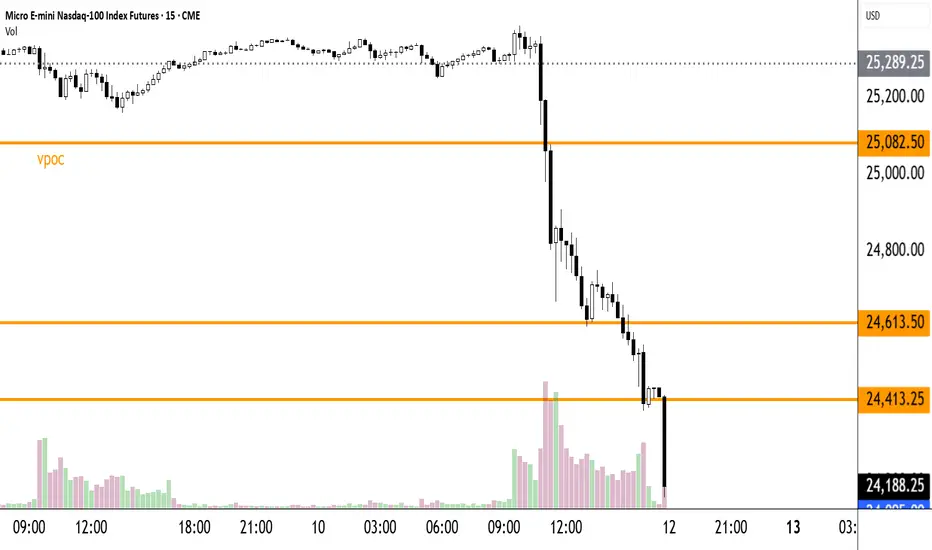
The dark orange lines on my charts are vpocs. If you're not familiar with them learn about them and have them as a key part of your strategy. They are very powerful px magnets, places where buyers and sellers have met in the past and therefore very likely to meet again. Think strong support. Watch and wait for a good bounce on a strong support. Be patient. It will happen and you will be locked and loaded.
I hope you can see that rather than getting stopped out of a trade we turned our initial -1 contract into a force multiplier. In essence we just turned that px plummet into a gain of whatever that plummet was.
If we do get in again @ 24,000.5 this is what it will look like: 25,390.5 (our last entry) - 24,000.50 = 1,390 points x $2.00 per point - $1.82 (commission and fees) = $2,778.18. Did we lose that? No way. We made sure our account could handle the margin required for that. The intraday margin requirement for 1 contract is $100.00 with NinjaTrader and the Initial Margin requirement, although it varies, is usually about $3,400.00.
What if the px does not get back up to 25,390.5 before roll-over? That is when you will take a loss. But you will have made so much profit in the meantime, that won't matter much.
What if the px never bounces but just keeps falling? If that is the case, you'll have much greater problems than $$$. It will be time to put your head between your legs and kiss your sweet ass good-bye.
If you conclude that the best time to start this plan with real $$$ is right after roll-over time, you would be right. That is one of the wonders of demo trading. Also, some practice will be most necessary for you to master the subtleties of this plan.
As always, thank-you for your time in reading this. Forgive any typos or math errors. For some strange reason this fellow doesn't always catch them in time. Stay tuned for further notes. Or shall we call them afterthoughts?
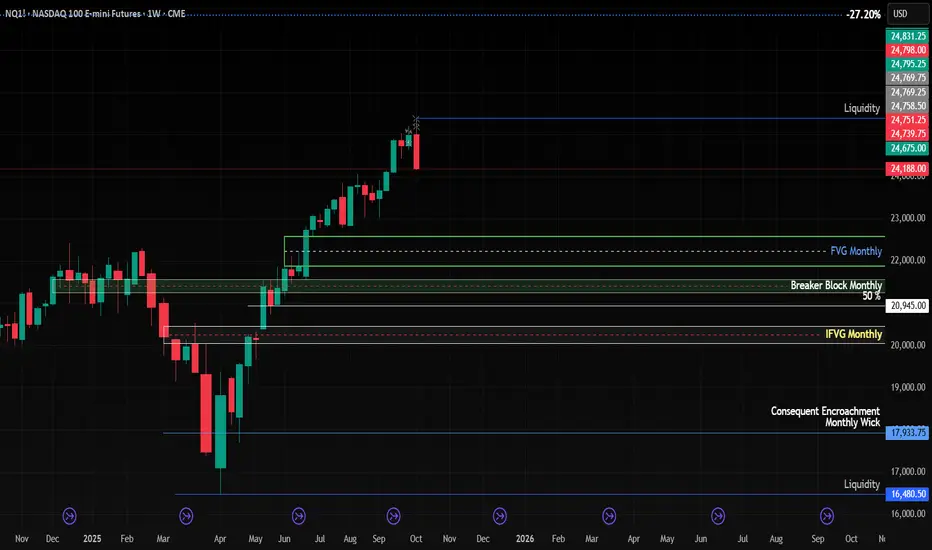
Bullish MONDAY Price dipped into the long term weekly FVG
And respected it now. My thoughts are Monday could be a bullish day where price start to rally back up because we are in a very deep discount right now and have lots of range to cover so I think we could see some upside objectives.
also if we open and Gap down then there’s a big change we continue lower but I hope that is not the case because it would become a full on market crash. this is a minor correction nothing major

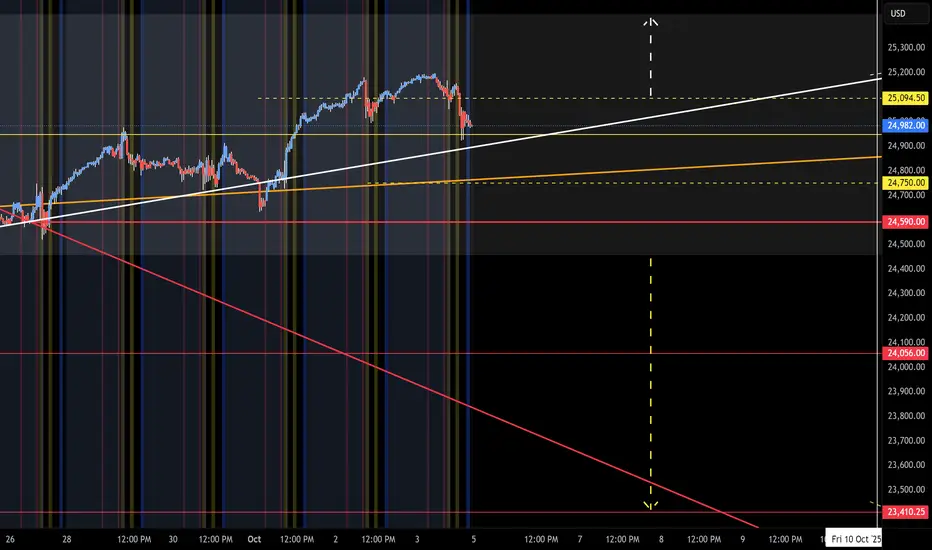
Key levels for reversals back to the upsideI’ve marked key levels where I believe the market could potentially reverse to the upside, allowing the bull run to resume. Of course, fundamentals and news can quickly change the market’s direction, but this represents my current technical analysis that I’ll be monitoring closely.
NQ UpdateFutures dropped afterhours when Trump announced 100% tariffs on China, so expect a gap down Monday.
Funny thing is, I wasn't very bullish because of that open gap, I added to my KSS puts this morning before the market got Trumped. Was wondering if that was a mistake for about 5 minutes, lol. Lucky or not, timing is everything. Wish it was announced yesterday morning when I had even more puts. Oh well.
In any case, RSI and MFI both went oversold, I was expecting MFI to go oversold which is why I did not go long on stocks this morning. Can't use 3hr indicators during a tank, the market will whipsaw it's way down just like April. Daily indicators might be of some help if this spring repeats.
I also suspected something fishy going on, retail was weak all week, which is why I was shorting KSS, along with the H&S pattern I posted. HD has been tanking for an entire month, there are always people that have inside info, probably Trumps brokers, lol. I'm sure he's feeding info to his family and friends, it's the biggest inside trader scam EVER.

MASSIVE CORRECTION IN PLAY This is my analysis for next week the Top on NQ is finally placed and once we close below the previous weeks low today. Shorts is the play next week aiming for all daily lows and old SIBI
Not financial advice just my opinion :)

Target areas - NQ price for Market open.10/10/25 - These are the target areas - NQ price for Market open depending if price moves up or down. Will look for trades into these areas.

NQ Range (10-06-25, Week 2)Churning in the Churn Zone, back at Mid Level (ML) of range. Watch the 2 yellow dash levels, break to upper/lower churn range is redirect or counter move. Example, White arrow range play stall at 425 should reject to start or lower yellow arrow. Reverse that should NAZ drop to the start or yellow arrow (unless it is the big one). Still favoring the SHORT side and not chasing any upward moves. Go Fed, Tweets, Next Stimulus, Wash ST Capital Management & Margin Services, etc. Just seems like the lift on fumes is good set up for the counter move (if you can play that, example Wash St Hedge Fund). Ya think? No, why not?
Liquidity Sweep on 4H TF know to mark out all the session highs and lows, the one-hour highs and lows, and the four-hour highs and lows, and then wait for a liquidity sweep, then wait for a break of structure, inverse fair value gap, or a 79% extension closure? And then following that, look for a fair value gap getting filled, order block, breaker block, equilibrium getting filled, and then scale down to the one-minute time frame, look for a break of structure, inverse fair value gap, or 79% extension closure, looking for the trend to continue in the right direction, and then take profits at the previous draws on liquidity that haven't been hit yet

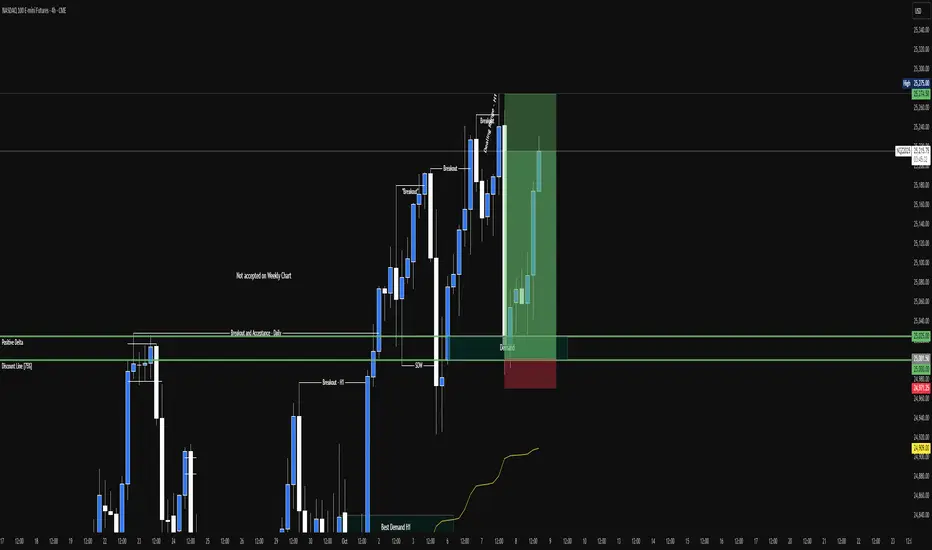
NASDAQ - LONG SETUPTechnical Context
The NASDAQ futures confirmed a breakout and acceptance above the previous H1 dealing range, maintaining strong bullish efficiency.
The breakout originated from the Aggressive Demand zone, aligned with the vPOC + VAL confluence (Deep Discount Demand), where strong positive delta initiated the impulse.
Price is now approaching the LVN (25,175–25,200) — an area that previously acted as imbalance and may now serve as support.
If the market retraces into this zone, it will test whether institutional buyers remain active within the prior demand structure.
Execution Plan
Bias: Long
Entry Zone 1: 25,175 – 25,200 (LVN retest)
Entry Zone 2: 25,000 – 25,030 (Deep Discount Demand – vPOC + VAL)
Take Profit 1: 25,365 (previous high)
Take Profit 2: 25,450 (extension target)
Trigger: Price compression and reaccumulation inside the demand zone
Technical Note
Entry should focus primarily on the LVN (25,175–25,200).
Compression analysis at this level must be handled carefully to confirm whether the movement represents true reaccumulation or passive absorption.
If price skips the LVN and retraces quickly toward the Deep Discount Demand (25,000–25,030), the setup becomes cleaner and easier to validate, as this zone holds the original impulse and stronger order flow.
At the moment, it remains uncertain whether the market will retrace or build a new value area above current levels, continuing the trend without a deeper pullback (>37.5%).
📅 Note: Friday’s NFP (Payroll) could trigger volatility and distort short-term efficiency.

Could we potentially have another bearish day? We have no real market structure shift on the higher timeframe, and there are still plenty of PD arrays below that remain unvisited. Yesterday’s daily candle was also bearish!

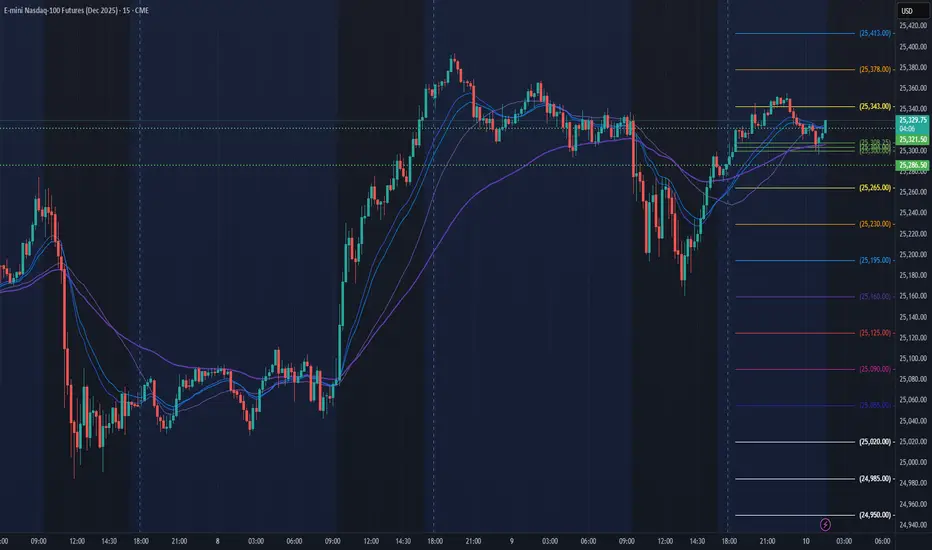
NQ Power Range Report with FIB Ext - 10/10/2025 SessionCME_MINI:NQZ2025
- PR High: 25321.50
- PR Low: 25286.50
- NZ Spread: 78.5
Key scheduled economic events:
08:30 | Nonfarm Payrolls
- Average Hourly Earnings
- Unemployment Rate
Session Open Stats (As of 12:45 AM)
- Session Open ATR: 264.53
- Volume: 19K
- Open Int: 287K
- Trend Grade: Long
- From BA ATH: -0.2% (Rounded)
Key Levels (Rounded - Think of these as ranges)
- Long: 26020
- Mid: 23571
- Short: 21939
Keep in mind this is not speculation or a prediction. Only a report of the Power Range with Fib extensions for target hunting. Do your DD! You determine your risk tolerance. You are fully capable of making your own decisions.
BA: Back Adjusted
BuZ/BeZ: Bull Zone / Bear Zone
NZ: Neutral Zone
A Pawn for a KingFact or Fiction; Truth or Falsehood; 1+1 = 2 or 1+1 = ...-3, -2, -1, 0, 1, 2, 3...; Order or Chaos.
The chaos caused by an explosion is recreated using math, algebra and geometry, not the other way around.
We live in a mathematically designed universal. It only makes sense that a Trading Plan should use mathematical principles.
A Pawn for a King Trading Plan stands on such principles. I used it to trade this most recent run up.
I will use 2 contracts of MNQ to illustrate this plan, thereby making it accessible to more people.
The px bounced on a very strong Support - the pink line. I got in at 24,994.5. Again, using +2 contracts of MNQ as an example. Now here is where the plan (i.e. the math) gets interesting - I sold 1 contract @ 24,994. I used 21.5 points for each target. My first target was 25,016. I sold 2 contracts @ 25,015.5. I continued this mathematical pattern for the rest of the run up - that is I added 22 points to each entry of +2 contracts and to each entry of -2 contracts.
It will look like this:
24,994.5 +1; 24,994 -1
24,994.5 +1; 25,016 -1
25,016.5 +1; 25,016 -1
25,016.5 +1; 25,038 -1
25,038.5 +1; 25,038 -1
25,038.5 +1; 25,060 -1
25,060.5 +1; 25,060 -1
25,060.5 +1; 25,082 -1
And so on. The last 2 trades were -2 @ 25,390 and +2 @ 25,390.5. This left me 1L. Then the px pulled back. Using this example, you would have made $690.48 profit.
Now it gets very interesting. Compounding profits kick in. At 25,390 I sold 2 contracts. I always try to get about a 200-point pullback. It bounced at support 25,192.5 - a 197-point pullback. I bot back one of the -2 25,390 contracts. 197 points x 1 contract x $2.00 per point - Commission (.91 x 2) = $392.18 profit. Then I started the process all over again using the same pattern as listed above. It looks like this:
25,192.5 +1; 25,192 -1 this is the 1 contract I just made $392.18 profit on
25,192.5 +1; 25,192 -1
25,192.5 +1; 25,214 -1
25,214.5 +1; 25,214 -1
25,214.5 +1; 25,236 -1
25,214.5 +1; 25,236 -1
25,236.5 +1; 25,236 -1
25,236.5 +1;
25,236.5 +1;
This is where the trade stands right now. Profit so far on this leg: 21.5 points x 2 contracts x $2.00 per point - Commission (.91 x 4) = $82.36 x 2 = $164.72 profit
Total profit:
$690.48 + $392.18 + $164.72 = $1,247.38
I know this is a lot of detail and sounds confusing. Once you do this it will become very clear, and you will see the simplicity. I've given you enough detail so you can do it. Now I challenge you to demo trade it. It is very important that the first trade you enter is divisible by 2 and that the first sell order is .5 x that first entry quantity (i.e. .5 x 2) and slightly less. I make it $.50 less. If I made it $.25 less the chance of creating a wash trade would increase and I don't want to hear from the trade desk for doing so.
You will soon see that this plan grows profits exponentially.

NQ UpdateI guess it doesn't matter that the gap below didn't fill all the way. Remaining gap is really small anyways.
MFI indicators seem to be working again, went overbought before market opened so the algos sold it off. Amazing how resilient this market is, they sold off everything (commodities, crypto, index futures) AGAIN, and everything seemed to have bounced right back up.
On Investing dot com, I'm showing a gap after the one hour break, but it doesn't show here so not sure if it's real. Tomorrow is probably gonna be a whipsaw day anyways, small caps are forming a pennant.

LONG 1HOUR CHART - SL LOCAL LOWEntry long for 100 pips ... lets see.
SL LOCAL LOW
TP LOCAL TOP
SLM TRAILING

NQ Levels on this Thursday!As we begin the trading day on the Nasdaq 100 futures, I’m closely watching key structural levels that could set the tone for early momentum and intraday sentiment. The first area of interest is the overnight high, which often acts as an initial resistance zone where early buyers may hesitate or take profits. Above that, I’m monitoring the previous day’s high and any unfilled gap levels, as a clean break and hold above these could trigger a short-covering rally toward higher liquidity pools. On the downside, the overnight low and prior day’s value area low serve as immediate support, with a sustained break below opening the door for a deeper pullback toward the next volume node or demand zone. I’ll also pay attention to pre-market structure—whether we’re building acceptance within a range or showing directional imbalance—to gauge if the session is likely to develop into a trend day or rotational chop. Volume and order flow confirmation around these levels will ultimately dictate whether the Nasdaq 100 continues higher or retraces to test lower supports.

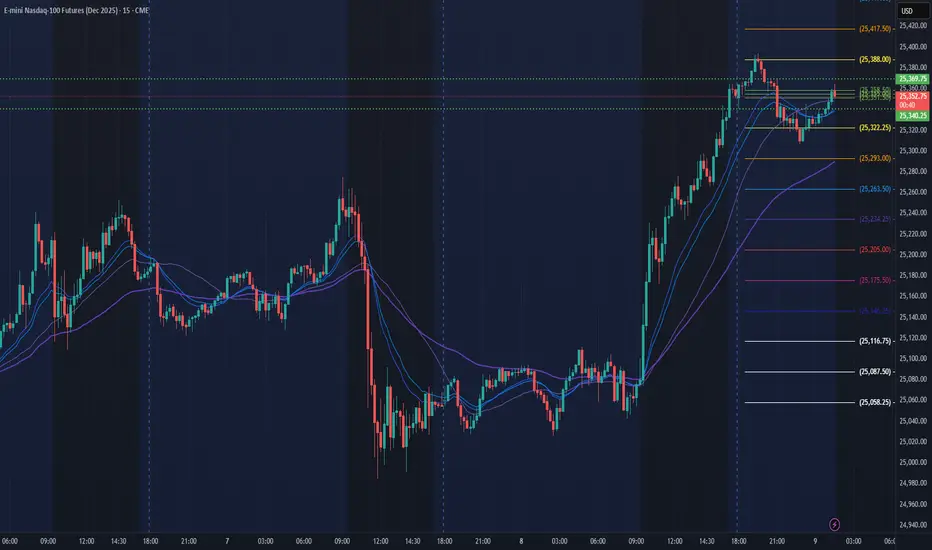
NQ Power Range Report with FIB Ext - 10/9/2025 SessionCME_MINI:NQZ2025
- PR High: 25369.50
- PR Low: 25340.50
- NZ Spread: 65.0
Key scheduled economic events:
08:30 | Initial Jobless Claims
- Fed Chair Powell Speaks
13:00 | 30-Year Bond Auction
Session Open Stats (As of 12:45 AM)
- Session Open ATR: 269.14
- Volume: 26K
- Open Int: 291K
- Trend Grade: Long
- From BA ATH: -0.2% (Rounded)
Key Levels (Rounded - Think of these as ranges)
- Long: 26020
- Mid: 23571
- Short: 21939
Keep in mind this is not speculation or a prediction. Only a report of the Power Range with Fib extensions for target hunting. Do your DD! You determine your risk tolerance. You are fully capable of making your own decisions.
BA: Back Adjusted
BuZ/BeZ: Bull Zone / Bear Zone
NZ: Neutral Zone
Location 15m NY Session 2 Oct 2025There are 3 setups based on a 15 minute structure on 2nd October 2025.
Location 1 :
- Structure breakout sell
Location 2 :
- Origin of structure breakout buy
Location 3 :
- Structure breakout buy

Location 15m NY Session 1 Oct 2025There is 1 setup based on a 15 minute structure on 15st October 2025.
Location 1 :
- Trend buy
- Structure breakout buy

Location 30m NY Session 1 Oct 2025There is 1 setup based on a 30 minute structure on 1st October 2025.
Location 1 :
- Trend buy
- Structure breakout buy

Final sell off ahead of FOMC | Head n ShouldersI believe price will stage one final sell-off before resuming its push toward higher highs. On the 4H chart, a potential Head & Shoulders pattern is forming, suggesting price may fill the hourly gap at 24,856 before or during the FOMC release.
The 15-minute chart offers a more precise entry compared to the 1H and 4H timeframes.
I plan to enter within the 25,149–25,150 price range, provided my bias remains valid heading into the New York open.
Lets get it!⚡
