Analysis of the NQ for the week of November 10 to 14, 2025Analysis based on a deep mathematical and scientific understanding of price action, particularly for my two markets NQ & ES. Looking forward to reading your comments.
Trade ideas
FVG & ORB5-Minute ORB + FVG Day-Trading Playbook (ES/NQ)
What you need
Platform: TradingView for markup; your execution platform (e.g., TopstepX / your broker) for orders.
Chart: ES (S&P 500 futures) or NQ (Nasdaq futures). Timeframe: 5 minutes.
Indicators:
Volume
Fair Value Gap
Key Levels (15-Min/5-Min Opening Range, New York Session or London)
Chicago time (your local): NY cash open is 8:30 a.m. CT. The “US evening reopen” (the Globex reopen) is 5:00 p.m. CT (use with caution; liquidity can be thin).
The strategy in one page
1) Define the Opening Range
Use the first 5-minute bar after the NY cash open (8:30:00–8:34:59 CT).
Mark ORH = that bar’s high, ORL = that bar’s low.
2) Direction filter = FVG
Bearish setup: Price breaks below ORL, and there is a bearish FVG nearby that has not been fully filled.
Bullish setup: Price breaks above ORH, and there is a bullish FVG nearby that has not been fully filled.
If an FVG fills/invalidates immediately after the break, skip the trade.
3) Entry
Enter on the break (or on a tiny retrace back to the level) in the FVG direction:
Below ORL with a short bias when a bearish FVG stands.
Above ORH with a long bias when a bullish FVG stands.
4) Stop & Target (bracket)
Stop: default at the opposite OR level (conservative).
Short below ORL → stop just above ORL (or the nearest invalidation level if tighter is justified).
Long above ORH → stop just below ORH.
Target: aim for 2R (risk:reward = 1:2), close above half, and trail the rest.
Example: If your stop is 10 ES points (=$500 per contract), target 20 ES points (=$1,000 per contract).
5) Risk per trade
Pick a fixed dollar risk that protects your account limits. With a $50k evaluation & ~$2,000 trailing max loss, many traders use $100–$300 per trade and micros (MES/MNQ) to scale precisely.
Contract & tick quick-ref
ES: 1 point = $50 (tick = 0.25, $12.50/tick)
NQ: 1 point = $20 (tick = 0.25, $5/tick)
MES (micro ES): 1 point = $5
MNQ (micro NQ): 1 point = $2
Sizing example, with MES (conservative)
You want a max loss of $200~300.
Signal requires 4 ES points to stop (=$200/contract).
Trade 1 ES or 4 MES (same risk), target 8 ES points for 2R.
Exact checklist (print this)
Pre-market
Chart on 5m, session = New York.
Mark ORH / ORL after the first 5-min bar closes.
Confirm bias by FVG: bullish FVG above / bearish FVG below, still unfilled.
News/Volatility check (FOMC/CPIs/major earnings): be extra cautious or skip.
Entry
Price breaks ORH/ORL in the same direction as the FVG.
No immediate fulfillment of that FVG.
Place bracket: Stop at opposite OR level (or clear invalidation), Target = 2R.
Manage
Set-and-forget if you struggle with tinkering.
If it snaps back and fully fills the FVG, early flattening is allowed by your rules (consistency > perfection).
No averaging losers.
Post-trade
Journal the screenshot, OR values, FVG state, R multiple, and any deviation from the plan.
When to skip
The first break immediately reverses and fully fills the FVG.
The OR is abnormally wide; the stop would exceed your risk budget.
Chop: multiple whipsaws through ORH/ORL within a few bars.
Event risk minutes away (e.g., CPI/FOMC); spreads/volatility unpredictable.
Low volume conditions (late sessions, holidays), unless your data says you have an edge there.
A realistic take on funded accounts & pacing
Evaluations often have daily loss, trailing drawdown, and max position rules. Treat the trailing specifically as if it’s glued to your closed PnL high-water mark—don’t let one impulsive add blow the account.
Keep resets rare by capping loss/day (e.g., 1–2R). One clean 2R win can offset two 1R losses.
Micros let you keep your exact dollar risk steady as the OR width changes day to day.
Routines that help
Two windows: TradingView (markup) and Execution DOM/ladder. Copy ORH/ORL and draw a rectangle for the FVG if your execution platform lacks the indicator.
Auto-brackets: pre-define your $ risk and 2R target so every entry is consistent.
Two sessions max: NY opens first; optionally, the US evening reopens (5:00 p.m. CT) only if your data says you have positive expectancy there.
Trade less, filter more: It’s normal to get 2–3 quality trades/week. No setup → no trade.
A compact rules card (copy/paste)
Timeframe: 5m. Levels: First 5-min bar → ORH/ORL.
Filter: Trade only with an unfilled FVG in the same direction as the OR break.
Entry: Break of ORH (long) or ORL (short).
Invalidation: FVG fully filled right after break → stand down/exit.
Stop: Opposite OR level (or nearest structure that truly invalidates).
Target: 2R.
Risk: Fixed $ per trade; use micros to fit the plan.
Daily max: 1–2R down → stop for the day.
Journal every trade (screenshot + R result + notes).
Journal template (quick)
Date / Ticker / Session (NY/Evening)
ORH / ORL values; OR width (points)
FVG direction & location (filled? unfilled?)
Entry price & rationale (break + FVG alignment)
Stop (points/$), Target (points/$), Size (contracts)
Outcome (R): __
Did I follow the plan? Y/N (what deviated?)
Screenshot link
Guardrails (important)
“Making money in days” is possible but not typical; survivorship bias is real. Your edge is strict filtering + small, repeatable risk + patience.
Commissions/slippage matter—micros help sizing but raise the per-rake cost %; include this in your journaling.
Don’t scale to full contracts until your live track record shows consistency over at least 20–30 trades following the exact rules.
Screener:
www.tradingview.com

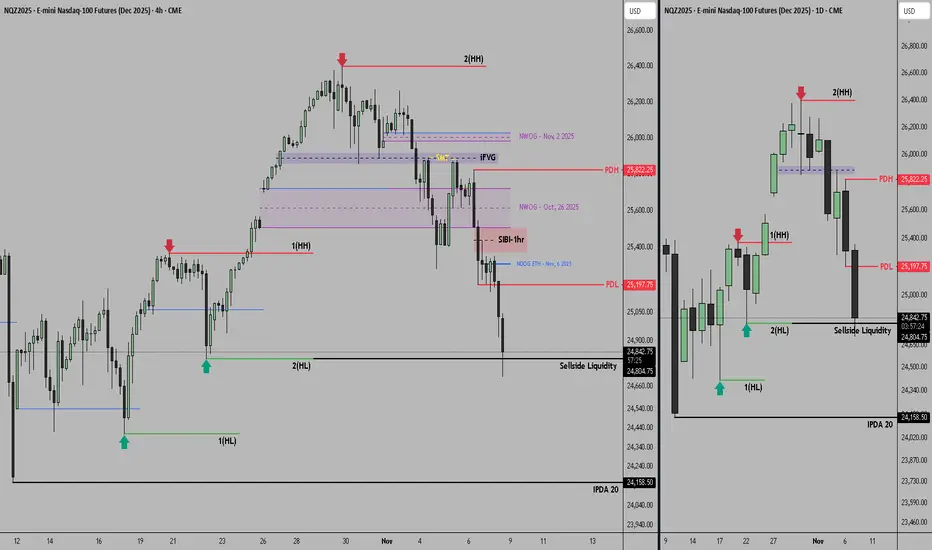
NQ NY Session Weekly Recap | November 2–7, 2025This 1hr chart with my EMAs 5, 10, 50 clearly show that as soon as price started to trade below the EMAs on Monday we started to fall and the 1hr timeframe kept trending below the EMAs where we could of had some great opportunities for shorts. Trading does not have to be complicated when you are following the trend.
The session indicator shows NY session 9:30am EST to 12pm where you find your opportunities to the downside.
#202545 - priceactiontds - weekly update - nasdaq e-miniGood Evening and I hope you are well.
comment: There is not much difference in my outlook compared to dax. This trend is steeper but it also bounced at expected support. Only a bear surprise could give us a third leg down. By bear surprise I mean staying below 25500 and making new lows early next week. The channel is clear and staying in it the most probable path forward next week.
current market cycle: bull trend (higher tf / weekly/monthly) and bear trend (4h/daily)
key levels for next week: 24700 - 25600
bull case: Every dip is heavily bought. That has not changed and so bulls bought where they had to. Now they want a re-test of the daily 20ema around 25460 and the bear trend line a bit higher. Friday’s reversal was strong enough that I expect at least 25400 and we could go for 25500 or even 25600. Above that my bearish thesis is wrong and there is no reason not to print a new ath.
Invalidation is below 24709.
bear case: For now it’s tough to see how this is getting rejected below 25400 to have a decent chance of a third leg. The higher we go, the less likely it will be but the bear trend line is valid until broken. For now my best guess is that we will go sideways for longer. Probably something between 24500 - 25600. For next week I want to see a move to 25400/25500 and then wait for a reaction from the bears.
Invalidation is above 25600.
short term: Slightly bullish for a bit higher before hoping for a rejection from the bears and another leg down - hopefully for 24000 but that’s a bit much for next week only.
medium-long term - Update from 2024-11-02: Market went further in the wrong direction so my targets become increasingly unrealistic. Right now the 50% retracement is 21750 and would mean a 18% drop. That’s a bit too much to ask for as of now. 23150 is the breakout-retest of the prior ath from 2024-12 and a more realistic target.

NQ consolidate US government shutdown and stock price overheat become downward issues. technically weekly chart show stochastic and candlestick pattern potensial make price going down for a few week ahead.
price will consolidation between last high and strong support. will see price next movement later

NQ Weekly Recap | November 2–7, 2025Hey everyone, this is the 1-hour chart. It shows the big picture of where price is going. We also use the 5-minute and 1-minute charts to find the exact spot to get in and put our stop loss nice and tight.This week NQ started around 26,400 and just kept falling, falling, falling… all the way down to 25,226. That’s over 1,100 points straight down! Price made a big rounded top (like a hill), then broke lower and never looked back. Every time it tried to bounce a little, the bounce was weak and got sold right away. Bears were in full control. Why was this so easy to trade? Because we only traded WITH the trend. Rule #1 for beginners: the trend is your friend. Going against it is hard. Going with it is like floating downstream instead of swimming upstream. Here’s exactly what we did every day in the New York session: Tuesday: price broke the last low (break of structure), we shorted the small bounce back.
Wednesday: another break lower, shorted the bounce again.
Thursday: opened with a gap down, jumped in on the 5-minute chart and rode it.
Friday: price sped up into the close, took the last piece on the 1-minute chart.
We never guessed. We waited for a clear break, shorted the weak bounce, put stop above the old low, and let the move run. Simple. If you’re new: stick to the 1-hour for direction, drop to 5-minute or 1-minute to pull the trigger. Trade with the trend. That’s it. Still no sign of bulls taking over. Trend is down until price proves otherwise.

Government ShutdownGaps all the way down to the 18k's on MNQ are evident since the occurences.News creates direction of the market's bias. We shall see 18k's again. Mark my words! That's why Robert Kiyosaki says BUY GOLD. and the stochastics are on the verge of breaking down to the 20's so thats a slight confirmation, we just need to break the first area of resistance that the 11.7 candle printed with the death doji

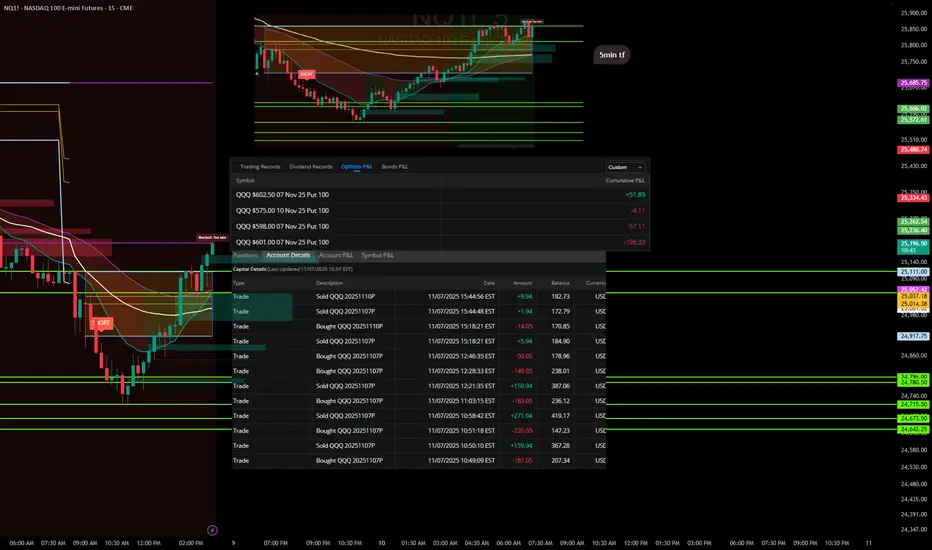
Trades with B – Daily Recap (Nov 7, 2025) "Lesson Learned"Ticker: QQQ / NQ1!
Strategy: ORB Pro + Fib Confluence + EMA Trend Filters
Result: Small red day – self-inflicted
🧭 Market Context
Today’s price action gave a clear short opportunity during the mid-morning fade, but momentum stalled mid-session. The first entries lined up beautifully with the ORB breakdown and EMA confluence, offering solid profits early on.
Where it fell apart was after the first wins — I overstayed, chasing secondary flushes that never came. The market started to base, and I kept expecting continuation instead of taking what the chart gave me.
📉 Trade Summary
Multiple put entries between $601–$602 levels
Early trades locked quick gains (+$271.94, +$159.94)
Gave back a chunk re-entering late into chop
Final P/L across contracts: -$205.66 total
Cumulative Options P/L breakdown:
QQQ $602.50 07 Nov 25 Put – +$51.89
QQQ $575 10 Nov 25 Put – -$4.11
QQQ $598 07 Nov 25 Put – -$57.11
QQQ $601 07 Nov 25 Put – -$196.33
💡 Lessons & Takeaways
The first clean move is often the best move. Don’t overcomplicate a confirmed win.
Late-day trades = low probability. Volume dries up, conviction fades.
Protect the capital, not the ego. There’s no “making up” missed points — only protecting what’s already earned.
🧘♂️ Reflection
“The setup worked, but I didn’t. I tried to extract more from a move that was already complete. Next time, once my target hits, I’m walking away.”
$NQ this week price action as per ICTSEED_ALEXDRAYM_SHORTINTEREST2:NQ this week price action as per ICT
-HTF MMSM (Market maker sell model)
Trades with B – Daily Recap (Nov 6 2025)Ticker: QQQ / NQ1! (5 min & 15 min TF)
Strategy: ORB Pro + Golden Pocket Retest + Volume Filter
Focus: Confirmation Entry + HTF Trend Confluence
🧭 Market Context
The Nasdaq futures (NQ1!) opened with a sharp push into a key supply zone marked by the previous day’s Golden Pocket.
After an early fake push up, the market rolled over cleanly beneath the EMA cluster and the ORB box on both timeframes.
The first true confirmation signal came mid-morning — the 15 min and 5 min timeframes synced short, and the volume aligned perfectly with trend continuation.
🧠 Trade Review
Entry: 11:02 EST QQQ $613 Put (ORB Pro Short Trigger)
Exit: 11:35 EST — ORB extension target hit → secured profit into momentum flush
System Validation: Perfect alignment across EMA trend + HTF bias + retest rejection signal
P/L: +$199.78 net profit ( + $289.94 closed gain – $190.05 entry cost )
This trade was clean — confirmation entry, defined risk, and no over-trading.
📊 Performance Snapshot
Metric Value
Win Rate 100 % (today’s single trade)
Best Trade +$289.94
Largest Loss – $190.05
Net Result +$199.78 (Realized)
Setup Accuracy Excellent – Full confirmation alignment
📈 Chart Breakdown
The ORB Pro short triggered as price retested the upper Golden Pocket zone and failed to hold above the purple EMA band.
Both the 15 min and 5 min charts show a clean EMA curl-down with volume confirmation.
The short target zone was hit precisely before a small midday bounce, validating the system’s filter timing.
💡 Key Takeaways
Wait for alignment – when HTF and LTF agree, you get momentum moves.
Clean entry > early entry – confirmation beat anticipation again.
ORB Pro filter precision – blocked late entries, protecting the green.
🧘♂️ Reflection
“The setup was textbook — patience finally paid off. One trade, one signal, and one profit. The goal now is simple: keep filtering for these perfect alignments and size up responsibly as consistency builds.”
🧩 Next Steps
✅ Focus only on HTF + LTF confirmation signals
✅ Avoid re-entries once target zone is hit
✅ Document each setup screenshot for pattern library

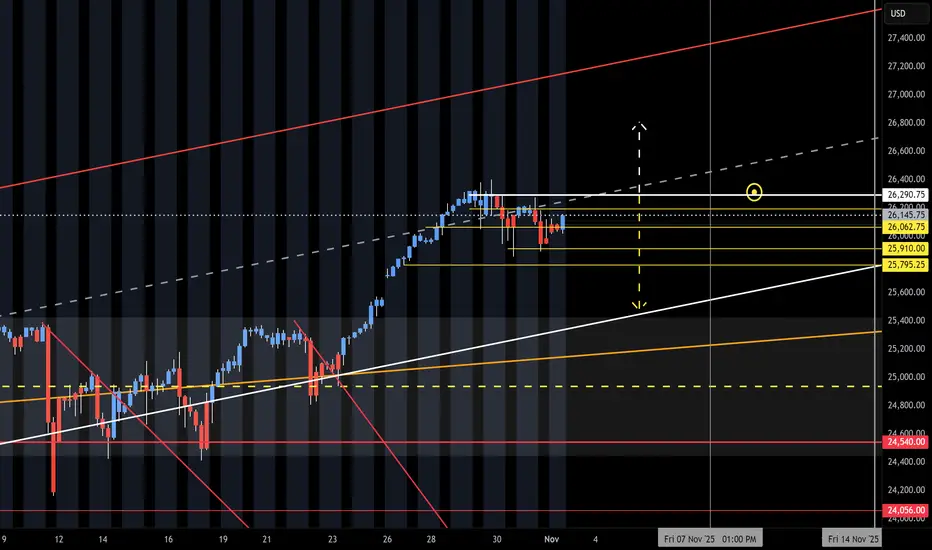
NQ Range (11-03-25, Week 6)The F-M Long move is on with new month and O/N Gap Open UP. Curveball form Friday Close and late head fake. Again, the NAZ will have to use the O/N to lift it back up. Need to see how the Open Drive and Reg Session reacts to the low volume O/N lift. Run up to upper target above KL 26,290 and Short on reject of. Under 290 is a potential drop to 25k or 25,550.
Trying to go short but the demo platform is extremely glitchyTrying to go short and doing so but difficult to manage with glitchy platform.


NQI love the way this monthly chart for NQ is respecting the upward channel. If it fell to the middle line of the channel it is still overall bullish....
Note: check back in a few months

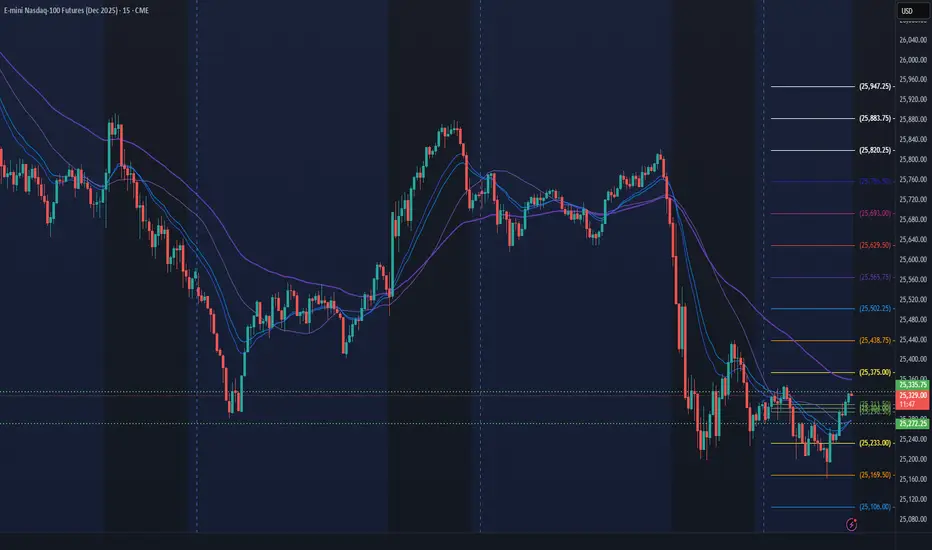
NQ Power Range Report with FIB Ext - 11/6/2025 SessionCME_MINI:NQZ2025
- PR High: 25335.75
- PR Low: 25272.00
- NZ Spread: 142.75
No key scheduled economic events
Session Open Stats (As of 2:55 AM)
- Session Open ATR: 420.01
- Volume: 55K
- Open Int: 296K
- Trend Grade: Long
- From BA ATH: -4.0% (Rounded)
Key Levels (Rounded - Think of these as ranges)
- Long: 26636
- Mid: 25410
- Short: 24039
Keep in mind this is not speculation or a prediction. Only a report of the Power Range with Fib extensions for target hunting. Do your DD! You determine your risk tolerance. You are fully capable of making your own decisions.
BA: Back Adjusted
BuZ/BeZ: Bull Zone / Bear Zone
NZ: Neutral Zone
How Global Markets Are Responding to Economic Shifts1. Price discovery and the immediate reaction
When new economic data or events arrive (jobs reports, CPI numbers, trade disruptions, or political shocks), markets move almost instantaneously to incorporate the information. High-frequency trading and algorithmic strategies often amplify initial moves — a surprise inflation print can trigger a sharp sell-off in bonds and a near-instant repricing of interest rate expectations. Equities typically show the widest variance by sector: interest-rate sensitive sectors (real estate, utilities) fall faster when rates spike, while commodity producers and cyclical industries may rally if the data imply stronger demand.
2. Interest rates and bond market mechanics
The bond market is the backbone of market response. Expectations about central bank policy — the path of short-term rates and the pace of balance-sheet actions — are priced into government yields globally. If inflation surprises on the upside or central banks signal tighter policy, yields rise and bond prices fall. This yields shock affects everything: higher yields increase the discount rate used to value equities, lower present values of future corporate earnings, and raise borrowing costs for companies and households. Conversely, signs of slowing growth or deflation risk push yields down, often boosting long-duration assets (growth stocks, long bonds).
3. Equity markets: winners, losers, and rotation
Stock markets reflect both macro outlooks and company-level fundamentals. In a growth-acceleration scenario, cyclicals, industrials, and small-cap stocks often outperform as investors rotate into riskier, higher-beta assets. In a growth-slowdown, defensive sectors (consumer staples, health care) and dividend-paying stocks usually offer relative safety. Market breadth and leadership shifts matter: when a handful of mega-cap tech companies are driving indices, the headline index may mask a narrower market. Active managers watch these leadership signals to rotate exposures.
4. Currency markets and capital flows
Currencies are real-time indicators of comparative economic strength and monetary policy. A central bank expected to raise rates will typically see its currency appreciate as yield-seeking capital flows in. Conversely, risk-off episodes trigger “flight-to-safety” flows toward reserve currencies (commonly the US dollar), pushing emerging-market and commodity-linked currencies lower. Persistent trade imbalances, capital controls, and sovereign risk perceptions also shape currency moves, which then feed back into inflation and corporate earnings through import costs and translation effects.
5. Commodities and real assets
Commodities react to both demand expectations and supply shocks. Energy prices surge with geopolitical tensions or supply disruptions, while industrial metals track global manufacturing health. Inflationary episodes often raise real asset prices — commodities and real estate can act as inflation hedges — but the relationship isn’t perfect and depends on real yields and growth expectations. Agricultural commodities can respond to weather and logistics as much as to macro demand.
6. Volatility, risk premia, and the cost of hedging
Economic shifts increase uncertainty, and volatility is the market’s “fear gauge.” Rising volatility raises the cost of hedging (options become more expensive), which alters trading strategies and risk management. Investors demand higher risk premia for holding volatile assets; this can push required returns up and valuations down. Institutional players often recalibrate portfolio risk — reducing leverage, increasing cash, or buying volatility protection — which can exacerbate short-term price moves.
7. Credit markets and corporate financing
Corporate bond spreads widen when growth fears or credit concerns rise, reflecting higher default risk or liquidity premiums. Tighter credit conditions hurt leveraged companies first, possibly slowing investment and hiring. Conversely, easier financial conditions (lower borrowing costs, ample liquidity) support refinancing, M&A activity, and risk-taking. The health of the banking system and non-bank lenders matters: stress in credit intermediation channels can transmit shocks to the broader economy quickly.
8. Policy responses and market feedback loops
Markets react not just to events but to the expected policy responses. Central banks and fiscal authorities monitor market signals closely. Sometimes markets move because investors anticipate policy easing or tightening; other times, central banks move because markets have moved (e.g., to restore stability). This two-way feedback can create virtuous cycles (confidence begets investment) or vicious ones (sell-offs trigger credit tightening). Transparency and forward guidance from policymakers help stabilize expectations, but surprises still cause sharp market adjustments.
9. Structural and technological influences
Market structure and technology have changed how responses unfold. Algorithmic trading, ETFs, and passive investment have altered liquidity patterns; large flows in and out of ETFs can amplify moves in underlying assets. Global interconnectedness means shocks travel faster — a manufacturing slowdown in one region quickly impacts supply chains and corporate earnings elsewhere. At the same time, data availability and analytics allow investors to react faster and to hedge with more precise instruments.
10. Longer-term asset allocation shifts
Sustained economic shifts—like a multi-year inflation regime change, deglobalization, or energy transition—reconfigure long-term allocations. Investors may favor real assets, shorten duration in fixed income, overweight certain regions, or increase allocations to alternatives (private equity, infrastructure) that offer different risk-return profiles. Pension funds and insurers, with long-dated liabilities, pay special attention to regime shifts because they directly affect funding ratios and required returns.
Conclusion — pragmatic lessons for investors
Markets are efficient at processing new information, but they are not always rational. Short-term reactions can be loud and disorderly; medium-term trends matter more for portfolios. Key practical takeaways: (1) watch interest-rate expectations and real yields — they shape valuations across assets; (2) track leadership and breadth in equity markets — it tells you if moves are broad-based or concentrated; (3) manage liquidity and hedging costs — volatility can spike unexpectedly; and (4) focus on scenario planning rather than prediction. A disciplined, diversified approach that explicitly considers how different assets respond to rate, growth, and inflation shocks will navigate economic shifts more successfully than one that chases yesterday’s winners.

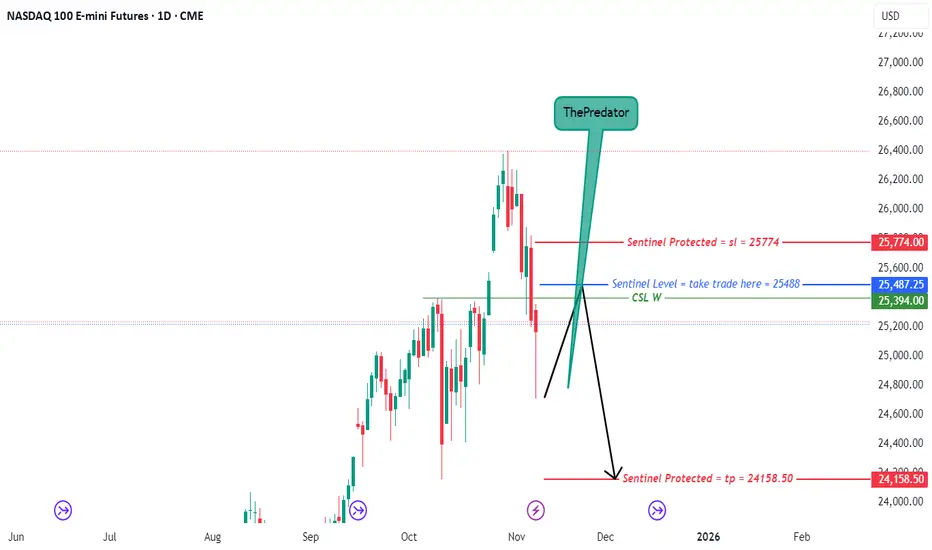
NQ Nasdaq down to 24,900? Or rebound?The next level lower for NQ is 24,900. This price level also has confluence with the daily 200 EMA. Is there enough buyer interest to rebound before dropping to this level? Or, is this just a healthy pullback? Do you think NQ can go lower?

November 11 Trade Set Up rade Setup: NQ/MNQ/US100 (Short-Term: 4H/Daily Bias)
Bias: Profitable short-swing + mean-reversion, favoring range expansion and round-level confirmation.
Short Entry Zone:
Near 25,300-25,325 if price rejects this resistance, especially after a failed London/US bounce.
Confirmation: 4H candle wicks + volume spike + reversal signal (e.g., bearish engulfing or rejection at resistance).
Seasonals: Continued downside during post-earnings, pre-FOMC weeks.
Target:
First target: 25,226.50 (Asian session low, minor support).
Second target: 25,000 (full round level, cycle pivot, daily support).
Stop Loss:
Above 25,438 (cycle high, 4H resistance).
Alternative: ATR-based stop at ~110-130 pts above entry for MNQ/NQ intraday.
R/R:
Minimum 2:1 (Entry 25,300, first target 25,226, SL at 25,438 = 74 pts reward, 138 risk).
Mean-Reversion Alternative:
If price spikes below 25,000 intraday and prints a reversal (hammer, bullish divergence on 1H/4H), consider long scalp back toward 25,300.

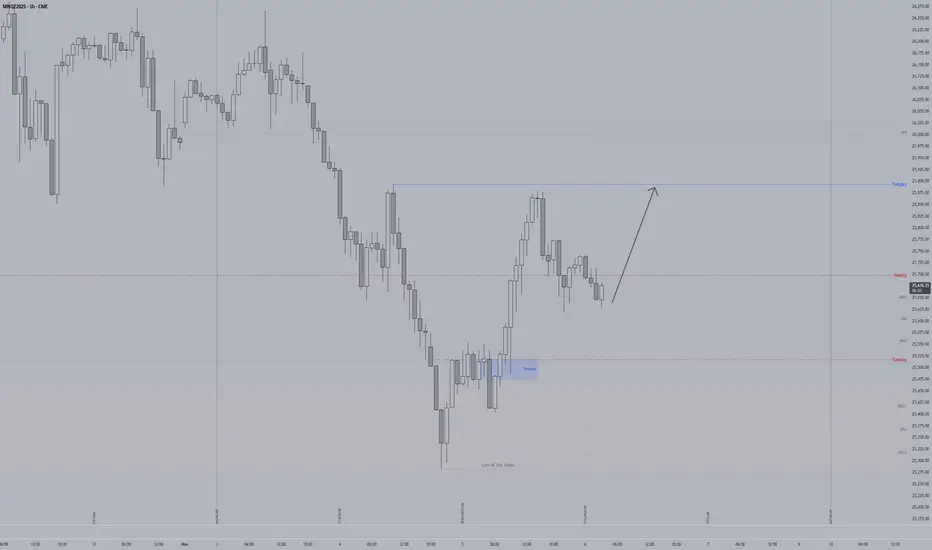
Nasdaq reversa 6-11-25Sellers were absorbed in that area, and the Nasdaq will likely reverse from this point in the coming days.
If it breaks through the supply zone, the trend could turn bullish in the next few days.

NQ week 45Last weeks chart didn't have the fib levels to guess the tops so the chart quickly became invalid. I added the fib levels this week and posting on the 1hr instead of the 15min timeframe.
T.A explained -
BS & FS levels are expected support when dashed lines, tested when dotted and resistance when solid lines.
The inverse is true for the Inv. BS Inv. FS levels, they are resistance as dashed lines, tested as dotted and support as solid lines.
Monthly timeframe is color pink
weekly grey
daily is red
4hr is orange
1hr is yellow
15min is blue
5min is green if they are shown.
strength favors the higher timeframe.
2x dotted levels are origin levels where trends have or will originate. When trends break, price will target the origin of the trend. its math, when the trend breaks, the vertex breaks too so the higher timeframe level/trend that breaks, the more volatility there could be as strength in the orders flow in to fuel the move.


2 losses, could've gone full out. Could've made profit on the day but I saw a different narrative, we go again tomorrow.

Long towards Relative Equal HighsLong scenario for a Thursday reversal after major sellside levels have been triggered and a Breaker formed in Wednesday. Wednesday's high resides just below Tuesday's which makes the Buyside likely to get delivered.